• 概要
  • レビュー (16)
  • コメント (38)
  • 最新情報

Volume by Price MT4

4.6

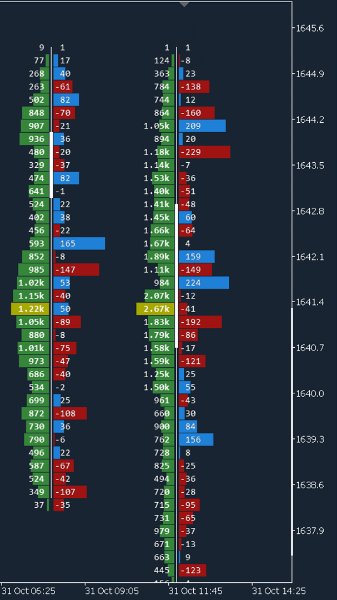
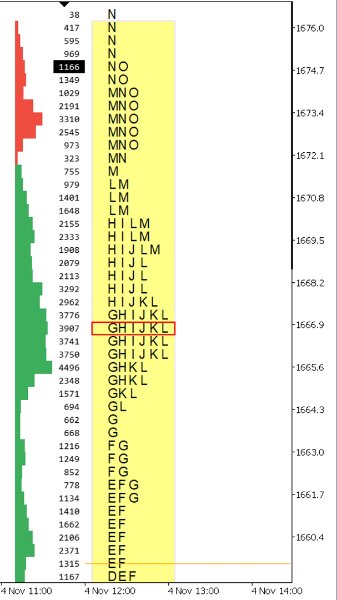
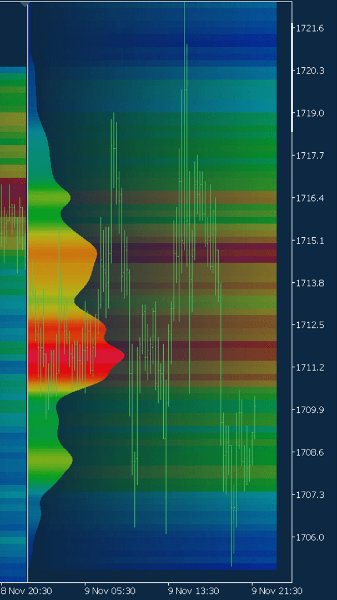
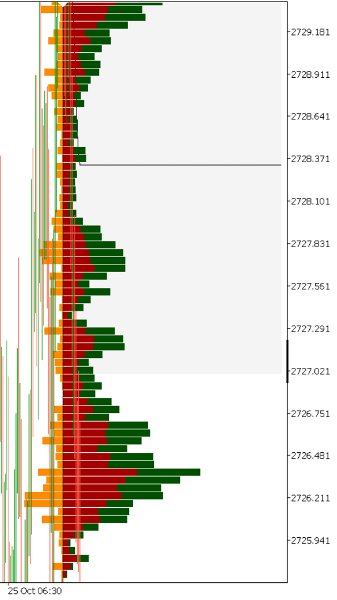
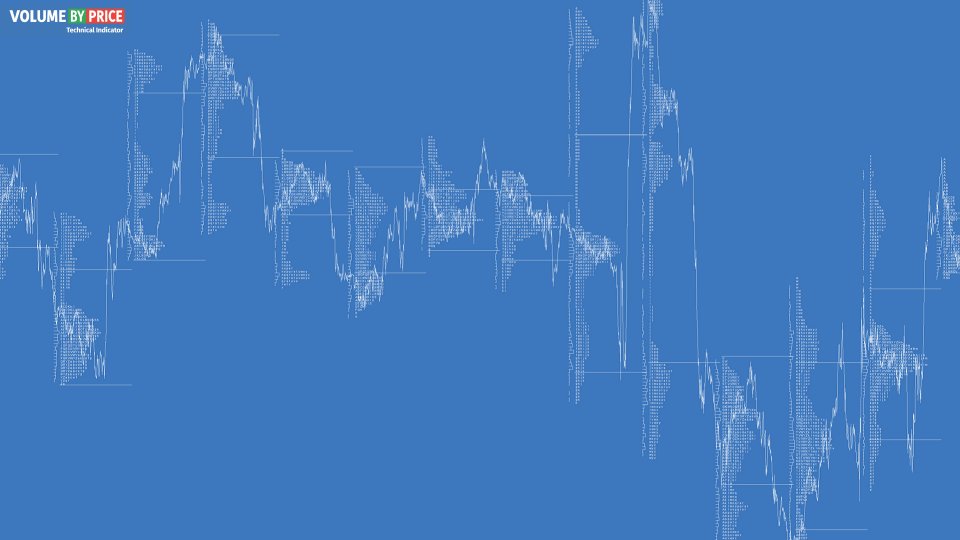
The Volume by Price Indicator for MetaTrader 4 features Volume Profile and Market Profile TPO (Time Price Opportunity). Volume and TPO histogram bar and line charts. Volume Footprint charts. TPO letter and block marker collapsed and split structure charts. Static, dynamic and flexible range segmentation and compositing methods with relative and absolute visualizations. Session hours filtering and segment concatenation with Market Watch and custom user specifications. Graphical layering, positioning and styling options to suit the user's analytic and aesthetic needs.

Volume Profile and Market Profile TPO Point of Control (VPOC and TPOC), Count, Balance, Imbalance, Value Area (VA) and High and Low Volume Nodes (HVN and LVN) with visualization and evaluation by multiple methods and a wide range of user-definable variables to apply with all disciplines and studies. Delta Volume Profile and Footprint charts with volume classification by price action or order type*. Additionally includes Initial Balance (IB), Volume Weighted Average Price (VWAP), and Volume by Time histogram and bubble charts to perform Volume Spread Analysis (VSA) and Volume Price Analysis (VPA).

A suite of technical analysis data visualization tools to display the complex relations between volume, price and time in various easy to interpret forms. Data Source API for data connector extensions and user file feeds to have full control over the scope and type of data beyond native brokerage provisioning. Tick volume, trade volume or open interest. Data Environment API for extension and developer programmatic access to dimensions and metrics. Includes Traces, Events, Notifications and Reports extensions, and code sample resources for automated algorithmic trading strategies.

High-level chart setups with drag and drop support for the casual user, and further in-depth and segmented by using advanced user features. For a quick start browse example compositions and download chart templates. For details on configuration options and methods see documentation.


Extensions and Resources  ·  Also available Volume by Price MT5  ·  Watch on YouTube


Free demo limitations: Distribution with chart timeframe period price data. Range of 200 bars. Up to 5 segments.
* Available via the Data Source API, requires MetaTrader 5 terminal or third-party data feed connection

レビュー 16
Sara Sabaghi
21915
Sara Sabaghi 2023.02.11 11:09 
 

Great job. you did it well. to support and respect for nice and inspiring tools in this market

Felmer Magbanua Blanca
292
Felmer Magbanua Blanca 2022.09.12 20:58 
 

Indeed Institutional trades

barko9
160
barko9 2022.04.11 13:14 
 

perfect indicator for day trading and scalping first i rented it i liked it and now i bought it thanks brian

おすすめのプロダクト
これは、キャンドルの終値を予測する指標です。 このインジケータは、主にD1チャートでの使用を目的としていますが. この指標は、従来の外国為替取引とバイナリオプション取引の両方に適しています。 インジケーターは、スタンドアロンのトレーディングシステムとして使用することも、既存のトレーディングシステムへの追加として機能させることもできます。 このインジケーターは、現在のキャンドルを分析し、キャンドル自体の内部の特定の強度係数と、前のキャンドルのパラメーターを計算します。 したがって、この指標は、市場の動きのさらなる方向性と現在のキャンドルの終値を予測します。 この方法のおかげで、この指標は、短期の日中取引だけでなく、中期および長期の取引にも適しています。 インジケーターを使用すると、市場の状況の分析中にインジケーターが生成する潜在的な信号の数を設定できます。 インジケーターの設定には、このための特別なパラメーターがあります。 また、インジケーターは、チャート上のメッセージの形式で、電子メールで、およびPUSH通知の形式で、新しい信号について通知することができます。 購入後は必ず私に書いて
Was: $249  Now: $99   Market Profile defines a number of day types that can help the trader to determine market behaviour. A key feature is the Value Area, representing the range of price action where 70% of trading took place. Understanding the Value Area can give traders valuable insight into market direction and establish the higher odds trade. It is an excellent addition to any system you may be using. Blahtech Limited presents their Market Profile indicator for the MetaTrader community. Ins
Noize Absorption Index - is the manual trading system that measures the difference of pressure between bears forces and bulls forces. Green line - is a noize free index that showing curent situation. Zero value of index shows totally choppy/flat market.Values above zero level shows how powerfull bullish wave is and values below zero measures bearish forces.Up arrow appears on bearish market when it's ready to reverse, dn arrow appears on weak bullish market, as a result of reverse expectation. S
TWO PAIRS SQUARE HEDGE METER INDICATOR Try this brilliant 2 pairs square indicator It draws a square wave of the relation between your two inputs symbols when square wave indicates -1 then it is very great opportunity to SELL pair1 and BUY Pair2 when square wave indicates +1 then it is very great opportunity to BUY pair1 and SELL Pair2 the inputs are : 2 pairs of symbols         then index value : i use 20 for M30 charts ( you can try other values : 40/50 for M15 , : 30 for M30 , : 10 for H1 ,
The Penta-O is a 6-point retracement harmonacci pattern which usually precedes big market movements. Penta-O patterns can expand and repaint quite a bit. To make things easier this indicator implements a twist: it waits for a donchian breakout in the right direction before signaling the trade. The end result is an otherwise repainting indicator with a very reliable trading signal. The donchian breakout period is entered as an input. [ Installation Guide | Update Guide | Troubleshooting | FAQ | A
Basic Support and Resistance インジケータは、テクニカル分析を強化するために必要なソリューションです。このインジケータを使用すると、チャートにサポートレベルとレジスタンスレベルを投影できます/ mt5バージョン 機能 フィボナッチレベルの統合: サポートと抵抗レベルとともにフィボナッチレベルを表示するオプションを使用すると、私たちの指標は市場行動と逆転領域の可能性についてさらに深い洞察を提供します。 パフォーマンスの最適化: 各バーの開口部のみで拡張ラインを更新するオプションを使用すると、インジケータは、サポートレベルと抵抗レベルの精度を犠牲にすることなく最適なパフォーマンスを保証します。 入力 メイン設定 Timeframe:  この入力を通じて、より高い時間枠のサポートラインとレジスタンスラインをチャート上に表示することを選択できます。 Support/Resistance Strength [Number of Bars]:  この入力を使用して、サポートと抵抗の強度を決定できます。数が高いほど、サポート/抵抗がより強くなります。 Pri
The indicator allows you to trade binary options. The recommended time frame is М1 and the expiration time is 1,2,3 minutes. The indicator suitable for auto and manual trading. A possible signal is specified as a arrows above/under a candle. You should wait until the candle closes! Arrows are not re-painted Trade sessions: TOKYO section (Half-end) Currency pairs: USD/JPY Working time frame: M1 Expiration time: 1,2,3 minutes. The indicator also shows good results when using the martingale strateg
FREE
A technical indicator that calculates its readings on trading volumes. In the form of a histogram, it shows the accumulation of the strength of the movement of the trading instrument. It has independent calculation systems for bullish and bearish directions. Works on any trading instruments and time frames. Can complement any trading system. The indicator does not redraw its values, the signals appear on the current candle. It is easy to use and does not load the chart, does not require additi
Volume Profile Indicator for MT4 Gain a trading edge with the "Volume Profile" indicator for MetaTrader 4 (MT4). This advanced technical analysis tool allows you to precisely identify key support and resistance levels based on transaction volume. Easily visualize market areas of high interest, where trading volumes are highest, and use this information to make more informed trading decisions. Key Features: Clear and detailed visualization : The indicator displays volume histograms directly on th
For sure, this indicator has become very popular amongst traders. Through coding this indicator will give you the most accurate levels possible for your trading analysis. We have also added in the ability for you to receive alerts when the price breaks above or below a Support or Resistance lines! HOW TO USE The red rectangles represent your resistance/supply zone. The green rectangles represent your support/demand zone.  BONUS FEATURES We coded this indicator with the ability to switch between
Super Reversal Pattern Indicator Unlock the power of advanced pattern recognition with our Super Reversal Pattern Indicator. Designed for traders seeking precision and reliability, this indicator identifies one of the most effective reversal patterns in technical analysis, offering a significant edge in your trading strategy. Key Features: Non-Repainting Accuracy: Enjoy the confidence of non-repainting technology. Once a Super Reversal Pattern is detected, it remains static, providing consis
The Best One Scalping Trade Panel functional manual trade panel with risk reward, auto SL by candle ( original solution), lot size calculation, one-click trading, scale in and out of trades (partial close),  Works with all symbols not just currency pairs, perfect works on DAX, NASDAQ, GOLD, ...... I earn every day during live stream on ZakopiecFX - join Me Risk by lot Risk by percent SL by points SL by Candle, Renko, RangeBar ( original solution) TP by point TP by Risk/Reward Auto Trailing b
Descption: The Volume Profile displays detailed informations of historical trading activities at certain price levels (Market Profile). So you can locate the areas with the best prices in the market and get an advantage about other market participants. Features: Customizable Volume Profile / Market Profile Shows the "fair" Value Area with 70% of all Volume Shows critical low volume zones Shows VPOC, VAL and VAH Points Works on all timeframes Also available for MT5 ( https://www.mql5.com/en/m
BoxChart MT4
Evgeny Shevtsov
4.5 (6)
The market is unfair if only because 10% of participants manage 90% of funds. An ordinary trader has slim changes to stand against these "vultures". This problem can be solved. You just need to be among these 10%, learn to predict their intentions and move with them. Volume is the only preemptive factor that faultlessly works on any timeframe and symbol. First, the volume appears and is accumulated, and only then the price moves. The price moves from one volume to another. Areas of volume accumu
インディケータは現在のクオートを作成し、これを過去のものと比較して、これに基づいて価格変動予測を行います。インジケータには、目的の日付にすばやく移動するためのテキスト フィールドがあります。 オプション: シンボル - インジケーターが表示するシンボルの選択; SymbolPeriod - 指標がデータを取る期間の選択; IndicatorColor - インジケータの色; HorisontalShift - 指定されたバー数だけインディケータによって描画されたクオートのシフト; Inverse - true は引用符を逆にします。false - 元のビュー。 ChartVerticalShiftStep - チャートを垂直方向にシフトします (キーボードの上下矢印)。 次は日付を入力できるテキストフィールドの設定で、「Enter」を押すとすぐにジャンプできます。
Profile Map
Dmitriy Sapegin
5 (11)
Market Profile helps the trader to identify the behavior if major market players and define zones of their interest. The key feature is the clear graphical display of the range of price action, in which 70% of the trades were performed. Understanding of the location of volume accumulation areas can help traders increase the probability of success. The tool can be used as an independent system as well as in combination with other indicators and trading systems. this indicator is designed to suit
Mean Reversion Supply Demand Indicator Mean Reversion Supply Demand is the indicator to detect the important supply demand zone in your chart. The concept of supply demand trading relies on the quantity mismatching between buying and selling volumes in the financial market. Typically, supply demand zone serves to predict the turning point. The wave pattern, for any supply demand zone to work as an successful trade, looks like the price must touch the base zone, move away and then return to zone
Owl smart levels
Sergey Ermolov
4.34 (35)
MT5版  |   FAQ Owl Smart Levels Indicator   は、 Bill Williams   の高度なフラクタル、市場の正しい波構造を構築する Valable ZigZag、エントリの正確なレベルをマークする Fibonacci レベルなどの一般的な市場分析ツールを含む 1 つのインジケーター内の完全な取引システムです。 利益を得るために市場と場所に。 戦略の詳細な説明 インジケータを操作するための指示 顧問-取引助手 プライベートユーザーチャット ->購入後に私に書いて、私はプライベートチャットにあなたを追加し、あなたはそこにすべてのボーナスをダウンロードすることができます 力はシンプルさにあります! Owl Smart Levels   取引システムは非常に使いやすいので、専門家にも、市場を勉強し始めて自分で取引戦略を選択し始めたばかりの人にも適しています。 戦略と指標に秘密の数式や計算方法が隠されているわけではなく、すべての戦略指標は公開されています。 Owl Smart Levels を使用すると、取引を開始するためのシグナルをすばやく確認し、
Requirements Optimized to work with   EURUSD-EURCHF-USDJPY, AUDUSD-CADJPY-AUDNZD, CHFJPY-NZDJPY-NZDUSD For timeframe 4H. *(Minimum recommended deposit is $300 for each Pair) for initial lot set to 0.10, My favorite Pair are (CHFJPY-NZDJPY-EURUSD-AUDNZD-USDJPY) Warning it will be SALE only 5 Copys at 60$ Then it will be update up to 200$  You can use it the way it is, For new Set Files will be add on (Comments) ECN broker with low spread is recommended to get better results. Setup is
This is a trend indicator without redrawing Developed instead of the binary options strategy (by the color of the Martingale candlestick) Also works well in forex trading When to open trades (binary options) A signal will appear in the place with a candle signaling the current candle It is recommended to open a deal for one candle of the current timeframe M1 and M5 When a blue dot appears, open a deal up When a red dot appears, open a trade down. How to open trades on Forex. When a signal is rec
VR Cub
Vladimir Pastushak
VR Cub は、質の高いエントリーポイントを獲得するためのインジケーターです。このインジケーターは、数学的計算を容易にし、ポジションへのエントリーポイントの検索を簡素化するために開発されました。このインジケーターが作成されたトレーディング戦略は、長年にわたってその有効性が証明されてきました。取引戦略のシンプルさはその大きな利点であり、初心者のトレーダーでもうまく取引することができます。 VR Cub はポジション開始ポイントとテイクプロフィットとストップロスのターゲットレベルを計算し、効率と使いやすさを大幅に向上させます。取引の簡単なルールを理解するには、以下の戦略を使用した取引のスクリーンショットを見てください。 設定、設定ファイル、デモ版、説明書、問題解決方法は、以下から入手できます。 [ブログ] レビューを読んだり書いたりすることができます。 [リンク] のバージョン [MetaTrader 5] エントリーポイントの計算ルール ポジションをオープンする エントリーポイントを計算するには、VR Cub ツールを最後の高値から最後の安値までストレッチする必要があります。
Was: $299  Now: $99   Supply Demand uses previous price action to identify potential imbalances between buyers and sellers. The key is to identify the better odds zones, not just the untouched ones. Blahtech Supply Demand indicator delivers functionality previously unavailable on any trading platform. This 4-in-1 indicator not only highlights the higher probability zones using a multi-criteria strength engine, but also combines it with multi-timeframe trend analysis, previously confirmed swings
This unique multi-currency strategy simultaneously determines the strength of trends and market entry points, visualizing this using histograms on the chart. The indicator is optimally adapted for trading on the timeframes М5, М15, М30, Н1. For the convenience of users, the indicator renders the entry point (in the form of an arrow), recommended take profit levels (TP1, TP2 with text labels) and the recommended Stop Loss level. The take profit levels (TP1, TP2) are automatically calculated for
The Th3Eng PipFinite indicator is based on a very excellent analysis of the right trend direction with perfect custom algorithms. It show the true direction and the best point to start trading. With StopLoss point and Three Take Profit points. Also it show the right pivot of the price and small points to order to replace the dynamic support and resistance channel, Which surrounds the price. And Finally it draws a very helpful Box on the left side on the chart includes (take profits and Stop loss
これは、価格ラベル付きのAdvanced ZigZagDynamic および/または ExtendedFractals インジケーターの極値に基づくサポートおよびレジスタンスレベルのMTFインジケーターです(無効にすることができます)。 MTFモードでは、より高いTFを選択できます。デフォルトでは、レベルはZigZagインジケータードットに基づいて生成されます。フラクタルインジケータードットは、ZigZagと一緒に、またはその代わりに使用することもできます。使用を簡素化し、CPU時間を節約するために、計算はバーの開口部ごとに1回実行されます。 パラメーター: ForcedTF-レベル計算のチャート時間枠(現在の時間枠と等しいか、それを超える場合があります) MinPipsLevelWidth-ポイント単位の最小レベル幅(非常にタイトなレベルに使用) Use ZigZag Extremums points -ZigZagピークを使用してサポート/抵抗レベルを計算することを有効/無効にします Fixed pips range -ジグザグインジケーターを計算するための最小値と最大値の間の距離
V2 of the Perfect structure. Whats new? 1. AI based approach for High accuracy by calculating maximum bars with rapid switch algorithm. 2. Dual timeframe. add indicators two times (select different timeframes in the setting  of  both indicators for higher and lower timeframe precision). 3. set which timeframe data you want to see. you can see 4h swings on any other timeframe (like 1h, 15m, 5m, ......). 4. you can hide labels, lines, convert arrows to dots for clear vision once you get settled wi
EZZ Elite Zig Zag is an indicator for the MetaTrader 4 terminal. This indicator traces the peak of the trend based on the market reversal, thus showing various opportunities in the financial market. EZZ Elite Zig Zag is a visual tool, intuitive, and easy to understand and use.  Test it Yourself by Downloading it for Free. Author Paulo Rocha all rights reserved
The RTrends indicator does two things: first, it automatically draws the layout of the price chart by plotting trend lines and, secondly, it produces bearish and bullish signals. The layout reflects the fractal nature of the market. Trends from different time horizons are applied simultaneously on the chart. Thus, from a single chart a trader can see trend lines of higher timeframes. The lines, depending on the horizon, differ in color and width: the older the horizon, the thicker the line is. T
We present you the indicator "Candle closing counter", which will become your indispensable assistant in the world of trading. That’s why knowing when the candle will close can help: If you like to trade using candle patterns, you will know when the candle will be closed. This indicator will allow you to check if a known pattern has formed and if there is a possibility of trading. The indicator will help you to prepare for market opening and market closure. You can set a timer to create a p
このプロダクトを購入した人は以下も購入しています
現在20%OFF! 初心者やエキスパートトレーダーのためのベストソリューション! このダッシュボードソフトウェアは、28の通貨ペアで動作しています。それは私達の主要な指標(高度な通貨の強さ28と高度な通貨インパルス)の2に基づいています。それは全体の外国為替市場の大きい概観を与えます。それは、すべての(9)時間枠で28の外国為替ペアのための高度な通貨の強さの値、通貨の動きの速度と信号を示しています。チャート上で1つのインディケータを使用して市場全体を観察し、トレンドやスキャルピングの機会をピンポイントで見つけることができたら、あなたのトレードがどのように改善されるか想像してみてください。 このインディケータには、強い通貨と弱い通貨の識別、潜在的な取引の識別と確認がより簡単になるような機能が搭載されています。このインディケータは、通貨の強さや弱さが増加しているか減少しているか、また、すべての時間枠でどのように機能しているかをグラフィカルに表示します。 新機能として、現在の市場環境の変化に適応するダイナミックなマーケットフィボナッチレベルが追加され、すでに当社のAdvan
Dynamic Forex28 Navigator - 次世代の Forex 取引ツール。 現在 49% オフ。 Dynamic Forex28 Navigator は、長年人気のインジケーターを進化させたもので、3 つの機能を 1 つにまとめています。 Advanced Currency Strength28 インジケーター (レビュー 695 件)  + Advanced Currency IMPULSE with ALERT (レビュー 520 件) + CS28 コンボ シグナル (ボーナス)。 インジケーターの詳細 https://www.mql5.com/en/blogs/post/758844 次世代の Strength インジケーターが提供するもの  オリジナルで気に入っていたすべての機能が、新機能と精度の向上によって強化されました。 主な機能: 独自の通貨強度計算式。 すべての時間枠でスムーズかつ正確な強度ライン。 トレンドの特定と正確なエントリーに最適です。 ダイナミックマーケットフィボナッチレベル (マーケットフィボナッチ)。 このインジケー
指示する     ロシア     -        utilizar con   el indicador の ESP 推奨事項 -   TPSpro トレンド プロフェッショナル版 -   MT5のバージョン 最も重要なことは、将来においても最も重要なことです。 機能のプリンシパル: ゾーンのほとんどは、ベンダーとコンプラドールによってアクティブ化されます。 状況を直感的に把握できるよう、初期の衝動を修正します。 LOGIC AI: MUESTRA zonas (círculos) parabuscar puntos de entrada cuando se activa una plantilla 視覚的に優れた視覚効果があり、最も重要な機能がすべて揃っていることに注意してください。 優れたニベレス/ゾーンの視覚化 (modo MTF) 世界で最も人気のある場所/ゾーンです。これを使用するのに最適な方法です (   TPSproTREND PRO   )。 アルゴリズム プロフェッショナル セパラド パソ ア パソ パラ オペラ それは、オペラハウスやコントラ・デ・エラの指導におい
FX Volume
Daniel Stein
4.58 (33)
FXのボリュームで真のエッジを得る:究極の出来高指標 FX Volumeは、インサイダーの視点から真の市場センチメントを明らかにする最初で唯一の出来高指標です。機関投資家やブローカーがどのようなポジションをとっているかについての独自の洞察を提供することで、FX Volumeは、通常大手にのみ許される先見の明をもって取引することを可能にします。COTレポートの遅れとはおさらばです。FX Volumeは、この重要な情報をチャート上で即座に提供し、より迅速でスマートな取引判断を可能にします。 FX Volumeがあなたの取引に不可欠な理由 FX Volumeを使用すると、独自の市場データに比類なくアクセスできるため、一般的な出来高指標では得られない洞察力を得ることができます。チャート上で直接追跡できる内容は以下の通りです: ポジション比率:市場センチメントを明確に把握するために、通貨間のロング・ショート比率をご覧ください。 比率の変化:選択した時間枠におけるロングポジションの変化率を表示します。 総取引量:通貨全体の総取引量(ロングとショート)をリアルタイムで追跡します。 詳細なロン
Enigmera
Ivan Stefanov
5 (3)
エニグメラ:市場の中核 https://www.enigmera.com はじめに このインディケータと取引システムは、金融市場に対する驚くべきアプローチです。ENIGMERAは、フラクタルサイクルを使用して、サポートとレジスタンスレベルを正確に計算します。本格的な蓄積局面を示し、方向性と目標を示します。 トレンド中でも調整中でも機能するシステムです。 どのように作動するのか? ENIGMERAは、支持線・抵抗線、目標線、乖離線の3つのラインで構成されています。このシステムは、過去のデータを現在と未来に外挿する典型的な市場指標とは異なり、現在の完全な画像を提供します。支持線上にある場合、それは本当の支持を意味し、抵抗線上にある場合、それは本当の抵抗を意味する。ある水準が破られた場合、それはトレンドの変化を意味する。再描画はしない。 市場は常に進化しているため、ENIGMERAはその評価ツールを適応させ、定期的に戦略を修正しています。  これにより、すべてのシナリオが徹底的に評価されることが保証されます。この市場指標の独自性は、その能力を見れば明らかです。  ENIGM
現在20%OFF! このダッシュボードは、複数のシンボルと最大9つのタイムフレームで動作するソフトウェアの非常に強力な部分です。 このソフトは、弊社のメインインジケーター(ベストレビュー:Advanced Supply Demand)をベースにしています。    Advanced Supply Demand ダッシュボードは、素晴らしい概要を提供します。それは示しています。  ゾーン強度評価を含むフィルタリングされた需給値。 ゾーン内/ゾーンへのPips距離。 ネストされたゾーンがハイライトされます。 選択されたシンボルの4種類のアラートを全ての(9)時間枠で提供します。 それはあなたの個人的なニーズに合わせて高度に設定可能です。 あなたの利益! すべてのトレーダーにとって最も重要な質問です。 市場に参入するのに最適なレベルはどこか? 成功のチャンスとリスク/リターンを得るために、強力な供給/需要ゾーン内またはその近くで取引を開始します。 損切りの最適な位置はどこですか? 最も安全なのは、強力な供給/需要ゾーンの下/上にストップを置くことで
製品を購入する前に、以下の情報をお読みください。 Apollo Pips PLUS SP はユニークな製品です。これは、私の新しい「アポロ ピップス」インジケーターと、私のすべての取引インジケーターにアクセスできる「スーパー パック」ボーナスを手に入れたい人のためのものです。 Apollo Pips PLUS SP 製品を購入すると、実際には私の Apollo Pips インジケーターのまったく新しいバージョンを購入することになります。このバージョンのインジケーターには改良されたアルゴリズムと使いやすいパラメーターがあり、あらゆる市場およびあらゆる取引スタイルでインジケーターを使用する機会が得られます。 この製品の購入者は、私のスーパーボーナスとして、他のすべてのインジケーターにも無料でアクセスできます!私のすべての取引ツールにアクセスしたい場合は、この製品が最適です!:) しかし、これがすべてではありません!:) この製品のすべての購入者は、私の新しいインジケーターを無料で入手する資格もあります!:)新しい取引インジケーターを利用できるようになりました。私の特権のある「スーパー パッ
This indicator is based on the mathematics of the great trader W.D. Ganna. With its help, you can easily find strong levels by analyzing swings to find the optimal entry point. The indicator works on all instruments and all timeframes. The indicator is fully manual and has control buttons. All you need to do is press the NEW button, a segment will appear, which you can place on any movement, swing or even 1 candle that you want to analyze. By placing the segment, press the OK button. A grid (th
KT Trend Trading Suite is a multi-featured indicator that incorporates a trend following strategy combined with multiple breakout points as the entry signals. Once a new trend is established, it provides several entry opportunities to ride the established trend successfully. A pullback threshold is used to avoid the less significant entry points. MT5 Version is available here  https://www.mql5.com/en/market/product/46270 Features It combines several market dynamics into a single equati
今、147ドル(いくつかの更新後に499ドルに増加します) - 無制限のアカウント(PCSまたはMac) RelicusRoad ユーザー マニュアル + トレーニング ビデオ + プライベート Discord グループへのアクセス + VIP ステータス 市場の新しい見方 RelicusRoad は、外国為替、先物、暗号通貨、株式、および指数の世界で最も強力な取引インジケーターであり、トレーダーに収益を維持するために必要なすべての情報とツールを提供します。初心者から上級者まで、すべてのトレーダーが成功するためのテクニカル分析と取引計画を提供します。これは、将来の市場を予測するのに十分な情報を提供する重要な取引指標です。意味をなさないチャート上のいくつかの異なる指標ではなく、完全な解決策を信じています.これは、信号、矢印 + 価格アクション情報を表示するオールインワンのインジケーターで、他に類を見ない非常に正確です。 強力な AI に基づいて、RelicusRoad は不足している情報とツールを提供して、あなたを教育し、トレーディングのプロ、成功したトレーダーにします。
Ultimate Sniper Dashboard
Hispraise Chinedum Abraham
4.82 (22)
299ドルで割引中! 今後値上げの可能性あり! 下の説明を読んでください! 究極のスナイパーダッシュボードのための最高のエントリーシステム。究極のダイナミックレベル。(私の製品をチェックしてください) 究極のスナイパーダッシュボードはMT4多通貨テスト制限のため、ライブマーケットでのみ作動します。 究極のスナイパーダッシュボードをご紹介します。HA-Sniper、MA-Sniper、その他多くの特別なモードが含まれる最高の製品です。究極のスナイパーダッシュボードは絶対的な獣です! 初心者やエキスパートトレーダーにとって最高のソリューションです。もう二度と動きを見逃さない! シンプルさとピップを愛するトレーダーのために、特別な製品をご用意しました。シンプルでありながら、ダッシュボードは複数のカスタムアルゴリズムに基づき28の通貨ペアを監視し、すべての作業を行います。たった一つのチャートで、プロのように市場を読み解くことができます。もし、為替ペアが動き出したときに、その方向性を正確に特定することができれば、あなたの取引はどれほど改善されることでしょう。   当社のシ
このインディケータは、当社の2つの製品 Advanced Currency IMPULSE with ALERT  +   Currency Strength Exotics . のスーパーコンビネーションです。 このインジケーターは全ての時間枠で作動し、8つの主要通貨と1つのシンボルの強弱のインパルスをグラフで表示します。 このインジケータは、金、エキゾチックペア、商品、インデックス、先物など、あらゆるシンボルの通貨強度の加速度を表示することに特化されています。金、銀、原油、DAX、US30、MXN、TRY、CNHなどの通貨強度の加速度(インパルスまたは速度)を表示するために、任意のシンボルを9行目に追加できる、この種の最初のものです。 新しいアルゴリズムに基づいて構築され、潜在的な取引の特定と確認がさらに容易になりました。これは、通貨の強さや弱さが加速しているかどうかをグラフィカルに表示し、その加速の速度を測定するためです。加速すると物事は明らかに速く進みますが、これはFX市場でも同じです。つまり、反対方向に加速している通貨をペアリングすれば、潜在的に利益を生む取
TrendMaestro
Stefano Frisetti
5 (3)
note: this indicator is for METATRADER4, if you want the version for METATRADER5 this is the link:  https://www.mql5.com/it/market/product/108106 TRENDMAESTRO ver 2.4 TRENDMAESTRO recognizes a new TREND in the bud, he never makes mistakes. The certainty of identifying a new TREND is priceless. DESCRIPTION TRENDMAESTRO identifies a new TREND in the bud, this indicator examines the volatility, volumes and momentum to identify the moment in which there is an explosion of one or more of these data a
Best Currency Strength Indicator
Tumelo Patrick Rakotsoane
4.58 (45)
Advanced Currency Strength Indicator The Advanced Divergence Currency Strength Indicator. Not only it breaks down all 28 forex currency pairs and calculates the strength of individual currencies across all timeframes , but, You'll be analyzing the WHOLE forex market in 1 window (In just 1 minute) . This indicator is very powerful because it reveals the true movements of the market.  It is highly recommended to  analyze charts knowing the performance of individual currencies or the countries ec
ご紹介     Quantum Breakout PRO は 、ブレイクアウト ゾーンの取引方法を変革する画期的な MQL5 インジケーターです。 13年以上の取引経験を持つ経験豊富なトレーダーのチームによって開発された Quantum Breakout PROは 、革新的でダイナミックなブレイクアウトゾーン戦略により、あなたの取引の旅を新たな高みに押し上げるように設計されています。 クォンタム ブレイクアウト インジケーターは、5 つの利益ターゲット ゾーンを備えたブレイクアウト ゾーン上のシグナル矢印と、ブレイクアウト ボックスに基づいたストップロスの提案を提供します。 初心者トレーダーにもプロのトレーダーにも適しています。 量子EAチャネル:       ここをクリック MT5バージョン:   ここをクリック 重要!購入後、インストールマニュアルを受け取るためにプライベートメッセージを送ってください。 推奨事項: 時間枠: M15 通貨ペア: GBPJPY、EURJPY、USDJPY、NZDUSD、XAUUSD アカウントの種類: ECN、Raw、また
ECM Elite Channel is a volatility-based indicator, developed with a specific time algorithm, which consists of finding possible corrections in the market. This indicator shows two outer lines, an inner line (retracement line) and an arrow sign, where the channel theory is to help identify overbought and oversold conditions in the market. The market price will generally fall between the boundaries of the channel. If prices touch or move outside the channel, it's a trading opportunity. The
【V1.00】MTF NRPA 5 RSI RTDがリリースされました! 非再描画矢印リアルタイム ダッシュボード。 さまざまな RSI インジケーターを使用するのにうんざりしていて、それらが不正確であると感じた場合は、このツールを試してください。 通常、時間枠内の OBOS レベルを決定するために RSI を 1 つだけインストールします。 悪いニュースは、さまざまな時間枠の OBOS レベルと傾向を一度に確認できないことです。 それが私がこの取引ツールを開発した理由です。 それは次のように説明されています。 この取引ツールでは、5 つの RSI を使用します。 はい、5つです! デフォルトでは、RSI 1 と RSI 2 を大きな時間枠、つまり M30 に設定します。 RSI 1 と RSI 2 の交差は、M30 タイムフレームでトレンドの変化があることを意味します。 次に、現在の(小さい)時間枠に RSI 3 と RSI 4 を設定します。たとえば、M5 でチャートを開いたとします。 RSI 3 と RSI 4 の交差点は、現在のタイムフレーム (M5) でトレ
EARLY REMINDER: The Starting price is 65 price will rise soon up to 365$ after first 10 copies of sales. Grab this offer now! Introduction Hello, traders! Welcome to the demonstration of the Forex Beast Indicator , a comprehensive tool designed to assist aspiring traders in navigating the complexities of the forex market. This indicator incorporates seven essential components to provide a well-rounded trading experience: Moving Averages Colored Zones Support and Resistance Levels (Previous Hig
The "Nostradamix" indicator is designed to analyze short-term market movements on lower timeframes (e.g., M1), while simultaneously considering trend direction on higher timeframes (e.g., M30). This tool identifies key trend reversal points, displays volatility levels, and generates buy/sell signals based on market dynamics. The indicator automatically plots: Current trend lines. Volatility bands to assess movement strength. Visual markers (arrows) for entry signals. Forecast Accuracy and Mathem
Odyssey is a global trend indicator. If you do not yet have your own trading strategy, you can use our ready-made trading strategy. This is a hybrid trend indicator, as it is based on the signals of several internal algorithms. The indicator also uses the oscillator algorithm in recalculations. The indicator also calculates the oversold and overbought levels of a trading instrument. Thus, having all the necessary information, the indicator generates signals when the trend changes. Despite the
ACB Breakout Arrows
KEENBASE SOFTWARE SOLUTIONS
4.15 (34)
The ACB Breakout Arrows indicator provides a crucial entry signal in the market by detecting a special breakout pattern. The indicator constantly scans the chart for a settling momentum in one direction and provide the accurate entry signal right before the major move.  Get multi-symbol and multi-timeframe scanner from here - Scanner for ACB Breakout Arrows MT4 Key features Stoploss and Take Profit levels are provided by the indicator. Comes with a MTF Scanner dashboard which tracks the brea
CMI - Profit from trending and ranging markets. The CMI indicator is a two-part system used to trigger both trend and counter-trend trades, that has been introduced by Daniel Fernandez in an article published in Currency Trading Magazine (August 2011 issue). It is a simple, yet effective indicator, which gauges whether the market has behaved in a choppy (non-directional) manner or trending (directional) manner. CMI calculates the difference between the most recent bar's close and the close n bar
You’ll love how you can receive alerts to your email and SMS when the candles turn green or red signifying the best buy and sell times in correlation to confirmed uptrends and downtrends. TO USE 1. Buy when green candles appear - this represents an uptrend. 2. Sell when red candles appear - this represents a downtrend. EXTRA FEATURE This indicator NEVER repaints so when a candle closes, that color is final. Also, the blue trend lines in the photos are not included, this is to demonstrate the pri
Circle Intelligent Trend Indicator は、正確性と効率性を求める MetaTrader 4 ユーザー向けに設計された最先端のツールです。このインジケーターは、シームレスな TradingView エクスペリエンスを MT4 に直接もたらすため、テンプレートが不要になり、取引設定が簡素化されます。 その際立った特徴は、マルチタイムフレーム分析に最適化されている高精度の Circle 買い/売りシグナルです。これにより、トレーダーは情報に基づいた自信を持って決定を下すことができます。スキャルピング、デイトレード、スイングトレードのいずれの場合でも、Circle Intelligent Trend Indicator は、取引パフォーマンスを向上させるための明確で実用的な洞察を提供します。 今すぐ Circle Intelligent Trend Indicator でスマートな取引のパワーを解き放ちましょう。デモ版をダウンロードするか、30 日間またはフルタイム版を購入してください。
Gold Channel is a volatility-based indicator, developed with a specific timing algorithm for the XAUUSD pair, which consists of finding possible corrections in the market. This indicator shows two outer lines, an inner line (retracement line) and an arrow sign, where the theory of the channel is to help identify overbought and oversold conditions in the market. The market price will generally fall between the boundaries of the channel. If prices touch or move outside the channel it is a tra
Algo Trading Indicaor  With this indicator , you’ll have zones and trends that hight probability the price will reverse from it. so will gives you all the help that you need  Why should you join us !?  1-This indicator is logical since it’s working in previous days movement , to predict the future movements. 2-Algo trading indicator will help you to draw trends which is special and are too strong than the basics trend , trends will change with the frame time that you work on . 3-We can
NAM Order Blocks
NAM TECH GROUP, CORP.
5 (1)
MT4マルチタイムフレームオーダーブロック検出インジケーター。 特徴 -チャートコントロールパネルで完全にカスタマイズ可能で、完全な相互作用を提供します。 -必要な場所でコントロールパネルを表示および非表示にします。 -複数の時間枠でOBを検出します。 -表示するOBの数量を選択します。 -さまざまなOBユーザーインターフェイス。 -OBのさまざまなフィルター。 -OB近接アラート。 -ADRの高線と低線。 -通知サービス(画面アラート|プッシュ通知)。 概要 注文ブロックは、金融機関や銀行からの注文収集を示す市場行動です。著名な金融機関と中央銀行が外国為替市場を牽引しています。したがって、トレーダーは市場で何をしているのかを知る必要があります。市場が注文ブロックを構築するとき、それは投資決定のほとんどが行われる範囲のように動きます。 注文の構築が完了すると、市場は上向きと下向きの両方に向かって急激に動きます。注文ブロック取引戦略の重要な用語は、機関投資家が行っていることを含むことです。それらは主要な価格ドライバーであるため、機関投
Insides
Ivan Simonika
5 (1)
Determining the market trend is an important task for traders. The Inside indicator implements an improved algorithm for visualizing the market trend. The main purpose of the indicator is to evaluate the market on small timeframes (i.e. M1, M5 and M15) for scalping. If you are a scalper looking for a reliable indicator to improve the quality of your trading, Inside is what you need. The indicator works in a separate window, showing red and green bars on the histogram. Two consecutive green (red
MQTVolume
Joaquin Gual Moreno
5 (1)
This indicator marks the long or short force of each candle. Green = long. Red = Short Parameters: The periods serve to make the indicator functions faster or slower. We recommend to run faster periods 4-10 or slower periods 12-26. PeriodFast : Numbers of Bars used for the calculations of fast period (Recommended value 4) PeriodSlow : Numbers of Bars used for the calculations of slow period (Recommended value 10)
Emergency trend technical indicator is used to analyze price movements in the Forex market. It is included in the so-called arrow indicators. And it is very practical in that it forms arrows in places where buy signals appear, or, conversely, sell signals. Naturally, do not forget that any indicator is just an assistant, not a magical tool, by the will of which you will become fabulously rich. Unfortunately, many novice traders forget about this, they see a potential grail in each indicator
作者のその他のプロダクト
The Volume by Price Indicator for MetaTrader 5 features Volume Profile and Market Profile TPO (Time Price Opportunity). Volume and TPO histogram bar and line charts. Volume Footprint charts. TPO letter and block marker collapsed and split structure charts. Static, dynamic and flexible range segmentation and compositing methods with relative and absolute visualizations. Session hours filtering and segment concatenation with Market Watch and custom user specifications. Graphical layering, positio
フィルタ:
annatrada
43
annatrada 2024.07.03 18:30 
 

ユーザーは評価に対して何もコメントを残しませんでした

Brian Collard
5467
開発者からの返信 Brian Collard 2024.12.18 09:17
For the correct locations please use the installer, or manually select the respective application type folders to which you copy via command 'Open Data Folder' in the File menu. Alternatively for templates, you can use 'Load Template' in the chart's context menu (right mouse click) to select the templates by absolute path to which you downloaded. If you're still having trouble, schedule a remote support session via support@volumebyprice.com. Thanks!
Hassan
482
Hassan 2024.04.04 18:47 
 

I asked the seller for a user manual and he told me there was none. When we zoom in on the images, the cursor redraws. This is my personal opinion. Maybe someone else will find it useful.

Sara Sabaghi
21915
Sara Sabaghi 2023.02.11 11:09 
 

Great job. you did it well. to support and respect for nice and inspiring tools in this market

Felmer Magbanua Blanca
292
Felmer Magbanua Blanca 2022.09.12 20:58 
 

Indeed Institutional trades

barko9
160
barko9 2022.04.11 13:14 
 

perfect indicator for day trading and scalping first i rented it i liked it and now i bought it thanks brian

GTR.fxSEAN
19
GTR.fxSEAN 2022.02.21 04:31 
 

This is the real deal! This is a beautiful tool with extensive customizability. Definitely worth more than it costs!

削除済み 2021.12.19 18:28 
 

ユーザーは評価に対して何もコメントを残しませんでした

YHW1022221880
170
YHW1022221880 2021.03.10 05:47 
 

great!!!!!!!! best in indicators!

Vidya-Trading
366
Vidya-Trading 2019.12.10 20:31 
 

Good price/value ratio, very useful once you are familiar with the numerous settings :-) really a very powerful and usefull tool! Nothing comparable on the market, at least not for this price...

James Wails
539
James Wails 2019.06.01 11:42 
 

Finally, this is how institutional investors have their software and gain their edge. I mainly trade cryptocurrencies Ethereum and Bitcoin, but also stocks and commodities. Volume by Price is a MUST HAVE if you want to see in advance where support and resistance areas are located.

Kingsley Aduaka
74
Kingsley Aduaka 2019.05.21 16:13 
 

ユーザーは評価に対して何もコメントを残しませんでした

Allan Rupert
134
Allan Rupert 2019.05.17 00:23 
 

ユーザーは評価に対して何もコメントを残しませんでした

Félix Schneider
393
Félix Schneider 2019.05.02 12:50 
 

ユーザーは評価に対して何もコメントを残しませんでした

Shafique Haryouli
99
Shafique Haryouli 2019.04.29 15:20 
 

Has all functions I need for Volume Price Analysis.

Ngoc Nguyen
534
Ngoc Nguyen 2019.04.14 04:35 
 

ユーザーは評価に対して何もコメントを残しませんでした

Taishiro Takahashi
382
Taishiro Takahashi 2019.03.26 06:12 
 

Good indicator. Worth the buy, very comprehensive work.

レビューに返信
バージョン 10.92 2024.12.16
• Improved graphics
バージョン 10.9 2024.12.13
• Improved graphics
バージョン 10.8 2024.12.05
• Stability and performance improvements
バージョン 10.7 2024.12.03
• Improved functions for 'Interface Data Environment'
バージョン 10.6 2024.12.03
• Accessibility improvements
バージョン 10.5 2024.12.02
• Improved graphics
バージョン 10.4 2024.11.29
• Improved functions for 'Interface Data Source'
バージョン 10.3 2024.11.21
• Support for new extensions and resources
バージョン 10.2 2024.11.21
• Accessibility improvements
バージョン 9.998 2024.11.20
• Improved graphics
バージョン 9.997 2024.11.18
• Improved functions for 'Interface Data Environment'
バージョン 9.996 2024.11.16
• Improved functions for 'Interface Data Source'
バージョン 9.995 2024.11.14
• Accessibility improvements
バージョン 9.994 2024.11.14
• Stability and performance improvements
バージョン 9.992 2024.10.19
• Improved functions for 'Interface Data Environment'
バージョン 9.988 2024.10.18
• Improved functions for 'Interface Data Environment'
バージョン 9.986 2024.10.13
• Stability and performance improvements
バージョン 9.984 2024.10.07
• Stability and performance improvements
バージョン 9.982 2024.10.05
• Stability and performance improvements
バージョン 9.954 2024.07.06
• Accessibility improvements
バージョン 9.952 2024.07.03
• Improved graphics
バージョン 9.950 2024.07.03
• Improved functions for 'Extension Volume by Time'
• Stability and performance improvements
バージョン 9.874 2024.06.28
• Support for new extensions and resources
バージョン 9.870 2024.06.28
• Improved functions for 'Interface Data Source'
バージョン 9.860 2024.06.23
• Improved functions for 'Interface Data Environment'
バージョン 9.850 2024.06.11
• Accessibility improvements
バージョン 9.840 2024.05.14
• Improved functions for 'Dataset Segment'
バージョン 9.824 2024.05.07
• Improved functions for 'Dataset Range'
バージョン 9.810 2024.05.06
• Support for new extensions and resources
バージョン 9.806 2024.05.06
• Stability and performance improvements
バージョン 9.802 2024.05.05
• Improved graphics
バージョン 9.762 2024.05.03
• Improved functions for 'Object Panel'
バージョン 9.756 2024.05.01
• Improved functions for 'Extension Volume by Time'
バージョン 9.752 2024.04.30
• Stability and performance improvements
バージョン 9.750 2024.04.30
• Improved functions for 'Interface Data Source'
バージョン 9.718 2024.04.29
• Support for new extensions and resources
バージョン 9.716 2024.04.29
• Accessibility improvements
バージョン 9.712 2024.04.29
• Improved graphics
バージョン 9.708 2024.04.28
• Improved functions for 'Dataset Segment'
バージョン 9.706 2024.04.28
• Improved functions for 'Object Position'
バージョン 9.702 2024.04.24
• Improved functions for 'Interface Data Source'
バージョン 9.698 2024.04.23
• Support for new extensions and resources
バージョン 9.612 2024.04.11
• Stability and performance improvements
バージョン 9.604 2024.04.09
• Improved functions for 'Dataset Segment Session'
バージョン 9.602 2024.04.08
• Improved graphics
バージョン 9.598 2024.04.06
• Stability and performance improvements
バージョン 9.540 2024.04.04
• Improved functions for 'Object Position'
バージョン 9.528 2024.04.01
• Improved functions for 'Dataset Segment'
バージョン 9.524 2024.03.29
• Accessibility improvements
バージョン 9.520 2024.03.29
• Improved graphics
バージョン 9.512 2024.03.27
• Improved graphics
バージョン 9.502 2024.03.27
• Improved functions for 'Dataset Segment'
バージョン 9.452 2024.03.25
• Improved functions for 'Object Position'
バージョン 9.450 2024.03.25
• Improved functions for 'Column'
バージョン 9.424 2024.03.21
• Performance improvements
バージョン 9.422 2024.03.20
• Support for new extensions and resources
バージョン 9.420 2024.03.20
• Accessibility improvements
バージョン 9.410 2024.03.20
• Improved functions for 'Extension Volume by Time'
バージョン 9.402 2024.03.20
• Stability and performance improvements
バージョン 9.398 2024.03.18
• Accessibility improvements
バージョン 9.396 2024.03.18
• Improved functions for 'Object Position'
バージョン 9.354 2024.03.05
• Improved graphics
バージョン 9.350 2024.02.14
• Improved functions for 'Interface Data Source'
バージョン 9.318 2024.02.13
• Support for new extensions and resources
バージョン 9.316 2024.02.13
• Improved functions for 'Dataset Segment Session'
バージョン 9.314 2024.02.11
• Improved graphics
バージョン 9.312 2024.02.06
• Performance improvements
バージョン 9.308 2024.02.06
• Accessibility improvements
バージョン 9.306 2024.02.06
• Improved graphics
バージョン 9.302 2024.01.31
• Stability and performance improvements
バージョン 9.298 2024.01.22
• Stability and performance improvements
バージョン 9.244 2024.01.16
• Improved graphics
バージョン 9.242 2024.01.15
• Improved defaults for 'Dataset Segment'
バージョン 9.240 2024.01.15
• Improved functions for 'Dataset Segment'
バージョン 9.230 2024.01.12
• Accessibility improvements
バージョン 9.220 2024.01.11
• Support for new extensions and resources
バージョン 9.218 2024.01.11
• Improved functions for 'Interface Data Source'
バージョン 9.216 2024.01.10
• Improved functions for 'Interface Data Environment'
バージョン 9.214 2024.01.08
• Stability and performance improvements
バージョン 9.212 2024.01.08
• Stability and performance improvements
バージョン 9.210 2024.01.07
• Stability and performance improvements
バージョン 9.208 2024.01.07
• Accessibility improvements
バージョン 9.206 2024.01.06
• Improved graphics
バージョン 9.205 2024.01.06
• Improved functions for 'Dataset Segment'
バージョン 9.134 2023.12.31
• Improved functions for 'Column'
バージョン 9.132 2023.12.30
• Improved graphics
バージョン 9.126 2023.12.29
• Support for new resources
バージョン 9.124 2023.12.29
• Improved graphics
バージョン 9.122 2023.12.28
• Accessibility improvements
バージョン 9.120 2023.12.28
• Accessibility improvements
バージョン 9.118 2023.12.27
• Accessibility improvements
バージョン 9.116 2023.12.27
• Improved functions for 'Interface Data Environment'
バージョン 9.114 2023.12.26
• Stability and performance improvements
バージョン 9.112 2023.12.25
• Stability and performance improvements
バージョン 9.108 2023.12.25
• Improved presets for 'Panel'
バージョン 9.106 2023.12.24
• Improved functions for 'Interface Data Source'
バージョン 9.104 2023.12.23
• Support for new extensions and resources
バージョン 9.102 2023.12.23
• Improved functions for 'Main'
• Improved functions for 'Column'
• Stability and performance improvements
バージョン 8.906 2023.12.19
• Improved functions for 'Object Position'
バージョン 8.904 2023.12.18
• Improved functions for 'Dataset Segment'
バージョン 8.902 2023.12.17
• Improved functions for 'Dataset'
• Stability and performance improvements
バージョン 8.710 2023.12.12
• Support for new extensions
バージョン 8.704 2023.12.12
• Improved presets for 'Panel'
• Improved functions for 'Interface Data Environment'
バージョン 8.702 2023.12.10
• Stability and performance improvements
バージョン 8.692 2023.11.30
• Improved functions for 'Main'
バージョン 8.614 2023.11.27
• Improved graphics
バージョン 8.610 2023.11.25
• Accessibility improvements
バージョン 8.608 2023.11.25
• Accessibility improvements
バージョン 8.604 2023.11.24
• Stability and performance improvements
バージョン 8.602 2023.11.24
• Improved functions for 'Style Column'
バージョン 8.598 2023.11.23
• Accessibility improvements
• Improved functions for 'Object Position'
バージョン 8.542 2023.11.20
• Accessibility improvements
バージョン 8.524 2023.11.10
• Accessibility improvements
バージョン 8.520 2023.11.09
• Support for new extensions and resources
• Improved functions for 'Panel'
バージョン 8.518 2023.11.08
• Stability and performance improvements
バージョン 8.516 2023.11.08
• Improved graphics
• Improved functions for 'Style Column'
• Improved functions for 'Interface Data Environment'
バージョン 8.502 2023.06.15
• Improved functions for 'Style Main Line'
バージョン 8.498 2023.06.13
• Improved functions for 'Style Panel'
バージョン 8.496 2023.06.12
• Improved functions for 'Style Main Line'
バージョン 8.316 2023.06.08
• Improved graphics
バージョン 8.314 2023.06.05
• Stability and performance improvements
バージョン 8.312 2023.06.01
• Accessibility improvements
バージョン 8.310 2023.06.01
• Performance improvements
バージョン 8.204 2023.05.24
• Improved functions for 'Object Position'
• Improved functions for 'Dataset Segment'
バージョン 8.198 2023.05.22
• Improved graphics
バージョン 8.102 2023.05.01
• Improved functions for 'Interface Data Environment'
バージョン 8.0 2023.05.01
• Improved defaults
バージョン 7.998 2023.05.01
• Improved graphics
バージョン 7.996 2023.05.01
• Accessibility improvements
バージョン 7.994 2023.04.28
• Accessibility improvements
バージョン 7.993 2023.04.28
• Support for new extensions and resources
• Accessibility improvements
バージョン 7.991 2023.04.04
• Improved graphics
バージョン 7.987 2023.04.01
• Improved graphics
バージョン 7.985 2023.03.29
• Improved graphics
バージョン 7.975 2023.03.27
• Stability and performance improvements
バージョン 7.973 2022.11.15
• Support for new extensions
バージョン 7.972 2022.11.15
• Accessibility improvements
バージョン 7.970 2022.11.13
• Stability and performance improvements
バージョン 7.968 2022.11.11
• Stability and performance improvements
バージョン 7.962 2022.11.07
• Stability and performance improvements
バージョン 7.946 2022.11.03
• Stability and performance improvements
バージョン 7.942 2022.10.28
• Improved presets for 'Panel'
バージョン 7.941 2022.10.28
• Support for new resources
バージョン 7.940 2022.10.28
• Improved functions for 'Interface Data Source'
バージョン 7.931 2022.10.26
• Support for new extensions
バージョン 7.927 2022.10.25
• Accessibility improvements
バージョン 7.926 2022.10.25
• Improved resources
バージョン 7.924 2022.10.24
• Stability and performance improvements
バージョン 7.920 2022.10.21
• Stability and performance improvements
バージョン 7.918 2022.10.19
• Improved functions for 'Interface Data Source'
バージョン 7.914 2022.10.17
• Improved functions for 'Style Main Histogram'
バージョン 7.912 2022.10.17
• Support for new resources
バージョン 7.910 2022.10.17
• Improved functions for 'Style Column'
バージョン 7.902 2022.10.17
• Improved functions for 'Object Position'
バージョン 7.896 2022.10.10
• Support for new extensions
バージョン 7.895 2022.10.10
• Stability and performance improvements
バージョン 7.893 2022.10.06
• Improved resources
バージョン 7.892 2022.10.06
• Improved graphics
バージョン 7.891 2022.10.02
• Support for new resources
バージョン 7.890 2022.10.02
• Improved functions for 'Dataset Segment'
• Improved functions for 'Interface On-Chart Controls'
バージョン 7.850 2022.09.26
• Improved functions for 'Dataset'
バージョン 7.810 2022.09.24
• Stability and performance improvements
バージョン 7.808 2022.09.23
• Improved resources
バージョン 7.807 2022.09.22
• Improved graphics
バージョン 7.805 2022.09.20
• Performance improvements
バージョン 7.802 2022.09.15
• Support for new extensions
バージョン 7.799 2022.09.13
• Support for new resources
バージョン 7.798 2022.09.12
• Improved functions for 'Dataset'
バージョン 7.795 2022.09.10
• Improved functions for 'Interface Data Source'
バージョン 7.793 2022.09.04
• Improved functions for 'Interface Data Environment'
バージョン 7.792 2022.09.04
• Improved graphics
バージョン 7.791 2022.09.04
• Support for new resources
バージョン 7.790 2022.09.03
• Stability and performance improvements
バージョン 7.786 2022.08.29
• Improved resources
バージョン 7.785 2022.08.29
• Accessibility improvements
バージョン 7.765 2022.08.10
• Improved functions for 'Dataset'
バージョン 7.764 2022.08.10
• Improved functions for 'Interface Data Environment'
バージョン 7.762 2022.08.08
• Support for new resources
バージョン 7.761 2022.08.07
• Improved graphics
バージョン 7.760 2022.08.07
• Support for new resources
バージョン 7.759 2022.08.07
• Stability and performance improvements
バージョン 7.756 2022.08.05
• Stability and performance improvements
バージョン 7.754 2022.07.31
• Accessibility improvements
バージョン 7.752 2022.07.29
• Improved presets for 'Column'
バージョン 7.750 2022.07.27
• Improved functions for 'Dataset'
バージョン 7.740 2022.07.25
• Stability and performance improvements
バージョン 7.739 2022.07.24
• Improved functions for 'Interface Data Environment'
• Improved presets for 'Panel'
バージョン 7.712 2022.07.11
• Support for new resources
バージョン 7.711 2022.07.10
• Performance improvements
バージョン 7.709 2022.07.06
• Improved functions for 'Dataset'
バージョン 7.654 2022.06.28
• Improved functions for 'Panel'
バージョン 7.653 2022.06.27
• Stability and performance improvements
バージョン 7.652 2022.06.27
• Stability and performance improvements
バージョン 7.651 2022.06.27
• Support for new resources
バージョン 7.650 2022.06.26
• Improved functions for 'Dataset Segment'
バージョン 7.601 2022.06.20
• Improved graphics
バージョン 7.600 2022.06.20
• Accessibility improvements
バージョン 7.590 2022.06.15
• Performance improvements
バージョン 7.560 2022.05.23
• Accessibility improvements
バージョン 7.550 2022.05.23
• Accessibility improvements
バージョン 7.540 2022.05.15
• Accessibility improvements
バージョン 7.530 2022.05.14
• Accessibility improvements
バージョン 7.520 2022.04.18
• New 'TPO' parameter for 'Evaluation Column'
• Improved functions for 'Interface Data Environment'
バージョン 7.509 2022.04.06
• Accessibility improvements
バージョン 7.508 2022.04.04
• Support for new resources
バージョン 7.507 2022.04.03
• Accessibility improvements
バージョン 7.506 2022.03.08
• Accessibility improvements
バージョン 7.504 2022.03.04
• Improved functions for 'Style Indication'
バージョン 7.502 2022.03.03
• Performance improvements
バージョン 7.501 2022.03.03
• Stability and performance improvements
バージョン 7.499 2022.03.02
• Improved functions for 'Text'
バージョン 7.498 2022.03.02
• New 'Size' parameters for 'Style Main' and 'Style Column'
バージョン 7.495 2022.03.01
• Improved presets for 'Column'
バージョン 7.490 2022.02.27
• New 'Volume' and 'Price Level' parameters for 'Evaluation'
• Improved functions for 'Style Main'
• Improved presets for 'Dataset'
バージョン 7.410 2022.02.25
• Improved functions for 'Style Column'
• Fix for multi timeframe data load issue on platform restart
バージョン 7.405 2022.02.22
• New 'Actual Price Level' preset for 'Panel'
バージョン 7.400 2022.02.22
• New 'Price Level Grid' parameter for 'Dataset'
バージョン 7.370 2022.01.06
• Support for new resources
• Improved graphics
バージョン 7.360 2021.12.11
• New 'Area' option for 'Indication Column'
• New 'Volume' parameter for 'Evaluation Column'
バージョン 7.350 2021.12.09
• Support for new resources
• Improved 'Market Profile (TPO) - Histogram' option for 'Main'
バージョン 7.340 2021.12.06
• New 'History' parameter for 'Dataset'
• New 'Padding' parameter for 'Style Column'
• Accessibility improvements
バージョン 7.310 2021.12.02
• Support for new resources
• Improved functions for 'Main'
バージョン 7.300 2021.11.30
• New 'Direction' parameter for 'Main'
• New 'Market Profile (TPO) - Histogram' option for 'Main'
• New 'Ray' and 'Color' parameters for 'Style Highlight Line' and 'Style Highlight Background Fill'
• New 'Line' options for 'Highlight Main'
• New 'Label' parameters for 'Style Highlight Line'
• Fix for templates issue
• New 'Anchor' parameter options for 'Panel'
• Improved defaults for 'Evaluation HVN/LVN'
バージョン 7.190 2021.11.24
• Stability and performance improvements
バージョン 7.103 2021.11.22
• Accessibility improvements
バージョン 7.0 2021.11.19
several improvements
バージョン 6.191 2021.07.06
fixed issue string value parameter (input as file)
バージョン 6.190 2021.07.05
feature update (data environment)
several improvements
reset parameter default values
バージョン 6.112 2021.06.27
several improvements
presets update
バージョン 6.110 2021.06.25
several improvements
バージョン 6.109 2021.06.24
several improvements
バージョン 6.108 2021.06.23
several improvements
バージョン 6.107 2021.06.21
several improvements
バージョン 6.105 2021.06.20
several improvements
バージョン 6.101 2021.06.17
several improvements
バージョン 6.1 2021.06.15
several improvements
バージョン 6.0 2021.06.12
feature upgrades
reorder parameters
バージョン 5.912 2021.03.12
extended drawing functions
performance improvements
バージョン 5.910 2021.03.08
extended data functions (time range method)
バージョン 5.909 2021.03.07
several improvements
extended data functions (market profile)
バージョン 5.900 2021.03.04
several improvements
extended data functions (price zone labels)
バージョン 5.897 2021.03.02
several improvements
extended data functions (volume time statistics)
improvements strategy tester / free demo
reset parameter default values
バージョン 5.895 2021.03.01
several improvements
presets update (example setting files)
バージョン 5.893 2021.03.01
extended data functions (time range method)
extended drawing functions (market profile - block marker)
reorder parameters
バージョン 5.845 2021.02.27
several improvements
user manual update
バージョン 5.843 2021.02.27
extended drawing functions (highlight option)
バージョン 5.842 2021.02.27
performance improvements
presets update (example setting files)
reset parameter default values
バージョン 5.839 2021.02.26
several improvements
バージョン 5.838 2021.02.26
extended data functions (session filter)
バージョン 5.833 2021.02.25
several improvements
extended drawing functions (update rates)
バージョン 5.830 2021.02.24
feature upgrade
extended data functions (volume time statistics - segment)
バージョン 5.821 2021.02.23
fixed issue drawing function (vp scale by chart)
バージョン 5.820 2021.02.23
extended drawing functions
improvements strategy tester / free demo
バージョン 5.810 2021.02.22
extended data functions (time statistics option)
バージョン 5.809 2021.02.22
several improvements
presets update (example setting files)
バージョン 5.807 2021.02.21
reset parameter default values
performance improvements
バージョン 5.806 2021.02.21
several improvements
バージョン 5.802 2021.02.19
several improvements
バージョン 5.800 2021.02.18
extended drawing functions
bug fixes and performance improvements
presets update (chart color schemes)
reset parameter default values
バージョン 5.652 2021.02.17
several improvements
バージョン 5.641 2021.02.14
extended data functions (market profile - dynamic)
presets update (built-in)
user manual update
バージョン 5.631 2021.02.12
several improvements
presets update (example setting files)
バージョン 5.622 2021.02.10
several improvements
バージョン 5.621 2021.02.10
several improvements
extended data functions (volume time statistics - segment)
バージョン 5.617 2021.02.08
several improvements
バージョン 5.614 2021.02.08
several improvements
presets update (setting files)
バージョン 5.611 2021.02.08
extended data functions (time range option)
バージョン 5.606 2021.02.06
several improvements
バージョン 5.604 2021.02.04
reset parameter default values
バージョン 5.603 2021.02.04
performance improvements
バージョン 5.601 2021.02.03
extended drawing functions (vwap)
バージョン 5.598 2021.02.03
several improvements
reset parameter default values
バージョン 5.596 2021.02.03
several improvements
バージョン 5.593 2021.02.01
several improvements
バージョン 5.590 2021.02.01
extended drawing functions (volume time statistics - mtf)
presets update (setting files)
バージョン 5.521 2021.01.28
performance improvements
バージョン 5.517 2021.01.28
several improvements
extended data functions (range bar)
バージョン 5.514 2021.01.28
several improvements
バージョン 5.510 2021.01.28
extended data functions (volume time statistics - mtf)
extended drawing functions (market profile)
バージョン 5.490 2021.01.27
extended data functions (market profile)
extended drawing functions (volume time statistics)
バージョン 5.460 2021.01.26
several improvements
バージョン 5.452 2021.01.25
several improvements
extended data functions (time range option)
バージョン 5.450 2021.01.25
performance improvements
extended data functions
バージョン 5.218 2021.01.24
several improvements
extended data functions (update rates)
user manual update
バージョン 5.208 2021.01.23
reset parameter default values
user manual update
presets update (setting files)
バージョン 5.207 2021.01.22
several improvements
presets update (setting files)
バージョン 5.206 2021.01.22
presets update (setting files)
バージョン 5.205 2021.01.22
reset parameter default values
extended drawing functions (line highlights)
バージョン 5.204 2021.01.21
extended drawing functions (mp marker block)
バージョン 5.203 2021.01.18
extended data functions (market profile - dynamic)
バージョン 5.202 2021.01.18
extended data functions (time range option)
バージョン 5.201 2021.01.17
presets update (built-in)
improvements strategy tester / free demo
バージョン 5.199 2021.01.16
user manual update
バージョン 5.198 2021.01.16
improvements strategy tester / free demo
バージョン 5.197 2021.01.16
several improvements
extended data functions (market profile)
バージョン 5.195 2021.01.15
several improvements
extended data functions (session filter)
バージョン 5.193 2021.01.13
several improvements
resources update
バージョン 5.192 2021.01.10
user manual update
presets update (setting files)
バージョン 5.191 2021.01.09
several improvements
user manual update
バージョン 5.190 2021.01.08
several improvements
reset parameter default values
presets update (setting files)
バージョン 5.163 2020.07.08
several improvements
reset parameter default values
バージョン 5.162 2020.07.07
several improvements
バージョン 5.161 2020.05.04
extended data functions
performance improvements
バージョン 5.159 2020.05.03
feature update
performance improvements
バージョン 5.152 2020.05.01
several improvements
バージョン 5.150 2020.05.01
feature upgrade
extended data functions (highlight method)
presets update (setting files)
バージョン 5.140 2020.04.30
feature update
バージョン 5.137 2020.04.29
extended data functions (time range segmentation method)
バージョン 5.135 2020.04.28
extended data functions (time range update rate)
performance improvements
バージョン 5.134 2020.04.27
performance improvements
バージョン 5.133 2020.04.27
several improvements
バージョン 5.132 2020.04.21
several improvements
バージョン 5.131 2020.04.20
several improvements
バージョン 5.130 2020.04.20
extended drawing functions (mp marker block size scale non-uniform)
reset parameter default values
presets update (setting files)
バージョン 5.120 2020.04.18
feature upgrade
extended data functions (time range segmentation method)
reset parameter default values
presets update (setting files)
バージョン 5.118 2020.04.14
extended data functions (time range segmentation method)
presets update (setting files)
バージョン 5.116 2020.04.13
several improvements
presets update (setting files)
バージョン 5.115 2020.04.13
extended data functions (time range option)
バージョン 5.113 2020.04.10
extended data functions (time range options and update rate)
reset parameter default values
presets update (setting files)
バージョン 5.112 2020.04.04
presets update
バージョン 5.110 2020.04.03
extended drawing functions
reset parameter default values
バージョン 5.109 2020.04.02
feature update
reset parameter default values
presets update (setting files)
バージョン 5.108 2020.03.31
performance improvements
reset parameter default values
バージョン 5.107 2020.03.30
feature update
バージョン 5.106 2020.03.29
extended data functions
バージョン 5.105 2020.03.27
presets update
chart script update
バージョン 5.104 2020.03.27
several improvements
バージョン 5.103 2020.03.25
feature upgrade
reset parameter default values
presets update
バージョン 5.99 2020.03.16
several improvements
バージョン 5.98 2020.03.15
extended data functions
extended drawing functions
バージョン 5.97 2020.03.14
presets update (built-in)
バージョン 5.96 2020.03.13
several improvements
バージョン 5.95 2020.03.12
several improvements
バージョン 5.94 2020.02.17
several improvements
バージョン 5.93 2020.02.10
extended data functions
performance improvements
バージョン 5.91 2020.02.09
extended data functions
バージョン 5.90 2020.02.09
several improvements
reset parameter default values
presets update
バージョン 5.89 2020.02.08
several improvements
バージョン 5.88 2020.02.05
performance improvements
バージョン 5.87 2020.02.05
presets update (built-in)
バージョン 5.86 2020.02.05
several improvements
バージョン 5.85 2020.02.05
several improvements
reset parameter default values
presets update
バージョン 5.84 2020.02.04
several improvements
バージョン 5.83 2020.02.04
extended data functions
バージョン 5.82 2020.02.04
several improvements
バージョン 5.81 2020.02.03
feature update
extended data functions
バージョン 5.78 2020.02.01
feature update
extended data functions
extended drawing functions
reset parameter default values
presets update
バージョン 5.76 2020.01.31
several improvements
reset parameter default values
バージョン 5.75 2020.01.30
reset parameter default values
バージョン 5.74 2020.01.30
feature updates
extended data functions
extended drawing functions
reset parameter default values
presets update
バージョン 5.65 2020.01.22
feature upgrade
extended drawing functions
presets update
バージョン 5.62 2020.01.21
performance improvements
presets update
バージョン 5.61 2020.01.21
performance improvements
presets update
バージョン 5.60 2020.01.21
feature updates
extended drawing functions
reset parameter default values
presets update
バージョン 5.57 2020.01.19
several improvements
バージョン 5.56 2020.01.19
feature update
extended drawing functions
バージョン 5.54 2020.01.19
performance improvements
バージョン 5.53 2020.01.18
feature upgrade
バージョン 5.52 2020.01.18
performance improvements
バージョン 5.49 2020.01.17
several improvements
バージョン 5.48 2020.01.17
feature updates
extended drawing functions
extended data functions
performance improvements
reset parameter default values
バージョン 5.45 2020.01.16
performance improvements
バージョン 5.40 2020.01.15
feature update
extended drawing functions
reset parameter default values
presets update
バージョン 5.38 2020.01.14
feature update
extended data functions
reset parameter default values
バージョン 5.37 2020.01.13
performance improvements
バージョン 5.36 2020.01.13
feature update
バージョン 5.35 2020.01.12
several improvements
reset parameter default values
バージョン 5.34 2020.01.11
several improvements
バージョン 5.33 2020.01.10
feature upgrade
extended data functions
extended drawing functions
reset parameter default values
presets update
バージョン 5.27 2020.01.08
feature upgrade
extended data functions
extended drawing functions
reset parameter default values
presets update
バージョン 5.24 2020.01.06
feature upgrade
extended data functions
extended drawing functions
reset parameter default values
presets update
バージョン 5.22 2020.01.05
performance improvements
バージョン 5.21 2020.01.04
feature upgrade
extended drawing functions
バージョン 5.20 2020.01.04
several improvements
バージョン 5.19 2020.01.03
several improvements
reset parameter default values
presets update
バージョン 5.18 2020.01.02
several improvements
バージョン 5.17 2020.01.02
reset parameter default values
バージョン 5.16 2020.01.02
feature upgrade
extended data functions
extended drawing functions
バージョン 5.15 2019.12.30
feature upgrade
バージョン 5.14 2019.12.28
performance improvements
バージョン 5.13 2019.12.27
several improvements
バージョン 5.12 2019.12.27
feature updates
extended data functions
several improvements
reset parameter default values
バージョン 5.10 2019.12.24
explicitly set encoding for string conversion operations
バージョン 5.8 2019.12.24
feature update
reset parameter default values
バージョン 5.7 2019.12.22
feature upgrade
parameters update
バージョン 5.6 2019.12.21
feature upgrade
several improvements
reset parameter default values
presets update
バージョン 5.5 2019.12.20
extended drawing functions
reset parameter default values
バージョン 5.4 2019.12.20
extended drawing functions
バージョン 5.3 2019.08.01
feature update
extended data functions
バージョン 5.1 2019.07.20
feature update
バージョン 5.0 2019.07.19
final checks
バージョン 4.102 2019.07.11
feature update
バージョン 4.101 2019.07.09
feature update
バージョン 4.99 2019.07.08
several improvements
バージョン 4.98 2019.07.07
feature upgrade
various feature updates
extended drawing and data functions
reset parameter default values
バージョン 4.96 2019.06.20
several improvements
バージョン 4.95 2019.06.20
several improvements
バージョン 4.93 2019.06.14
feature update
バージョン 4.92 2019.06.14
several improvements
バージョン 4.90 2019.06.13
reset parameter default values
バージョン 4.89 2019.06.13
feature upgrades
バージョン 4.78 2019.06.09
various feature updates
reset parameter default values
バージョン 4.74 2019.06.07
extended drawing functions
バージョン 4.71 2019.06.06
extended drawing functions
performance improvements
バージョン 4.70 2019.06.05
feature update
バージョン 4.69 2019.06.05
several improvements
バージョン 4.67 2019.06.04
performance improvements
バージョン 4.66 2019.06.04
feature update
several improvements
バージョン 4.63 2019.06.02
several improvements
バージョン 4.62 2019.06.02
extended drawing functions
バージョン 4.61 2019.06.02
extended drawing functions
performance improvements
バージョン 4.58 2019.05.31
several improvements
reset parameter default values
バージョン 4.57 2019.05.31
feature upgrade
extended drawing functions
バージョン 4.45 2019.05.30
feature update
several improvements
バージョン 4.41 2019.05.27
various feature updates and upgrades
extended drawing and data functions
performance improvements
reset parameter default values
バージョン 4.1 2019.05.22
extended data functions
バージョン 4.0 2019.05.21
various feature updates
extended drawing functions
reset parameter default values
バージョン 3.106 2019.05.21
several improvements
バージョン 3.105 2019.05.20
several improvements
バージョン 3.104 2019.05.19
feature upgrade
various feature updates
reset parameter default values
バージョン 3.98 2019.05.17
feature upgrade
バージョン 3.97 2019.05.16
several improvements
updated various parameter defaults
バージョン 3.96 2019.05.16
performance improvements
extended drawing functions
バージョン 3.95 2019.05.15
feature upgrade
バージョン 3.93 2019.05.15
various feature updates
reset parameter default values
バージョン 3.91 2019.05.14
several improvements
バージョン 3.89 2019.05.13
various feature updates
reset parameter default values
バージョン 3.87 2019.05.13
updated various parameter defaults
バージョン 3.86 2019.05.13
feature upgrade
various feature updates
reset parameter default values
バージョン 3.61 2019.05.10
several improvements
バージョン 3.59 2019.05.06
various feature updates
reset parameter default values
バージョン 3.57 2019.05.02
several improvements
バージョン 3.56 2019.04.29
various feature updates
バージョン 3.54 2019.04.29
several improvements
バージョン 3.53 2019.04.29
feature upgrade
バージョン 3.51 2019.04.26
feature upgrade
バージョン 3.48 2019.04.26
various feature updates
バージョン 3.44 2019.04.24
performance improvements
バージョン 3.43 2019.04.24
several improvements
reset parameter default values
バージョン 3.42 2019.04.23
feature upgrade
バージョン 3.36 2019.04.21
feature upgrade
バージョン 3.33 2019.04.20
performance improvements
バージョン 3.32 2019.04.20
several improvements
reset parameter default values
バージョン 3.31 2019.04.20
feature upgrade
バージョン 3.29 2019.04.19
feature upgrade
バージョン 3.28 2019.04.18
various feature updates
バージョン 3.27 2019.04.17
extended drawing functions
バージョン 3.26 2019.04.17
performance improvements
バージョン 3.25 2019.04.16
performance improvements
バージョン 3.24 2019.04.16
several improvements
バージョン 3.23 2019.04.16
various feature updates
バージョン 3.22 2019.04.15
performance improvements
バージョン 3.21 2019.04.15
feature upgrade
バージョン 3.17 2019.04.14
several improvements
バージョン 3.16 2019.04.14
various feature updates
reset parameter default values
バージョン 3.15 2019.04.13
several improvements
バージョン 3.13 2019.04.13
performance improvements
バージョン 3.11 2019.04.12
feature upgrade
various feature updates
バージョン 3.7 2019.04.10
several improvements
バージョン 3.5 2019.04.08
various feature upgrades
バージョン 3.1 2019.04.05
changed various parameter defaults
バージョン 3.0 2019.04.05
various feature upgrades
performance improvements
バージョン 2.49 2019.04.04
various feature updates
バージョン 2.44 2019.04.03
feature upgrade
バージョン 2.41 2019.04.03
feature upgrade
バージョン 2.39 2019.04.01
feature upgrade
バージョン 2.37 2019.04.01
several improvements
バージョン 2.36 2019.04.01
various feature updates
バージョン 2.34 2019.03.30
several improvements
バージョン 2.33 2019.03.29
various feature updates
バージョン 2.32 2019.03.28
several improvements
バージョン 2.31 2019.03.26
feature upgrade
バージョン 2.30 2019.03.26
several improvements
バージョン 2.26 2019.03.22
various feature upgrades
バージョン 2.24 2019.03.20
extended data functions
バージョン 2.22 2019.03.20
extended drawing functions
バージョン 2.21 2019.03.19
performance improvements
バージョン 2.20 2019.03.19
various feature upgrades
バージョン 2.18 2019.03.18
changed parameter 'Buffer Limit' default to max
バージョン 2.17 2019.03.18
several improvements
バージョン 2.16 2019.03.18
several improvements
バージョン 2.15 2019.03.18
various feature upgrades
バージョン 2.2 2019.02.26
extended drawing functions
バージョン 2.1 2019.02.24
added input parameter "Draw Height Subtract"
added input parameter "Draw Anchor, Time"
バージョン 2.0 2019.02.22
performance improvements
extended drawing functions
バージョン 1.9 2019.02.22
performance improvements
extended drawing functions
added input parameter "Border Merge"
バージョン 1.8 2019.02.21
fixed incorrect link properties
バージョン 1.7 2019.02.20
added new feature "Snap Time"
バージョン 1.5 2019.02.18
improvements strategy tester
various feature updates
バージョン 1.3 2019.02.15
stability and performance improvements
fixed issue strategy tester
バージョン 1.2 2019.02.12
updated description and link properties
バージョン 1.1 2019.02.11
stability and performance improvements
fixed issue initial drawing