• 概要
  • レビュー
  • コメント

Dream Wall Street

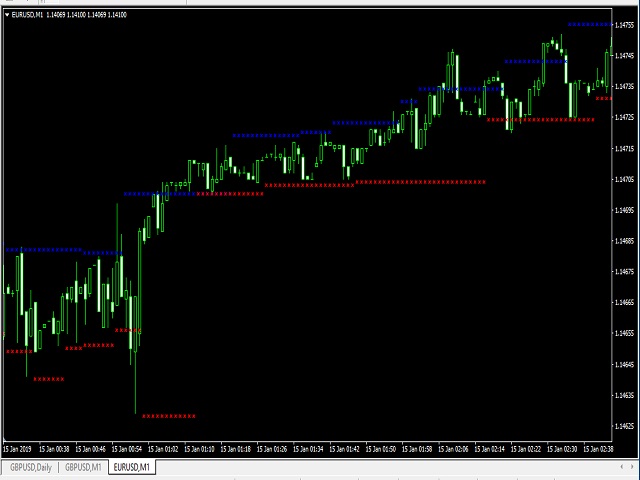
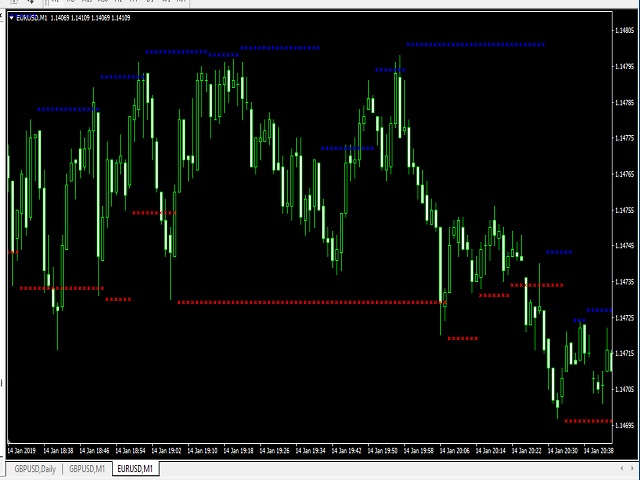
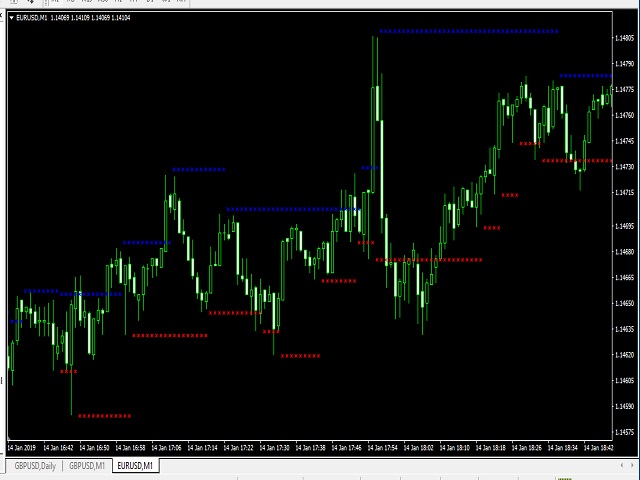
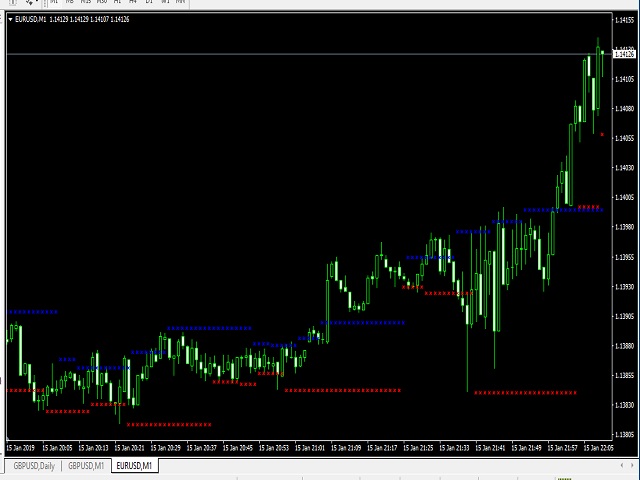
  • Dream Wall Street It represents the visualization of support resistance levels.
  • the indicator marks the levels that are formed on a candle whose tick volume exceeds the average volume; it is perfect as it is without filters for scalping by level
  • it can also be used as an addition to an existing trading system. The indicator can be used as a filter. It is already set up to configure anything for you.
  • Settings allow you to customize the light levels


おすすめのプロダクト
これは、キャンドルの終値を予測する指標です。 このインジケータは、主にD1チャートでの使用を目的としていますが. この指標は、従来の外国為替取引とバイナリオプション取引の両方に適しています。 インジケーターは、スタンドアロンのトレーディングシステムとして使用することも、既存のトレーディングシステムへの追加として機能させることもできます。 このインジケーターは、現在のキャンドルを分析し、キャンドル自体の内部の特定の強度係数と、前のキャンドルのパラメーターを計算します。 したがって、この指標は、市場の動きのさらなる方向性と現在のキャンドルの終値を予測します。 この方法のおかげで、この指標は、短期の日中取引だけでなく、中期および長期の取引にも適しています。 インジケーターを使用すると、市場の状況の分析中にインジケーターが生成する潜在的な信号の数を設定できます。 インジケーターの設定には、このための特別なパラメーターがあります。 また、インジケーターは、チャート上のメッセージの形式で、電子メールで、およびPUSH通知の形式で、新しい信号について通知することができます。 購入後は必ず私に書いて
It will be the best tool for you to make a profit! Through unique algorithms You're going to see an amazing amount of right trading signals Make huge profits every day and realize more possibilities!   Like the car no money to buy it, the love of the girls dare not to pursue?Or the credit card bill is not paid, the rent does not have the extra money to settle?Or are you fed up with being bossed around by your boss and Hope to get more people's respect?Can't afford to buy the things you want ? wa
El indicador "MR BEAST ALERTAS DE LIQUIDEZ" es una herramienta avanzada diseñada para proporcionar señales y alertas sobre la liquidez del mercado basándose en una serie de indicadores técnicos y análisis de tendencias. Ideal para traders que buscan oportunidades de trading en función de la dinámica de precios y los niveles de volatilidad, este indicador ofrece una visualización clara y detallada en la ventana del gráfico de MetaTrader. Características Principales: Canal ATR Adaptativo: Calcula
Was: $249  Now: $99   Market Profile defines a number of day types that can help the trader to determine market behaviour. A key feature is the Value Area, representing the range of price action where 70% of trading took place. Understanding the Value Area can give traders valuable insight into market direction and establish the higher odds trade. It is an excellent addition to any system you may be using. Blahtech Limited presents their Market Profile indicator for the MetaTrader community. Ins
Owl smart levels
Sergey Ermolov
4.13 (23)
MT5版  |   FAQ Owl Smart Levels Indicator   は、 Bill Williams   の高度なフラクタル、市場の正しい波構造を構築する Valable ZigZag、エントリの正確なレベルをマークする Fibonacci レベルなどの一般的な市場分析ツールを含む 1 つのインジケーター内の完全な取引システムです。 利益を得るために市場と場所に。 戦略の詳細な説明 インジケータを操作するための指示 顧問-取引助手 プライベートユーザーチャット ->購入後に私に書いて、私はプライベートチャットにあなたを追加し、あなたはそこにすべてのボーナスをダウンロードすることができます 力はシンプルさにあります! Owl Smart Levels   取引システムは非常に使いやすいので、専門家にも、市場を勉強し始めて自分で取引戦略を選択し始めたばかりの人にも適しています。 戦略と指標に秘密の数式や計算方法が隠されているわけではなく、すべての戦略指標は公開されています。 Owl Smart Levels を使用すると、取引を開始するためのシグナルをすばやく確認し、
サポート線と抵抗線のプロットにうんざりしていませんか? サポートレジスタンス は、非常に興味深いひねりを加えてチャート内のサポートとレジスタンスラインを自動検出およびプロットするマルチタイムフレームインジケーターです。価格レベルは時間とともにテストされ、その重要性が高まるにつれて、ラインは太くなり、暗くなります。 [ インストールガイド | 更新ガイド | トラブルシューティング | よくある質問 | すべての製品 ] 一晩でテクニカル分析を強化 チャートを閲覧せずに重要な価格レベルを検出 一目ですべての価格レベルの相対的な強さを認識する すべての取引で最大30時間のプロットラインを節約 インジケーターは、すべての価格レベルの年齢を表示します インジケーターは再描画されていません 過去および現在の価格レベルは近接によって崩壊し、現在の市場行動に合わせて調整されます。動作は、必ずしもピークではない場所に線が引かれます。 価格レベルは、時間とともに拒否されるにつれて、より暗く、より広くなります ノイズを避けるために、重要でない価格レベルは定期的にクリアされます カスタマイズ可能な時間枠の
BoxChart MT4
Evgeny Shevtsov
4.4 (5)
The market is unfair if only because 10% of participants manage 90% of funds. An ordinary trader has slim changes to stand against these "vultures". This problem can be solved. You just need to be among these 10%, learn to predict their intentions and move with them. Volume is the only preemptive factor that faultlessly works on any timeframe and symbol. First, the volume appears and is accumulated, and only then the price moves. The price moves from one volume to another. Areas of volume accumu
インディケータは現在のクオートを作成し、これを過去のものと比較して、これに基づいて価格変動予測を行います。インジケータには、目的の日付にすばやく移動するためのテキスト フィールドがあります。 オプション: シンボル - インジケーターが表示するシンボルの選択; SymbolPeriod - 指標がデータを取る期間の選択; IndicatorColor - インジケータの色; HorisontalShift - 指定されたバー数だけインディケータによって描画されたクオートのシフト; Inverse - true は引用符を逆にします。false - 元のビュー。 ChartVerticalShiftStep - チャートを垂直方向にシフトします (キーボードの上下矢印)。 次は日付を入力できるテキストフィールドの設定で、「Enter」を押すとすぐにジャンプできます。
Power Renko is an indicator which plots Renko bricks underneath the chart using a histogram. You can select the brick size and the timeframe of the Renko bricks as well as whether or not to use the close price or the high/low price of the candles. Renko bricks are based on price alone, not time, therefor the Renko bricks will not be aligned with the chart's time. They are extremely useful for trend trading and many different strategies can be formed from them. Buffers are provided allowing you t
Insider Scalper Binary This tool is designed to trade binary options. for short temporary spends. to make a deal is worth the moment of receiving the signal and only 1 candle if it is m1 then only for a minute and so in accordance with the timeframe. for better results, you need to select well-volatile charts.... recommended currency pairs eur | usd, usd | jpy .... the indicator is already configured, you just have to add it to the chart and trade .... The indicator signals the next can
VR Cub
Vladimir Pastushak
VR Cub は、質の高いエントリーポイントを獲得するためのインジケーターです。このインジケーターは、数学的計算を容易にし、ポジションへのエントリーポイントの検索を簡素化するために開発されました。このインジケーターが作成されたトレーディング戦略は、長年にわたってその有効性が証明されてきました。取引戦略のシンプルさはその大きな利点であり、初心者のトレーダーでもうまく取引することができます。 VR Cub はポジション開始ポイントとテイクプロフィットとストップロスのターゲットレベルを計算し、効率と使いやすさを大幅に向上させます。取引の簡単なルールを理解するには、以下の戦略を使用した取引のスクリーンショットを見てください。 設定、設定ファイル、デモ版、説明書、問題解決方法は、以下から入手できます。 [ブログ] レビューを読んだり書いたりすることができます。 [リンク] のバージョン [MetaTrader 5] エントリーポイントの計算ルール ポジションをオープンする エントリーポイントを計算するには、VR Cub ツールを最後の高値から最後の安値までストレッチする必要があります。
Market Profile Shows where the price has spent more time, highlighting important levels that can be used in trading. It is a powerful tool which is designed to take the fundamental components which comprise every market; price/volume/time, and visually display their relationship in real-time as the market develops for a pre-determined time period. Very powerful tool!
"The trend is your friend" is one of the best known sayings in investing, because capturing large trendy price movements can be extremely profitable. However, trading with the trend is often easier said than done, because many indicators are based on price reversals not trends. These aren't very effective at identifying trendy periods, or predicting whether trends will continue. We developed the Trendiness Index to help address this problem by indicating the strength and direction of price trend
What are Heiken Ashi Candles? Heiken Ashi, derived from the Japanese term 'Heikin Ashi,' translates to average price bars. It's an indicator depicting price bars on a chart. Formula for Heiken Ashi candles: - Heiken Ashi opening price: (previous candle's opening + closing price) / 2 - Closing price Heiken Ashi: (opening + high + low + closing) / 4 - Heiken Ashi peak: Max of high, opening, or closing price - Heiken Ashi bottom price: Min of low, opening, or closing price How to Read Heik
The indicator shows the potential trend direction by cyclical-wave dependence. Thus, all the rays of the intersection will be optimal rays, in the direction of which the price is expected to move, taking into account the indicator period. Rays can be used as a direction for potential market movement. But we must not forget that the approach must be comprehensive, the indicator signals require additional information to enter the market.
The perfect tool for Scalng in the Forex markets You can trade both from signal to signal and using take profit  The algorithm does not use Zigzag!  No redrawing!  This is a channel instrument that uses a moving average as a filter. Moving Average  There are 2 parameters for the settings Ma Period = 5 period Moving Average  Channel 1.0 distance of channel lines from the chart Price Signal Filter - calculation of signal opening and filter There is a complete set of Alert There is a multi-timefram
Noize Absorption Index - is the manual trading system that measures the difference of pressure between bears forces and bulls forces. Green line - is a noize free index that showing curent situation. Zero value of index shows totally choppy/flat market.Values above zero level shows how powerfull bullish wave is and values below zero measures bearish forces.Up arrow appears on bearish market when it's ready to reverse, dn arrow appears on weak bullish market, as a result of reverse expectation. S
A new generation PROgressive indicator from INFINITY. Predictor PRO uses its own entry and exit calculation strategy. Indicator without redrawing signals! This is very important for real trading. The indicator can be used for any currency pairs, metals, cryptocurrencies or indices. The best time of the H1 chart. Unlike other indicators, Predictor PRO shows shows the Buy/Sell entry point and the Close exit point. Calculating the profit of all signals in points on the panel helps to choose th
The Chaikin Oscillator is a technical indicator developed by Marc Chaikin that combines price and volume data to measure the accumulation and distribution of a financial instrument. It aims to identify potential buying and selling opportunities in the market. The Chaikin Oscillator is calculated by subtracting a 10-day exponential moving average of the Accumulation Distribution Line (ADL) from a 3-day exponential moving average of the ADL. Here's how to use the Chaikin Oscillator indicator in tr
This is a trend indicator without redrawing Developed instead of the binary options strategy (by the color of the Martingale candlestick) Also works well in forex trading When to open trades (binary options) A signal will appear in the place with a candle signaling the current candle It is recommended to open a deal for one candle of the current timeframe M1 and M5 When a blue dot appears, open a deal up When a red dot appears, open a trade down. How to open trades on Forex. When a signal is rec
Volume Profile Indicator for MT4 Gain a trading edge with the "Volume Profile" indicator for MetaTrader 4 (MT4). This advanced technical analysis tool allows you to precisely identify key support and resistance levels based on transaction volume. Easily visualize market areas of high interest, where trading volumes are highest, and use this information to make more informed trading decisions. Key Features: Clear and detailed visualization : The indicator displays volume histograms directly on th
まず第一に、この取引インジケーターは再描画されず、再描画されず、遅延しないことを強調する価値があります。これにより、手動取引とロボット取引の両方に理想的なものになります。 ユーザーマニュアル:設定、入力、戦略。 アトミックアナリストは、価格の強さとモメンタムを利用して市場でより良いエッジを見つけるためのPA価格アクションインジケーターです。ノイズや誤ったシグナルを除去し、取引ポテンシャルを高めるための高度なフィルターを備えています。複雑なインジケーターの複数のレイヤーを使用して、アトミックアナリストはチャートをスキャンし、複雑な数学的計算をシンプルなシグナルと色に変換します。これにより、どのような初心者トレーダーでも理解して使用し、一貫した取引の決定を行うことができます。 「アトミックアナリスト」は、新規および経験豊富なトレーダー向けにカスタマイズされた包括的な取引ソリューションです。プレミアムインジケーターとトップノッチの機能を1つの取引戦略に組み合わせ、すべてのタイプのトレーダーにとって汎用性のある選択肢にします。 デイリートレーディングとスキャルピング戦略:高
The Penta-O is a 6-point retracement harmonacci pattern which usually precedes big market movements. Penta-O patterns can expand and repaint quite a bit. To make things easier this indicator implements a twist: it waits for a donchian breakout in the right direction before signaling the trade. The end result is an otherwise repainting indicator with a very reliable trading signal. The donchian breakout period is entered as an input. [ Installation Guide | Update Guide | Troubleshooting | FAQ | A
VR Grid
Vladimir Pastushak
5 (1)
VR グリッド インジケーターは、ユーザー定義の設定を使用してグラフィカル グリッドを作成するように 設計 されています。 標準グリッド とは異なり、VR グリッドは 円形レベル を構築するために使用されます。ユーザーの選択に応じて、ラウンド レベル間のステップは任意に設定できます。さらに、他のインジケーターやユーティリティとは異なり、VR Grid は期間が変更されたり、端末が再起動されたりした場合でも、 グリッドの位置を維持 します。 設定、設定ファイル、デモ版、説明書、問題解決方法は、以下から入手できます。 [ブログ] レビューを読んだり書いたりすることができます。 [リンク] のバージョン [MetaTrader 5] 垂直レベル は実際の時間間隔に基づいており、 欠落している または存在しない期間は無視します。したがって、レベル間のステップは、ユーザーが選択した値に厳密に対応します。 VR グリッド インジケーターを使用すると、トレーダーは任意のレベルで 垂直線と水平線のスタイル 、色、太さを変更できます。これにより、金融商品の ラウンドレベル を制御できます。 ラウ
FREE
Globex 360 Scalping is a unique scalping indicator that shows price reversal points. With the help of this indicator, you will see on the chart when the price is reversing, and at this moment you can open deals in the direction of the signal. This is an indispensable assistant for both novice traders and professionals. This indicator shows the trader important and valuable information for effective trading. Globex 360 Scalping - Applies smooth scanning technology for market analysis. The indica
The Stepping Trend Indicator     The Steppi ng Trend indicator uses the  average true range  (ATR indicator) in its calculation. This gives you control to set your own average true range period, I set the Default as 10.   Indicator Details. Green Arrow Up: This means you are at the starting point of a new bullish trend, it’s time to buy.   Red  Arrow  Down : This means you are at the starting point of a new  bearish  trend, it’ s time to sell .   What if you miss the Arrow Signal?   No
This unique multi-currency strategy simultaneously determines the end of the trend, entry points and the expected take profit levels for each trade. The indicator can determine entry points on any trading period from M1 to D1. For the convenience of users, the indicator renders the entry point (in the form of an arrow), recommended take profit levels (Fast Take Profit, Middle Take Profit, Main Take Profit, Global Take Profit) and the Stop Loss level. The detailed guide on how to use the indicato
An indicator of pattern #31 ("Long Island") from Encyclopedia of Chart Patterns by Thomas N. Bulkowski. The second gap is in the opposite direction. Parameters: Alerts - show alert when an arrow appears   Push - send a push notification when an arrow appears (requires configuration in the terminal) GapSize - minimum gap size in points ArrowType - a symbol from 1 to 17 ArrowVShift - vertical shift of arrows in points   ShowLevels - show levels ColUp - color of an upward line ColDn - color of
Next level of trend trading here. Possibility 75%, the indicator analyzes the current market to determine short (small dot), middle (circle with a dot inside) and long (cross with a circle and a dot inside) trends.  Wingdings characters of  Aqua color represents the beginning of the UP trend. Wingdings characters of  Orange color represents the beginning of the DOWN trend. Possibility 75% Indicator will improve your trading in the world of forex, commodities, cryptocurrencies and indices.
Square Dashboard is a new generation indicator that has the task of simplifying the technical analysis of the market and speeding up access to the charts. The logic of this indicator is really simple but effective, you can observe the daily, weekly and monthly opening values. The confluence of these values leads to the generation of the warning, red to identify bearish conditions, green to identify bullish conditions, while the gray color identifies the lateral condition. Having the whole market
このプロダクトを購入した人は以下も購入しています
Gann Made Easy は、ミスター・ギャンの理論を使用した取引の最良の原則に基づいた、プロフェッショナルで使いやすい外国為替取引システムです。 W・D・ガン。このインジケーターは、ストップロスとテイクプロフィットレベルを含む正確な買いと売りのシグナルを提供します。 PUSH通知を利用して外出先でも取引可能です。 購入後はご連絡ください!私の取引のヒントと素晴らしいボーナスインジケーターを無料で共有します! おそらく、ギャンの取引手法についてはすでに何度も聞いたことがあるでしょう。通常、ギャンの理論は初心者のトレーダーだけでなく、すでにある程度の取引経験がある人にとっても非常に複雑なものです。なぜなら、ギャンの取引手法は理論的にはそれほど簡単に適用できるものではないからです。私はその知識を磨き、最良の原則を私の外国為替インジケーターに組み込むために数年を費やしました。 このインジケーターは非常に簡単に適用できます。必要なのは、それをチャートに添付し、簡単な取引推奨事項に従うだけです。このインジケーターは常に市場分析の仕事を行い、取引の機会を探します。適切なエントリーポイントを検出
Trend Punch
Mohamed Hassan
5 (11)
This indicator is unstoppable when combined with our other indicator called  Support & Resistance . After purchase, send us a message and you will get it   for  FREE as a BONUS! Introducing Trend Punch , the revolutionary forex trend indicator that will transform the way you trade! Trend Punch is uniquely designed to provide precise buy and sell arrows during strong market trends, making your trading decisions clearer and more confident. Whether you're trading major currency pairs or exotic sym
mql5と Telegramの モーニング・ブリーフィングで、詳細とスクリーンショットを含む毎日のマーケット・アップデートをご覧 ください! FX Power MT4 NGは 、長年の人気を誇る通貨強度計FX Powerの次世代モデルです。 この次世代ストレングスメーターは何を提供するのでしょうか?初代FXパワーの魅力すべて プラス GOLD/XAUの強さ分析 より正確な計算結果 個別に設定可能な分析期間 カスタマイズ可能な計算上限値により、さらに優れたパフォーマンスを実現 もっと見たい人のための特別なマルチインスタンス設定 すべてのチャートでお好みの色を無限に設定可能 数え切れないほどの通知オプションにより、重要なことを見逃すことはありません。 Windows 11とmacOSのスタイルで角を丸くした新しいデザイン 魔法のように動くインジケーターパネル FXパワーの主な機能 すべての主要通貨の強さの完全な履歴 すべての時間枠における通貨の強さの履歴 すべてのブローカーとチャートで同一の計算結果 100%信頼できるリアルタイム計算 -> リペイントなし ドロップダウン・リストから
製品を購入する前に、以下の情報をお読みください。 Apollo Pips PLUS SP はユニークな製品です。これは、私の新しい「アポロ ピップス」インジケーターと、私のすべての取引インジケーターにアクセスできる「スーパー パック」ボーナスを手に入れたい人のためのものです。 Apollo Pips PLUS SP 製品を購入すると、実際には私の Apollo Pips インジケーターのまったく新しいバージョンを購入することになります。このバージョンのインジケーターには改良されたアルゴリズムと使いやすいパラメーターがあり、あらゆる市場およびあらゆる取引スタイルでインジケーターを使用する機会が得られます。 この製品の購入者は、私のスーパーボーナスとして、他のすべてのインジケーターにも無料でアクセスできます!私のすべての取引ツールにアクセスしたい場合は、この製品が最適です!:) しかし、これがすべてではありません!:) この製品のすべての購入者は、私の新しいインジケーターを無料で入手する資格もあります!:)新しい取引インジケーターを利用できるようになりました。私の特権のある「スーパー パッ
TPSpro TREND PRO は 、市場を自動的に分析し、トレンドとその各変化に関する情報を提供し、再描画せずに取引に参加するためのシグナルを提供するトレンド指標です。 インディケータは各ローソク足を使用し、個別に分析します。さまざまなインパルス(アップまたはダウンインパルス)を指します。通貨、仮想通貨、金属、株、指数の取引への正確なエントリーポイント! バージョンMT5                   インジケーターの完全な説明   インジケーター -   RFI LEVELS と併用することをお勧めします。 主な機能: レンダリングなしで正確な入力信号! シグナルが表示された場合、それは関連性を維持します。これは、シグナルを提供してからそれを変更する可能性があり、入金時の資金の損失につながる可能性があるリドローインジケーターとの重要な違いです。より高い確率と精度で市場に参入できるようになりました。矢印が表示された後、ターゲットに達する (利益確定) か反転シグナルが表示されるまで、ローソク足を色付けする機能もあります。 STOP LOSS / TAKE PROFIT
Please contact me after purchase to immediately get your PDF strategy + documentation for Trend Pulse !  Official release price of $89  (2 /50 copies left). Next price is $199 . Introducing Trend Pulse , a unique and robust indicator capable of detecting bullish, bearish, and even ranging trends! Trend Pulse uses a special algorithm to filter out market noise with real precision. If the current symbol is moving sideways, Trend Pulse will send you a ranging signal, letting you know that it'
An exclusive indicator that utilizes an innovative algorithm to swiftly and accurately determine the market trend. The indicator automatically calculates opening, closing, and profit levels, providing detailed trading statistics. With these features, you can choose the most appropriate trading instrument for the current market conditions. Additionally, you can easily integrate your own arrow indicators into Scalper Inside Pro to quickly evaluate their statistics and profitability. Scalper Inside
通貨強さウィザードは、取引を成功させるためのオールインワン ソリューションを提供する非常に強力な指標です。このインジケーターは、複数の時間枠のすべての通貨のデータを使用して、このまたはその外国為替ペアのパワーを計算します。このデータは、使いやすい通貨インデックスと通貨パワーラインの形式で表され、特定の通貨のパワーを確認するために使用できます。 必要なのは、取引したいチャートにインジケーターを接続することだけです。インジケーターは、取引する通貨の実際の強さを示します。このインジケーターは、トレンドに合わせて取引するときに有利に利用できる売買高の圧力の極値も示します。このインジケーターには、フィボナッチに基づく可能なターゲットも表示されます。 このインジケーターは、PUSH 通知を含むあらゆるタイプのアラートを提供します。 購入後ご連絡下さい。私の取引のヒントをあなたと共有し、素晴らしいボーナスインジケーターを無料で提供します! 幸せで有益な取引をお祈りします。
今、147ドル(いくつかの更新後に499ドルに増加します) - 無制限のアカウント(PCSまたはMac) RelicusRoad ユーザー マニュアル + トレーニング ビデオ + プライベート Discord グループへのアクセス + VIP ステータス 市場の新しい見方 RelicusRoad は、外国為替、先物、暗号通貨、株式、および指数の世界で最も強力な取引インジケーターであり、トレーダーに収益を維持するために必要なすべての情報とツールを提供します。初心者から上級者まで、すべてのトレーダーが成功するためのテクニカル分析と取引計画を提供します。これは、将来の市場を予測するのに十分な情報を提供する重要な取引指標です。意味をなさないチャート上のいくつかの異なる指標ではなく、完全な解決策を信じています.これは、信号、矢印 + 価格アクション情報を表示するオールインワンのインジケーターで、他に類を見ない非常に正確です。 強力な AI に基づいて、RelicusRoad は不足している情報とツールを提供して、あなたを教育し、トレーディングのプロ、成功したトレーダーにします。
現在20%OFF! 初心者やエキスパートトレーダーのためのベストソリューション! このダッシュボードソフトウェアは、28の通貨ペアで動作しています。それは私達の主要な指標(高度な通貨の強さ28と高度な通貨インパルス)の2に基づいています。それは全体の外国為替市場の大きい概観を与えます。それは、すべての(9)時間枠で28の外国為替ペアのための高度な通貨の強さの値、通貨の動きの速度と信号を示しています。チャート上で1つのインディケータを使用して市場全体を観察し、トレンドやスキャルピングの機会をピンポイントで見つけることができたら、あなたのトレードがどのように改善されるか想像してみてください。 このインディケータには、強い通貨と弱い通貨の識別、潜在的な取引の識別と確認がより簡単になるような機能が搭載されています。このインディケータは、通貨の強さや弱さが増加しているか減少しているか、また、すべての時間枠でどのように機能しているかをグラフィカルに表示します。 新機能として、現在の市場環境の変化に適応するダイナミックなマーケットフィボナッチレベルが追加され、すでに当社のAdvan
Clear Breakout
Martin Alejandro Bamonte
「Breakout Buy-Sell」インジケーターは、異なる市場セッション(東京、ロンドン、ニューヨーク)での価格ブレイクアウトに基づいて、潜在的な売買機会を識別し、強調するために設計されています。このインジケーターは、トレーダーが買いゾーンと売りゾーン、および利益確定(TP)とストップロス(SL)レベルを明確に視覚化するのに役立ちます。 使用戦略 インジケーターは以下のように使用できます: 初期設定 :市場セッションを選択し、GMTオフセットを調整します。 市場の視覚化 :各セッションの開始時に描かれるブレイクアウトボックスを観察します。これらのボックスは期間の高値と安値を示します。 売買シグナル :ボックスの高値を超えた場合は買いシグナルと見なされます。安値を下回った場合は売りシグナルと見なされます。 リスク管理 :TP1、TP2、TP3、およびSLレベルを使用してポジションを管理します。TPレベルは異なる利益目標のために設計されており、SLは不利な動きに対する保護を保証します。 応用戦略 このインジケーターを最大限に活用するために、以下の戦略が推奨されます: ロンドンセッション
現在31%オフ! 初心者やエキスパートトレーダーに最適なソリューション! このインジケータは、独自の機能と秘密の数式を組み込んだ、ユニークで高品質かつ手頃な価格のトレーディングツールです。たった1枚のチャートで28の通貨ペアのアラートを表示します。新しいトレンドやスキャルピングチャンスの引き金となるポイントを正確に把握することができるので、あなたのトレードがどのように改善されるか想像してみてください! 新しい基本的なアルゴリズムに基づいて構築されているため、潜在的な取引の特定と確認がより簡単になります。これは、通貨の強さや弱さが加速しているかどうかをグラフィカルに表示し、その加速のスピードを測定するためです。加速すると物事は明らかに速く進みますが、これはFX市場でも同じです。つまり、反対方向に加速している通貨をペアにすれば、利益を生む可能性のある取引を特定することができるのです。 通貨の勢いを示す縦の線と矢印は、あなたの取引の指針となるでしょう。 ダイナミックマーケットフィボナッチ23レベルはアラートトリガーとして使用され、市場の動きに適応します。もしインパルスが黄色
現在26%オフ 初心者やエキスパートトレーダーに最適なソリューション! このインジケーターは、独自の機能と新しい計算式を取り入れた、ユニークで高品質、かつ手頃な価格のトレーディングツールです。たった1枚のチャートで28の為替ペアの通貨強度を読み取ることができます。新しいトレンドやスキャルピングチャンスの引き金となるポイントを正確に特定することができるので、あなたのトレードがどのように改善されるか想像してみてください。 ユーザーマニュアルはこちら  https://www.mql5.com/en/blogs/post/697384 これが最初の1本、オリジナルだ! 価値のないクローンを買わないでください。 特別な サブウィンドウの矢印で強い通貨の勢いを表示 GAPがあなたのトレードを導く! 基準通貨や気配値が売られすぎ・買われすぎのゾーン(外相フィボナッチレベル)にあるとき、個別チャートのメインウィンドウに警告表示。 通貨がレンジの外側から反落した場合、プルバック/リバーサルのアラート。 クロスパターンの特別なアラート 複数の時間枠を選択可能で、トレンドを素早く
PRO Renko Systemは、特別にRENKOチャートを取引するために設計された高精度の取引システムです。 これは、様々な取引商品に適用することができる普遍的なシステムです。 システムは効果的に正確な逆転信号へのアクセスを与えるいわゆる市場の騒音を中和する。 表示器は非常に使いやすく、信号の生成に責任がある1つの変数だけがあります。 あなたは簡単にお好みの任意の取引ツールとレンコバーのサイズにツールを適応させることができます。 私はいつもあなたが私のソフトウェアで収益性の高い取引を支援するために余分なサポートを提供する準備ができています! 私はあなたに幸せで収益性の高い取引をしたいです! ご購入後にご連絡ください! 私はあなたに私のレンコチャートジェネレータを送信します。 私はまた、私の個人的な推奨事項やシステムの他のモジュールを無料で共有します!
Gold Channel is a volatility-based indicator, developed with a specific timing algorithm for the XAUUSD pair, which consists of finding possible corrections in the market. This indicator shows two outer lines, an inner line (retracement line) and an arrow sign, where the theory of the channel is to help identify overbought and oversold conditions in the market. The market price will generally fall between the boundaries of the channel. If prices touch or move outside the channel it is a tra
まず第一に、この取引ツールはノンリペイント、ノンリドロー、ノンラグの指標であり、プロの取引に理想的ですことを強調する価値があります。 オンラインコース、ユーザーマニュアル、デモ。 スマートプライスアクションコンセプトインジケーターは、新米から経験豊富なトレーダーまで、非常 に強力なツールです。Inner Circle Trader AnalysisやSmart Money Concepts Trading Strategiesなど、20以上の有用な指標を1つに組み合わせています。このインジケーターはスマートマネーコンセプトに焦点を当て、大手機関の取引方法を提供し、彼らの動きを予測するのに役立ちます。 特に、流動性分析に優れており、機関がどのように取引しているかを理解しやすくしています。市場のトレンドを予測し、価格の動きを慎重に分析するのに優れています。機関の戦略とトレードを合わせることで、市場の動向についてより正確な予測ができます。このインジケーターは多目的であり、市場構造を分析し、重要な注文ブロックを特定し、さまざまなパターンを認識するのに優れています。 このインジケー
NAM Order Blocks
NAM TECH GROUP, CORP.
5 (1)
MT4マルチタイムフレームオーダーブロック検出インジケーター。 特徴 -チャートコントロールパネルで完全にカスタマイズ可能で、完全な相互作用を提供します。 -必要な場所でコントロールパネルを表示および非表示にします。 -複数の時間枠でOBを検出します。 -表示するOBの数量を選択します。 -さまざまなOBユーザーインターフェイス。 -OBのさまざまなフィルター。 -OB近接アラート。 -ADRの高線と低線。 -通知サービス(画面アラート|プッシュ通知)。 概要 注文ブロックは、金融機関や銀行からの注文収集を示す市場行動です。著名な金融機関と中央銀行が外国為替市場を牽引しています。したがって、トレーダーは市場で何をしているのかを知る必要があります。市場が注文ブロックを構築するとき、それは投資決定のほとんどが行われる範囲のように動きます。 注文の構築が完了すると、市場は上向きと下向きの両方に向かって急激に動きます。注文ブロック取引戦略の重要な用語は、機関投資家が行っていることを含むことです。それらは主要な価格ドライバーであるため、機関投
トレンドトレーディング は、タイミングのプルバックとブレイクアウトにより、市場で起こっているトレンドから可能な限り利益を得るように設計された指標です。確立されたトレンドの中で価格が何をしているかを分析することにより、取引の機会を見つけます。 [ インストールガイド | 更新ガイド | トラブルシューティング | よくある質問 | すべての製品 ] 自信を持って効率的に金融市場を取引する むち打ちにならずに確立されたトレンドから利益を得る 収益性の高いプルバック、ブレイクアウト、早期の逆転を認識する この指標は、独自の品質とパフォーマンスを分析します 複数時間枠のダッシュボードを実装します インジケーターは再描画されていません 電子メール/音声/視覚アラートを実装します 確立されたトレンドは多くの取引機会を提供しますが、ほとんどのトレンド指標はそれらを完全に無視しています。インジケーターの解釈はかなり簡単です: (1) トレンドの変化 (2) トレンドの方向への後退 (3) トレンドの方向へのブレイクアウト 赤いダッシュ は下降トレンド中の修正です 青いダッシュ は上昇ト
最初のパルスレベルを反転 (RFI)     指示する     ロシア     -        utilizar con   el indicador の ESP 推奨事項 -   TPSpro トレンド プロフェッショナル版 -   MT5のバージョン 最も重要なことは、将来においても最も重要なことです。 機能のプリンシパル: ゾーンのほとんどは、ベンダーとコンプラドールによってアクティブ化されます。 状況を直感的に把握できるよう、初期の衝動を修正します。 LOGIC AI: MUESTRA zonas (círculos) parabuscar puntos de entrada cuando se activa una plantilla 視覚的に優れた視覚効果があり、最も重要な機能がすべて揃っていることに注意してください。 優れたニベレス/ゾーンの視覚化 (modo MTF) 世界で最も人気のある場所/ゾーンです。これを使用するのに最適な方法です (   TPSproTREND PRO   )。 アルゴリズム プロフェッショナル セパラド パソ ア パソ パラ オペラ それは
Order Block Hunter
Noha Mohamed Fathy Younes Badr
5 (1)
Order block hunter indicator is the best indicator for  hunt the order blocks that area where there has been a large concentration of limit orders waiting to be executed Order blocks are identified on a chart by observing previous price action and looking for areas where the price experienced significant movement or sudden changes in direction .This indicator does that for you by using very complicated codes and helps you to take the best areas To buy and sell because it make marks at the best a
Scalper Vault は、スキャルピングを成功させるために必要なすべてを提供するプロフェッショナルなスキャルピング システムです。このインジケーターは、外国為替およびバイナリー オプションのトレーダーが使用できる完全な取引システムです。推奨される時間枠は M5 です。 システムは、トレンドの方向に正確な矢印シグナルを提供します。また、トップとボトムのシグナルとギャン マーケット レベルも提供します。 インジケーターは、プッシュ通知を含むすべてのタイプのアラートを提供します。 インジケータの購入後にご連絡ください。私の個人的な取引の推奨事項と素晴らしいボーナス指標を無料で共有します! 幸せで有益な取引をお祈りします!
M1 Arrow
Oleg Rodin
4.67 (12)
市場の2つの基本原則に基づく日中戦略。 このアルゴリズムは、追加のフィルターを使用したボリュームと価格の波の分析に基づいています。インディケータのインテリジェントアルゴリズムは、2つの市場要因が1つに結合した場合にのみシグナルを出します。インディケータは、より高い時間枠のデータを使用して、M1チャート上の特定の範囲の波を計算します。そして波を確認するために、インジケーターはボリュームによる分析を使用します。 このインディケータはレディトレーディングシステムです。トレーダーが必要とするのは、信号に従うことだけです。また、インジケーターはあなた自身の取引システムの基礎になることができます。取引はミニッツチャートでのみ行われます。 インジケーターがMTFの原則を使用しているという事実にもかかわらず、インジケーターのアルゴリズムは可能な限り安定しています。 購入後、必ず私に書いてください!私の取引設定と推奨事項をあなたと共有します!
`All in One Chart Patterns` チャートパターンはトレーダーの間で議論の的となっています。信頼できるシグナルだと考える人もいれば、そうでないと考える人もいます。当社の「Chart Patterns All-in-One」インジケーターは、これらのパターンを表示し、自分自身で理論を検証できるようにします。これらのパターンの収益性は、インジケーターの有効性を反映するものではなく、むしろパターン自体の評価です。「Chart Patterns All-in-One」インジケーターは、これらのパターンを視覚化するための優れたツールであり、取引戦略における有効性について自分自身で結論を下すことができます。 このインジケーターは、複数のチャートパターンを1つの統合ツールに組み合わせて、MetaTrader 4 (MT4) で使用します。チャートから直接各パターンをオンまたはオフに切り替える機能を提供し、カスタマイズ可能で効率的な分析を可能にします。以下は、インジケーターとその中に含まれるパターンの詳細な説明です。 #### 含まれるパターン: 1. **パターン
Advanced Supply Demand
Bernhard Schweigert
4.9 (271)
現在33%オフ 初心者にもエキスパートトレーダーにも最適なソリューション このインジケーターは独自の機能と新しい公式を多数内蔵しており、ユニークで高品質かつ手頃な取引ツールです。このアップデートでは、2つの時間枠ゾーンを表示できるようになります。より長いTFだけでなく、チャートTFとより長いTF(ネストゾーンを表示)の両方を表示できます。すべてのSupply Demandトレーダーの皆さんのお気に召すはずです。:) 重要情報の公開 Advanced Supply Demandの可能性を最大化するには、 https://www.mql5.com/ja/blogs/post/720245 にアクセスしてください。   エントリーまたはターゲットの正確なトリガーポイントを正確に特定できれば取引がどのように改善されるか想像してみてください。新しい基盤となるアルゴリズムに基づいて構築されているため、買い手と売り手の間の潜在的な不均衡をさらに簡単に特定できます。これは、最も強い需要と供給のゾーンと、過去のパフォーマンス(古いゾーンを表示)がグラフィカルに表現されるためです。これらの機能は、最適
Break and Retest
Mohamed Hassan
3.83 (12)
This Indicator only places quality trades when the market is really in your favor with a clear break and retest. Patience is key with this price action strategy! If you want more alert signals per day, you increase the number next to the parameter called: Support & Resistance Sensitivity.  After many months of hard work and dedication, we are extremely proud to present you our  Break and Retest price action indicator created from scratch. One of the most complex indicators that we made with ove
AW Trend Predictor
AW Trading Software Limited
4.65 (26)
1 つのシステムでのトレンド レベルとブレイクダウン レベルの組み合わせ。高度なインジケーター アルゴリズムは、市場のノイズをフィルター処理し、トレンド、エントリー ポイント、および可能なエグジット レベルを決定します。インジケーターシグナルは統計モジュールに記録されるため、最適なツールを選択してシグナル履歴の有効性を示すことができます。この指標は、テイクプロフィットとストップロスのマークを計算します。 マニュアル・説明書→   こちら / MT5版→   こちら インジケーターで取引する方法: Trend Predictor での取引は、たった 3 つの簡単なステップです。 ステップ 1 - ポジションを開く 70% 以上の成功率で買いシグナルが受信されました ステップ 2 - ストップロスの決定 逆信号でトランクを選択 ステップ 3 - テイクプロフィット戦略の定義 戦略 1: TP1 に到達したらポジション全体をクローズする 戦略 2: TP1 に達した時点でポジションの 50% をクローズし、TP2 に達した時点で残りの 50% をクローズします。 戦略 3: トレンドの反転で
SENSEは、厳選されたGANN手法とフラクタル計算を組み合わせた自動システムです。このシステムは、どこで取引を開始し、どこで決済するかを教えてくれます。もう複雑な計算に時間を費やす必要はありません。インジケータをインストールするだけです。 基本原則: 価格が白い線の上にある時、市場は強気である。 白い線の上で買い、下で止める 緑線は上値目標 白い線より下にあるときは弱気。 白い線より下で売り、上で止める。 赤線は下値目標 緑または赤の線が二重になっている場合は、強いエリアであることを示す。 なぜSENSEなのか? 利益目標 SENSEは自動的に利益確定のターゲットを設定し、取引の成功を最大化するお手伝いをします。 自動適応: このインディケータは、どのような時間枠に対しても自動的に再計算を行い、手動で調整する必要なく、正確で信頼性の高いシグナルを提供します。 スキャルピングにも最適です。 デモをチェック
Connect Indicator is a tool used for connecting indicators between the MQL market and MT4. The connected indicators are made by our group and can be used for other applications, such as sending messages to the Line application or Telegram application. If you have any questions, please don't hesitate to ask us to receive support. Function and indicator buffer Buffer one is the high price of the previous candle. Buffer two is the high price of the previous candle. Usage To connect indicators to fu
カスタムMT4インジケーターで外国為替取引を成功させるための秘密を発見してください! 外国為替市場で成功を達成し、リスクを最小限に抑えながら一貫して利益を得る方法を疑問に思ったことはありますか? これがあなたが探している答えです! 取引へのアプローチに革命をもたらす独自のMT4インジケーターを導入できるようにします。 ユニークな汎用性 私たちのインジケータは、RenkoとRangeBarのろうそくのフォーメーションを好むユーザー向けに特別に設計されています。 これらのチャートタイプは多くの経験豊富なトレーダーに好まれていることを理解しています。そのため、私たちのインジケーターはそれらとシームレスに統合され、比類のない市場分析を提供します。 クリアトレンドシグナル 複雑な分析を忘れてください! 私たちのインジケーターは、鮮やかな色と明確なドット構造を利用して、市場の動向を明確に示しています。 赤と青の点は、価格の動きの方向性について疑いの余地がなく、取引の迅速な意思決定を可能にします。 HH/HL HL/LL戦略とのアライメント HH/HLおよびHL/LL構
PZ Day Trading
PZ TRADING SLU
3.67 (3)
このインディケータは、価格アクション分析とドンチャンチャネルのみを使用して、ジグザグ方式で価格の反転を検出します。再描画やバックペインティングを一切行わずに、短期取引向けに特別に設計されています。それは彼らの操作のタイミングを増やすことを目指している賢明なトレーダーにとって素晴らしいツールです。 [ インストールガイド | 更新ガイド | トラブルシューティング | よくある質問 | すべての製品 ] 驚くほど簡単に取引できます すべての時間枠で価値を提供します 自己分析統計を実装します 電子メール/音声/視覚アラートを実装します 可変長のブレイクアウトと混雑ゾーンに基づいて、インディケータは価格アクションのみを使用して取引を選択し、市場が非常に高速に行っていることに反応します。 過去のシグナルの潜在的な利益が表示されます この指標は、独自の品質とパフォーマンスを分析します 負けブレイクアウトは強調表示され、説明されます インジケータは、非バックペインティングおよび非再ペイントです この指標は、日中のトレーダーが単一の価格反転を見逃さないようにするのに役立ちます。ただし、す
作者のその他のプロダクト
Sniper MACD
Yaroslav Varankin
4 (11)
いくつかの方法で改良されたスナイパーMACDインジケーター。 追加のフィルタがあります 最大の結果を得るために数回平滑化される 市場および現在の価格条件に関する情報をより正確に表示するために、ボリュームインジケータも追加されます 短期的な期間に設定されているので、m1からm30までの期間に指標を使用することをお勧めします eur.usd - eur.jpyのような非常に揮発性の高い通貨ペアで取引することをお勧めします あなたの注意と落札していただきありがとうございます。 ----------------------------------------------------------------------------------------------------------------------------- いくつかの方法で改良されたスナイパーMACDインジケーター。 追加のフィルタがあります 最大の結果を得るために数回平滑化される 市場および現在の価格条件に関する情報をより正確に表示するために、ボリュームインジケータも追加されます 短期的な期間に設定されているので、m1から
FREE
RVI Sniper Alert
Yaroslav Varankin
4.5 (2)
これが究極のRVIインジケータです。 警告矢印を追加 潜在的な抵抗レベルを特定することができます 読み値を改善するための2つの追加フィルタ それはさらに良好な結果を示すために平滑化される m1からm30までの短い時間枠で構成されていました ひどく悪くはありません スクリーンショットmacdのように、このインジケータを追加のフィルタとともに使用することをお勧めします これが究極のRVIインジケータです。 警告矢印を追加 潜在的な抵抗レベルを特定することができます 読み値を改善するための2つの追加フィルタ それはさらに良好な結果を示すために平滑化される m1からm30までの短い時間枠で構成されていました ひどく悪くはありません スクリーンショットmacdのように、このインジケータを追加のフィルタとともに使用することをお勧めします
FREE
Revolution Martingale is an indicator designed for trading binary options on the M5 timeframe. Features: M5 Timeframe: It is recommended to use the indicator on the M5 timeframe for optimal trading. Trade Opening: Trades should only be opened when a signal appears on the 1st candle after opening and signal appearance. Signals: A blue rhombus indicates a potential upward purchase opportunity, while a red rhombus indicates a potential downward option purchase opportunity. Configured for Effective
FREE
Mega Alert Level : A Simple yet Invaluable Indicator This assistant delivers sound, informational, push, and email notifications of your choice when the currency pair's price touches or approaches standard support and resistance levels or any other objects on the chart that you select. The indicator attaches to horizontal support and resistance lines or any other objects on the chart that you choose, plotted on the chart using the terminal's standard tools. In the settings window, you only need
FREE
Scalping Binary option Pro is a dial gauge. --------complete lack of redrawing --------- The indicator does not work correctly in the strategy tester.  The red down arrow indicates that sales should be considered, and the green one - up (purchases).  All that needs to be set up is the colors of the signal arrows, as well as the activation or deactivation of the sound signal when a signal appears in one direction or another.  It is best to use high-pair pairs with a small spread in tradin
Almas Wall Street is a professional arrow indicator with no repainting. Signals appear simultaneously with the formation of a candle. Trading Guidelines: Enter a trade for at least 2 candles or on the next candle after the signal for 1 candle. Screenshot 5 . A red arrow pointing down suggests considering sales, while a blue arrow suggests buying. All you need to configure are the colors of the signal arrows. It is recommended to apply this indicator in scalping on timeframes M1-M5. Signals occur
Brilliant Wall Street is a professional arrow indicator.  It is based on a mathematical calculation.  thanks to a special calculation algorithm that was developed by the best specialists  he is not late, moreover, he gives advanced signals.  -----------almost complete absence of redrawing------------.  signals appear with the advent of the candle.  It is recommended to enter a trade for at least 1-2 candles on the next candle, but you can also use a signal...  The red down arrow indicates
This is a dial indicator for trading from the level of support resistance  --- complete lack of redrawing ---  He is able to determine the levels of support resistance  Finds the best entry points and shows them with arrows.  If a trend is forming, the indicator will always notify with a arrow signal.  buy signal blue arrow for sale red arrow  This signaling tool can also be used on a sideways market.  The main thing is that it is volatile.!!!!!!  Good percentage of correct indicator pr
I n the tester does not work, see how it works in the video; sorry for the inconvenience. UTB is done for real-time work quotation when trading. indicator draws resistance support levels Also, when a level appears, an arrow appears where to open a deal. You will not miss any desired level approach. The indicator showed good results on all graphs and time frames. recommended settings step 1800 p.s traders selling from wall street also use resistance support levels in their analytics how do
Esta es una de las modificaciones de los canales Keltner. Ayuda a identificar puntos de entrada y salida lógicos. Ayuda a determinar un posible movimiento de precios. Crea canales equidistantes que se convierten en niveles de soporte y resistencia dinámicos. Facilita enormemente el análisis del mercado visual. El indicador es un multi-tiempo multi-tiempo muestra buenos resultados.
trading indicator, which automatically recognizes equal levels of support and resistance and otorova content and resistance and poison indicator uses elder system can be applied to any financial instruments and on any timeframes. the same indicator draws to. it is perfect for scalping as its essence is to trade in the channel. The indicator has many parameters that allow it to be conveniently customized. indicator settings filter - it filters the market noise that is, we get more accurate channe
The Bad Boys indicator is a arrow indicator percentage (of positive trades) of correct forecasts of the indicator, even during news releases, the indicator was tested on a real account and showed a good result of correct forecasts. Settings allow you to customize the color of the arrows. volatility period indicator period the number of bars for which the market analysis will be carried out price is the method when a signal will appear when opening when closing a candle, etc. volatility allows yo
The Divergent Accuracy indicator is designed to identify discrepancies on the price chart of a currency pair. The Divergent Accuracy indicator recognizes bullish and bearish divergences, and can also output a signal that a divergence has been detected... In addition to identifying divergences, the indicator works with overbought and oversold levels, and also shows arrows to enter the market...
The premium loudness indicator draws on the chart of a currency pair based on data on the price level in the back period in the input parameters of the indicator in the form of a histogram. The width of the histogram at this level means, conditionally, the number of transactions conducted on it If the broker provides real volume data, Cannot be received For example, the range H1 can be specified as H1, H4, D1, W1, MN1. For M1, it is recommended to use periodic settings for M5 values.
Premium Volume Lite The Premium Volume Lite indicator plots the distribution of deals according to price levels in the form of a histogram on a chart of a currency pair. The width of the histogram at this level means, conditionally, the number of transactions carried out on it. If the broker provides data on real volume, the indicator can show the distribution over it. Ranges can be equal only to standard timeframes not lower than the current one. о periods value is current then the indicator wi
The Invisible Sniper arrow indicator is built on the use of candlestick analysis. The indicator finds the “Absorption” reversal candlestick patterns on the price chart and, depending on the figure, bullish or bearish absorption, gives a signal to enter in the form of blue arrows to buy, red to sell. in the indicator Invisible Sniper implemented sound and text alert..
Big Scalper Pro комбинированный осциллятор, отображающий на ценовом графике  Сигналы на вход отображаются в виде стрелок соответствующего цвета, а также дублируются текстовым сообщением. есть звуковые и текстовые алерты push уведомления уведомления на email все это можно включить и выключить в настройках индикатора настройки период это период г л авного индикатора в период это период дополнительного индикатора волатильности
Dawn In Trading indicator is a new ray of light in trading! This indicator has been tested on a real chart in real trading; All statistics about this indicator from real trading on the market! From the screenshots you can see the profitability of quality and the number of signals of this tool, you can also check it in the tester! As soon as a blue arrow appears, open a deal to increase, when a red arrow appears, open a deal to fall! Signals appear when you open a new candle and do not redraw,
It is possible to trade on any basic asset, but the experts holding testing give preference to currency pair USD/JPY, EUR/USD. Optimum time for work is considered European, the American session. with the standard settings which are already perfected to an ideal At emergence of a blue arrow under a candle the option UP is acquired. At emergence of a red arrow the option DOWN is acquired. It should be noted one feature of the indicator: the signal is formed on the current bar, but it is wo
boss ! Trading opportunities can be used in any underlying asset, but experts in conducting tests prefer the currency pair USD / JPY. The most favorable time for work is the European, American session. When the blue arrow appears, a red option under the candle is acquired UP. When the red arrow appears, the option DOWN is acquired. It is recommended to avoid trading during strong news releases
This indicator was tested on the basis of real statistics for all market indicators according to indicators for 3 months of trading. trade forecasts for usd / jpy on the m30 time frame were received on our statistics! if you have any questions, please contact us in private messages or in discussions under this indicator and we will figure it out and help any questions will arise personal messages or in discussions under this indicator As soon as the blue points appear, we open a deal to incr
The indicator is designed for opening trades for a long period. he is set up to get as many points from each trade as possible. he uses the scalping method... you can trade on any currency pairs indicator is already  you can trade at any time of the day but the preferred time of trading during the European American session. currency pairs eur / jpy, eur / usd currency pairs with high volatility then the results are much better.
Venom
Yaroslav Varankin
Venom indicator is a new type of indicator for scalping with high accuracy of correct predictions in the indicator you can select the indicator signal does not redraw, does not disappear, you can trust it 100% When a red blue arrow appears under the candlestick, an UP option is purchased. When red arrows appear, the DOWN option is purchased. the indicator is based on our new development, if there is an order with a large amount that opens in the direction we need, according to the analysis of th
the indicator showed excellent results in the scalping trade, and the same excellent results in the trading of exact instruments led to the fact that of these indicators showed themselves perfectly during the exit from the news with an  during low volatility,  This instrument has been tested for more than 1 month. What can we say about the number? It is reliable, accurate, at any time of trading. Atom Pro Maximum, this indicator showed excellent results in scalping trading. The accuracy of this
can recognize candlestick patterns he also recognizes the lows and highs of the price for a certain time. MTF works on all currency pairs in futures and sulfur, cryptocurrency does not redraw. his work can be seen in the test. you can trade at any time of the day but the preferred trading time during the European American session ----------------------------------------------------------------------------------------------------------------------------------------------------------
Multi-timeframe indicator perfectly determines when there will be a rollback from the level ideal for binary options. of correct true signals Forex Stop Loss trading can be dragged behind the line thereby moving the deal to breakeven there is a signal in the indicator. The indicator showed excellent results during testing. Test in the test and make sure it is accurate. For any questions, suggestions, please always communicate with you.
multi-timeframe indicator. Ideal for both the Forex market and binary options. Good accuracy of this tool the indicator showed excellent results during testing. test it in a tester and make sure it is accurate.... complete lack of redrawing. You can choose absolutely any instrument. the indicator will provide many profitable and accurate signals. advantages of the indicator: advanced signals. high signal accuracy. frequency of occurrence of signals.
Revolution Martingale Pro indicator for binary options! at the time of opening and the appearance of the signal! Blue diamond is shopping up. A red diamond is an option down. The indicator is already set to trade in binary options. ----------- protection is set against hitting on (steps - martingale knees) protection of several minuses under the row. ------------------------------------------- (Redrawing possible)
indicator for binary options! open a deal only for 1 - candle The indicator is already set to trade in binary options. The indicator is ideal for trading on martingale since he very accurately combines what the next candle will be if you are trading in a martingale money management, this is the indicator that you were looking for; it is just created for you and your trading style p.s it is much better than relying on the color of the candle as some not very experienced traders do (therefore, the
Magic Filter MTF is perfect for any strategy. you do not need to load the chart with extra indicators like this one indicator will replace all additional filters for you it can also be a great strategy. it combines well with trading at local minima and maximums (resistance levels) multi-timeframe-multi-currency indicator 4 screen system is used 4 rows of arrows UTB indicators adjusted for different periods when two arrows pointing in the same direction on the same timeframe coincide
フィルタ:
レビューなし
レビューに返信