Outside Days Candlestick Bulkowski
- インディケータ
- Anthony Ivan
- バージョン: 1.0
- アクティベーション: 5
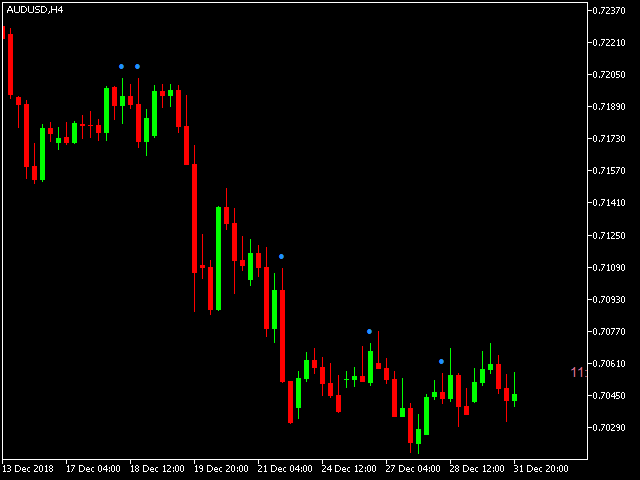
Outside Days Candlestick Bulkowski
The Outside days candlestick is a well-known candle pattern composed of two candles.
This indicator for showing outside days candlestick that describe by Thomas Bulkowski.
If you need for MetaTrader 4 version, please visit here:
Feature Highlights
- Show outside days candlestick.
- Customizable "Symbol".
- Customizable symbol distance from candlestick.
Input Parameters
- Symbol - Input symbol code from "wingdings" for outside days candlestick (default is dot).
- SymbolShift - Input symbol distance from candlestick.
- SymbolColor - Input color for symbol (outside days).
Outside Days Candlestick definition by Thomas Bulkowski:
- Outside days are a two-bar pattern.
- Look for a higher high and lower low on the second day.
- The price bar fits outside the prior day's range.
- The first bar cannot have the high price equal to the low price or four price doji (open = high = low = close price).