Dashboard RSI Multi Time Frame
- ユーティリティ
- Keith Watford
- バージョン: 2.0
- アップデート済み: 12 3月 2020
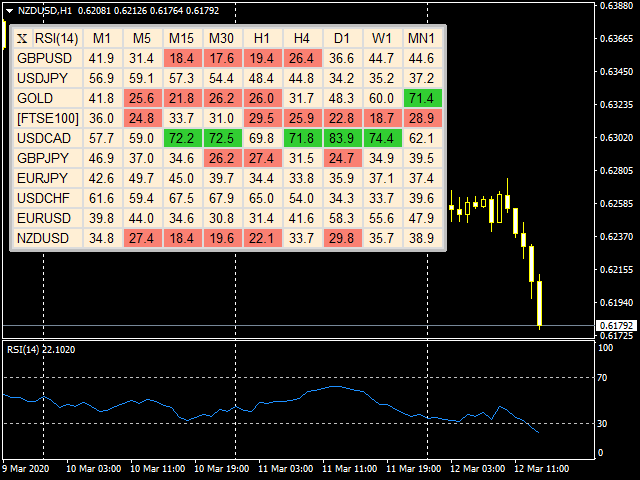
A useful dashboard that shows the RSI values for multiple symbols and Time-frames.
It can be easily hidden/displayed with a simple click on the X top left of the dashboard.
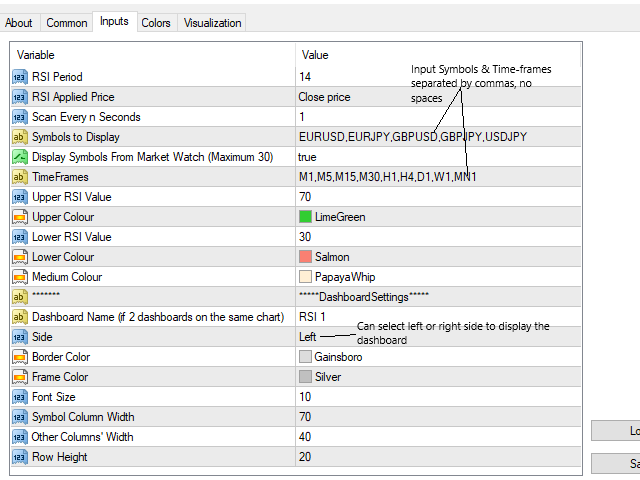
You can input upper and lower RSI values and the colours can be set to show when above/below these values. The default values are 70 and 30.
Symbols and time-frames are input separated by commas.
Symbols can also be loaded from the Market Watch window. If there are more than 30 symbols, only the first 30 will be loaded.
You can choose whether the dashboard is displayed on the right or left of the chart.
If you want to have 2 dashboards on the same chart you must input a different name for each.
The scan is set on a timer now and the default is every second.
I will be releasing a paid for version soon with more features and would appreciate any comments regarding what you would like to see in the paid for version.


EXCELLENT KEEP IMPRVING AND ADD ALERTS AND NOTIFICTION IN MOBILE