Blahtech Moving Average MT5
- インディケータ
- Blahtech Limited
- バージョン: 2.2
- アップデート済み: 20 1月 2021
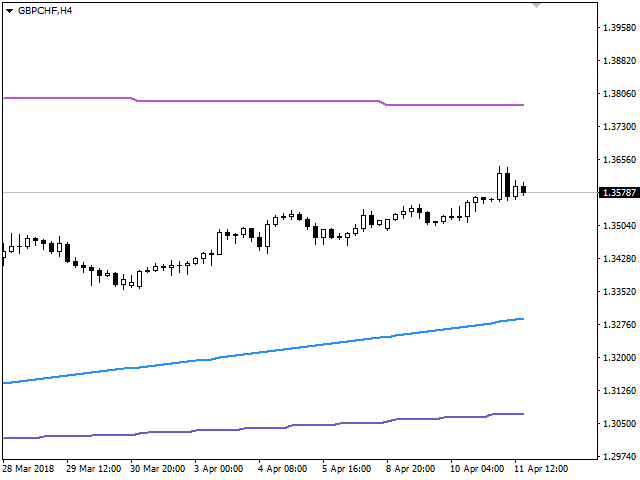
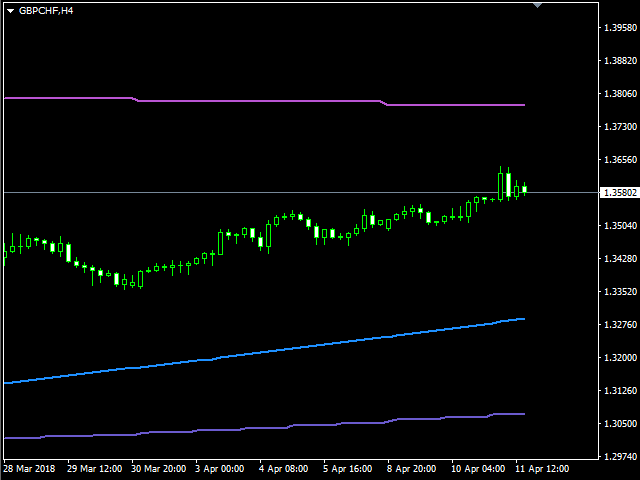
Blahtech Moving Average indicator is a multitimeframe version of the standard Moving Average indicator. It is also enhanced with customisable alerts, period breaks and other configuration options.
The 50 day and 200 day moving averages are widely followed by investors and traders, with breaks above and below the MA lines considered to be signals of interest.
Links [ Install | Update | Training | All Products ]
Feature Highlights
- Up to three timeframes
- Configurable calculation variables
- Customisable alerts and messages
- Optional period breaks
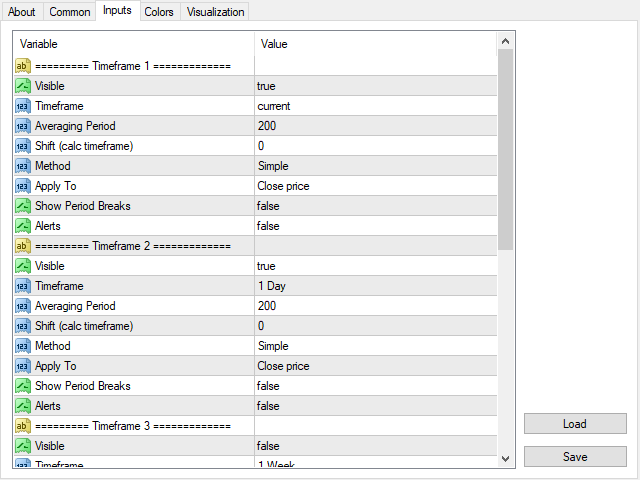
Input Parameters
Timeframe 1
Visible - Display Moving Average on the chart
- Visible - Display Moving Average for the period for this timeframe
- Timeframe - Choose the period for this timeframe
- Averaging Period - Number of iterations to use for the calculation
- Shift (calc timeframe) - Offset the calculations by a number of bars
- Method - Averaging method to use
- Simple
- Exponential
- Smoothed
- Linear-Weighted
- Apply To - Price to use
- Close
- Open
- High
- Low
- Median
- Typical
- Weighted Close
- Show Period Breaks - Display gap in line at the period breaks (higher timeframes only)
- Alerts - Enable alerts for this timeframe
Timeframe 2
- Same as Timeframe 1
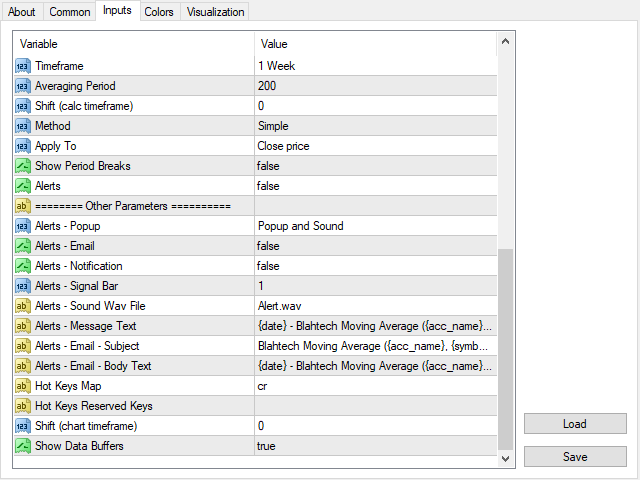
Timeframe 3
- Same as Timeframe 1
Other parameters
- Alerts -Popup - Enable/disable sound and popup dialog for active alerts
- Disabled
- Sound Only
- Popup and Sound
- Alerts - Email - Enable/disable email for active alerts
- Alerts - Notification - Enable/disable notifications for active alerts
- Alerts - Signal Bar - Set the bar that is used to trigger the alerts
- Alerts - Sound Wav File - Set the wav file to be used for alerts
- Alerts - Message Text - Configure the popup and notification alert message text
- Alerts - Email - Subject - Configure the email alert subject
- Alerts - Email - Body - Configure the email alert body
- Hot Keys Map - Allows the user to reassign the hot-keys
- “C” Clears all Blahtech indicator graphics from the chart. Pressing “C” again brings them back
- “R” Resets the indicator. (Backtest mode and any hot-key values are reset)
- Hot Keys Reserved Keys - Define a list of keys that will stop clashes with hotkeys from other products
- Shift (chart timeframe) - Offset all timeframes displayed on chart by a number of bars (current timeframe)
- Show Buffers In Data Window - Show or Hide the iCustom Buffers in the Data window
Developers - iCustom buffers
- Moving Average - Timeframe 1
- Moving Average - Timeframe 2
- Moving Average - Timeframe 3


👍