Rsi Magic kjuta trial
- インディケータ
- Jurii Kuvshinov
- バージョン: 1.1
- アップデート済み: 8 12月 2018
RSI magic kjuta trial is the demo version of RSI magic kjuta.
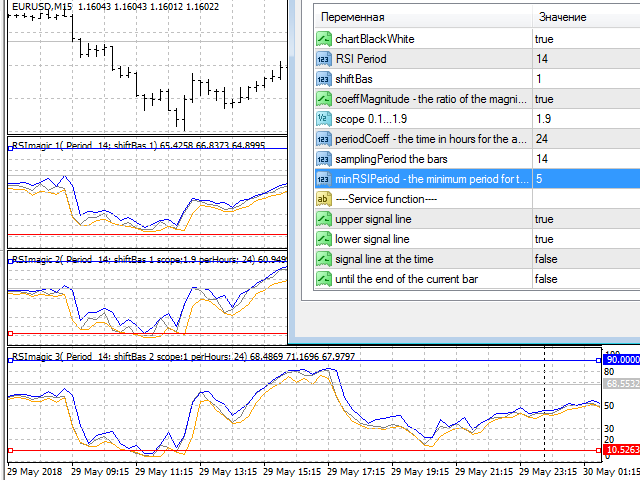
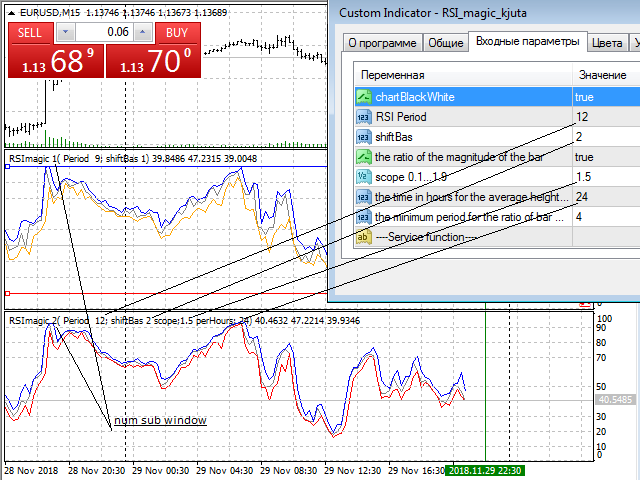
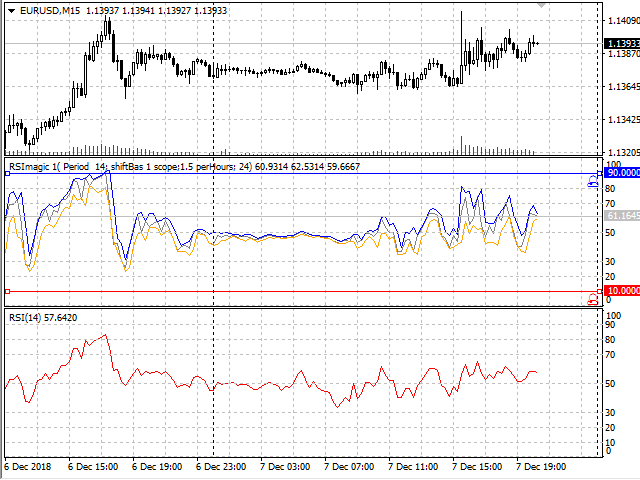
Custom Indicator (RSI magic kjuta) based on the standard (Relative Strength Index, RSI) with additional settings and functions.
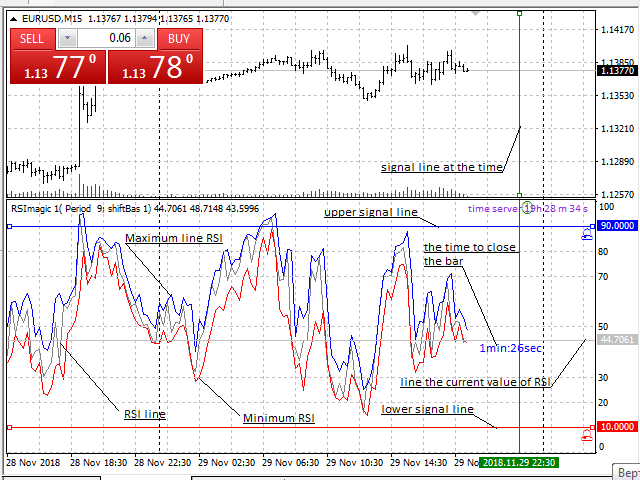
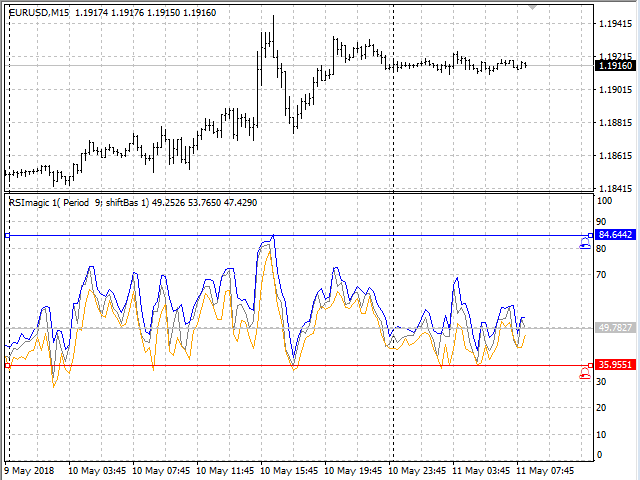
The maximum and minimum RSI lines on the chart have been added to the standard RSI line. Now you can visually observe the past highs and lows of RSI, and not only the values of the closing bars, which avoids confusion in the analysis of trades. For example, the EA opened or closed an order, but the RSI line does not reach the trigger value on the chart. This is due to the fact that the RSI value reached this value, but then fell or rose to the level of closing the bar. This is especially evident on the lines of high and low at peak prices, with candles in one bar. Orientation to the value of these lines allows you to more realistically set the trigger levels or conduct manual trading.
Added setting of the shear bar (shiftBas). The value of positive and negative price changes is taken not only from the previous closing value as in the standard RSI, but by the set value, which leads to a shift in the RSI swing levels at small values. For large values of the shear bar (shiftBas) and you need to do is probably to set the values of TP and Lots. When setting, the value (shiftBas) should not be greater than the period value. Recommended period 14.
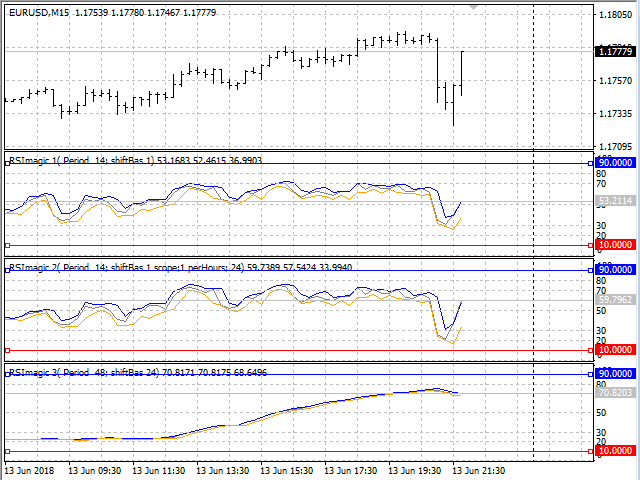
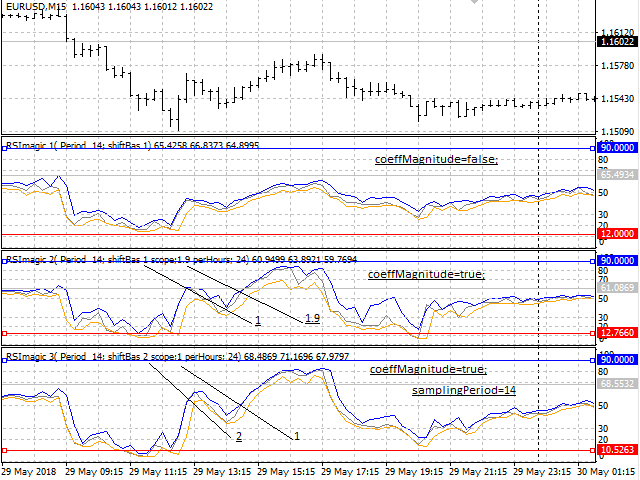
The RSI swing ratio function from the average bar value (coeffMagnitude) allows you to automatically reduce the swing at small bar sizes (for example, when volatility decreases in the Asian session or between sessions) and increase the swing at high bars. Period (periodCoeff) default day (24 hours). The sampling Period value (sampling period) is set in bars. The increase in the range (scope) is the value of the degree of the difference between the average value for (periodCoeff) and (sampling period),” (sampling period/ periodCoeff)^ (scope)”. On the more chart timeframes M30 function (coeffMagnitude) to include not recommended.
The value of the minimum period RSI (minRSIPeriod) ј limits the scope to the values for this period (for example, when (minRSIPeriod= InpRSIPeriod)- will decrease the scope only at low volatility).
To select the desired settings, it is best to load several indicators with the Service functions turned off and different input parameters on the chart, save them to the template and load this template after the strategy tester is launched. This will help you to quickly select the optimal indicator parameters for you.
Service function.
These are signal lines, when reaching the RSI or time values, an audible signal is heard and the time to the end of the bar and the server time. Included in the input parameters. Variable (chartBlackWhite) includes the previous color scheme of the chart.
Successful trading.

Good job, Thanks for sharing