RVI Sniper Alert
- インディケータ
- Yaroslav Varankin
- バージョン: 1.0
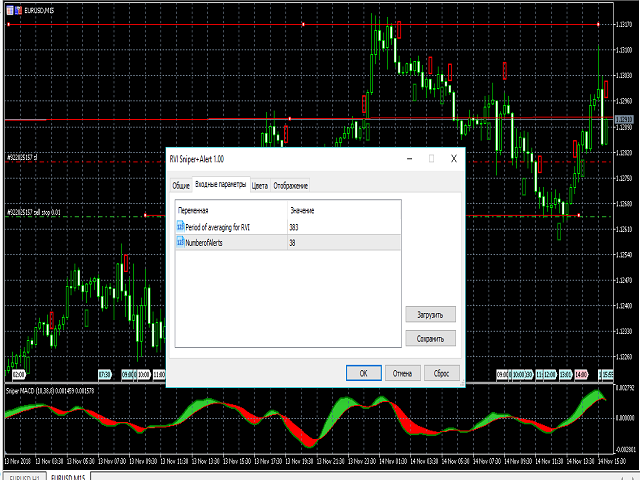
- これが究極のRVIインジケータです。
- 警告矢印を追加
- 潜在的な抵抗レベルを特定することができます
- 読み値を改善するための2つの追加フィルタ
- それはさらに良好な結果を示すために平滑化される
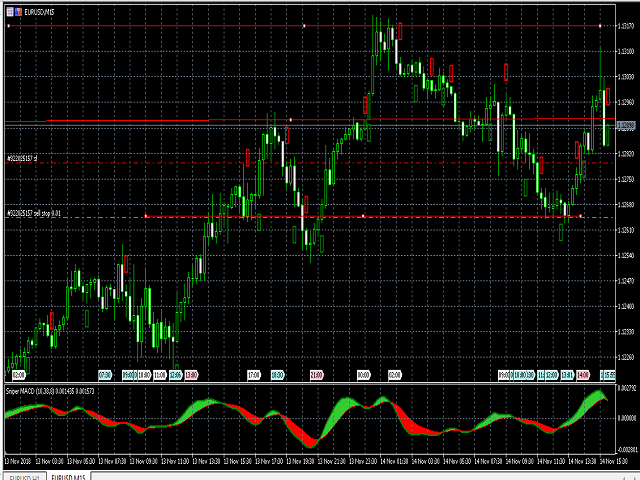
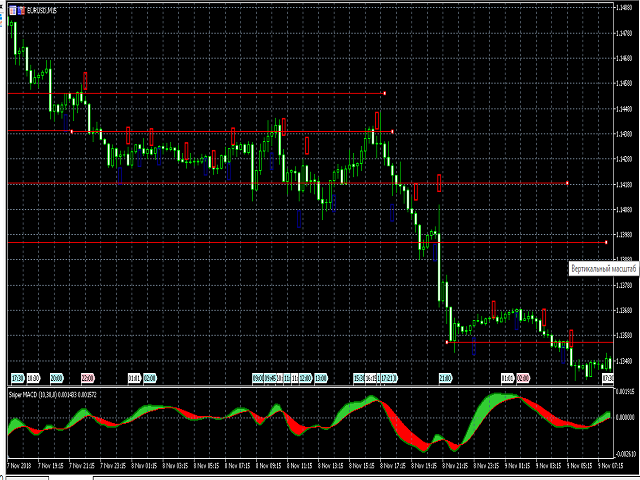
- m1からm30までの短い時間枠で構成されていました
- ひどく悪くはありません
- スクリーンショットmacdのように、このインジケータを追加のフィルタとともに使用することをお勧めします
- これが究極のRVIインジケータです。
- 警告矢印を追加
- 潜在的な抵抗レベルを特定することができます
- 読み値を改善するための2つの追加フィルタ
- それはさらに良好な結果を示すために平滑化される
- m1からm30までの短い時間枠で構成されていました
- ひどく悪くはありません
- スクリーンショットmacdのように、このインジケータを追加のフィルタとともに使用することをお勧めします

Excelente indicador, thanks so mucho.