TeaCii Trend for Range and Break Out
- インディケータ
- Tarun Chaudhry
- バージョン: 1.4
- アップデート済み: 14 1月 2019
- アクティベーション: 5
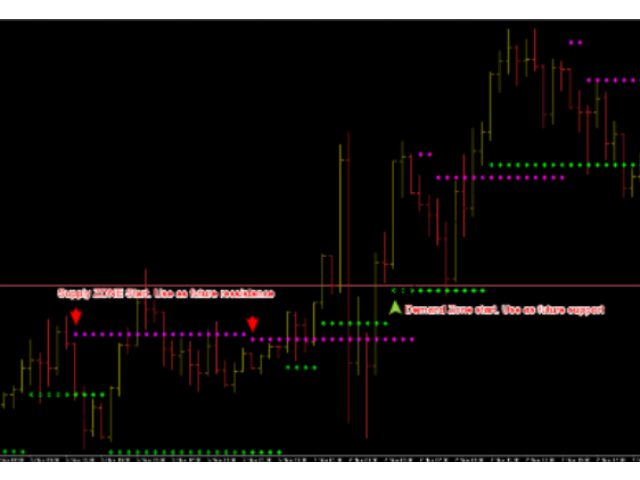
TeaCii trend is a LEADING NON-LAG indicator to trade Ranged Markets or Breakouts.
The indicator marks support and resistance at the moment they are formed.
It has only one setting for the ATR. We recommend leaving default.
This is not an indicator that draws lines from the highs or lows and regards them as SR. It creates actual SR levels way before the market even shows the level as SR.
Often 5 to 10 candles before the naked eye can see it. Look at the first dot and know that SR was declared there. There is NO REPAINTING
The longer the SR line, the stronger that level will be.
IMPORTANT: UNIQUE SELLING POINTS
- This is a leading indicator.
- Support and Resistance when they form and not delayed.
- The length of Support/Resistance shows the strength.
- An indicator line helps to visualize entries and exits.
- Works on all instruments and all time zones.
- Clear and recent support and resistance.
- Clear Visible Range areas.
- Ranged areas very tight.
- Does not repaint after candle is complete. Since this is real-time leading indicator, you may see the decisions change during formation of candle.
TRADE RANGED MARKET
+--- Buy Example
Entry
- Enter trade at the first appearance of support.
- Reenter close to support if new resistance was not clearly broken.
Stop Loss
- about 1 pip below the support
Take Profit
- When you reach a the previous resistance which is higher than support
- Appearance of new resistance
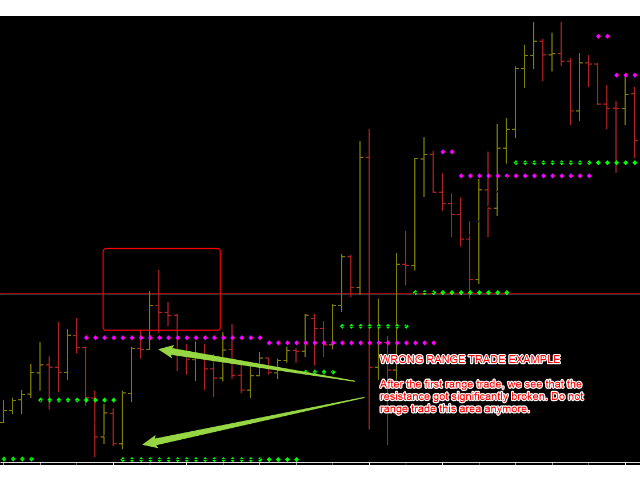
Remark
Do not re-trade range when the price significantly breaks resistance.
+---
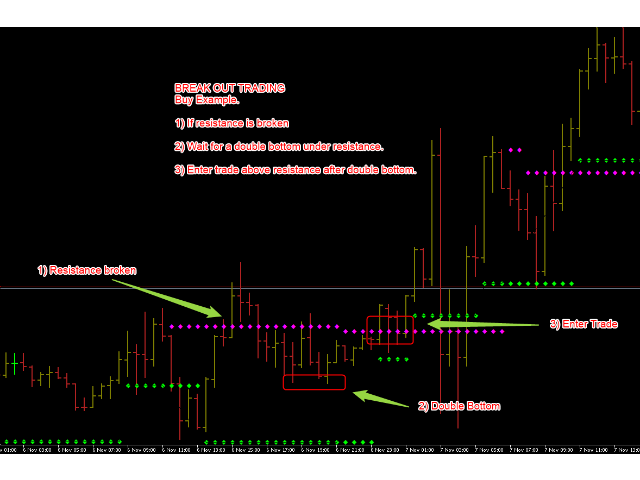
TRADE BREAK OUT
+--- Buy Example
Entry
The entry requires 3 steps
1) Initial resistance break and then retrace below resistance.
2) Formation of double bottom in ranged area.
3) Price moves above resistance.
Stop Loss
- 10 points below double bottom
- last support
Take Profit
- Appearance of new resistance
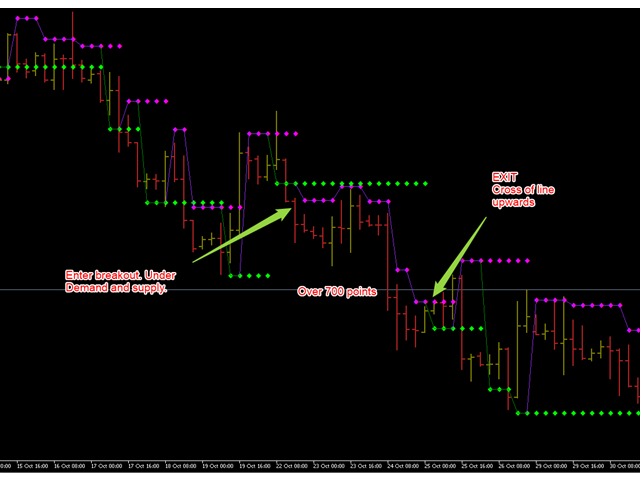
Remark
We cannot re-trade break outs. However look out to range trade the retrace.
+---
These are just two ways of trading with the indicator. You may find many more.