KT Momentum Arrows MT5
- インディケータ
- KEENBASE SOFTWARE SOLUTIONS
- バージョン: 3.0
- アップデート済み: 19 7月 2022
- アクティベーション: 10
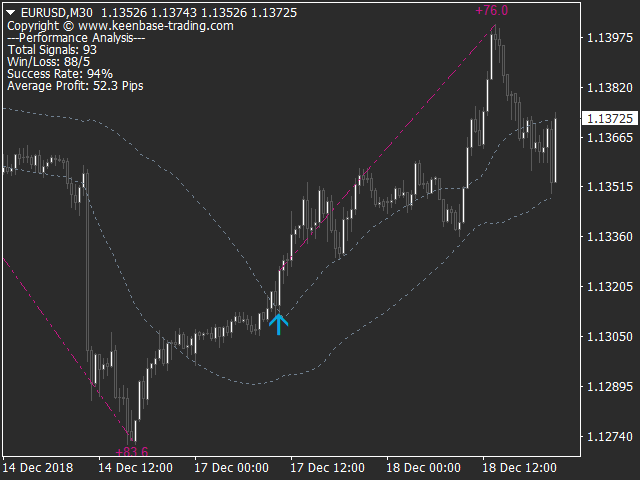
KT Momentum Arrows インジケーターは、一方向への急激なボラティリティとバンドの乖離に基づいて計算される、瞬間的なブレイクアウトを検出するツールです。動きの強さとタイミングを捉えることに特化しており、モメンタムトレードに最適です。
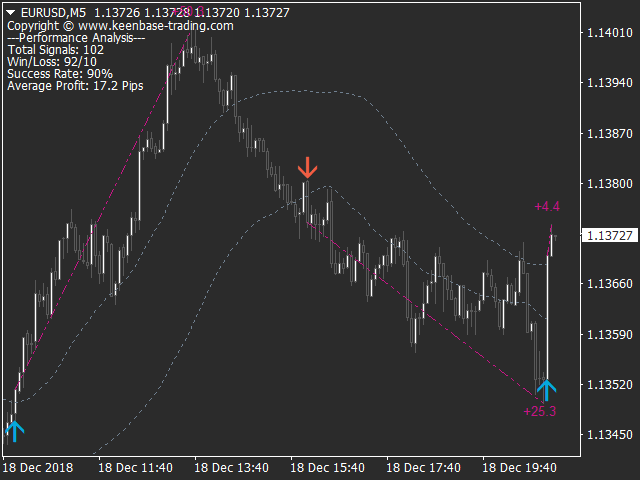
価格が上部バンドを上抜けして終値が確定したときに買いシグナルが、下部バンドを下抜けしたときに売りシグナルが発生します。
バンドの広がりとボラティリティの両方に影響を与える「係数(Magnitude Coefficient)」が入力として用いられます。通貨ペアや時間軸に応じて最適な値を選定し、分析することが推奨されます。
主な特徴
- リペイントなし!
- モメンタムトレーダーにとって優れたエントリーツール。
- 勝率、平均利益、勝ち/負けなどのパフォーマンス分析機能付き。
- デイトレード、スイングトレード、スキャルピングに対応。
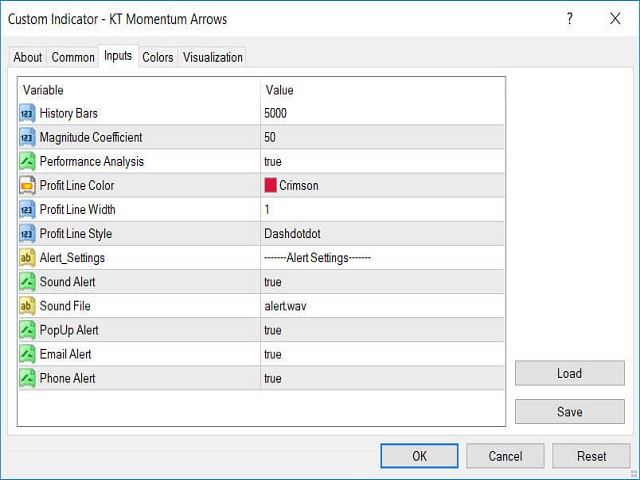
入力パラメーター
- 履歴バー数: インジケーター計算に使用するローソク足の数。
- マグニチュード係数: バンドの拡張とボラティリティ計測に使う単一の係数。
- パフォーマンス分析: 利益傾向のラインを含む分析を表示/非表示に切り替え可能。
- アラート設定: ポップアップ、メール、プッシュ通知、サウンドに対応。
- その他のパラメーターは直感的に設定可能です。


Best indicator I've ever bought.
Also, the author is very involved.