Absolute currency strength for MT5
- インディケータ
- Radim Kucera
- バージョン: 1.0
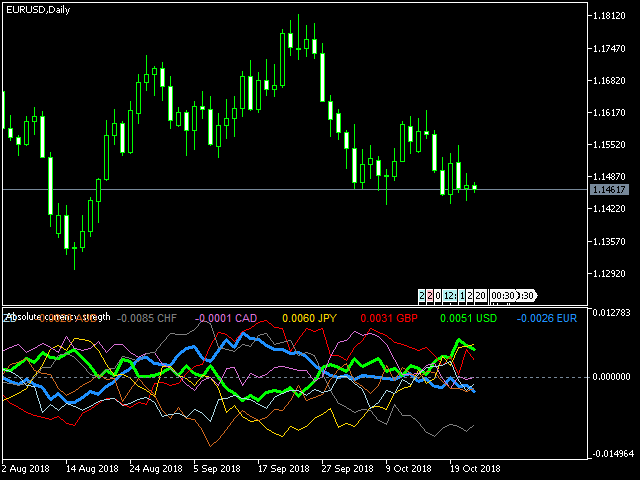
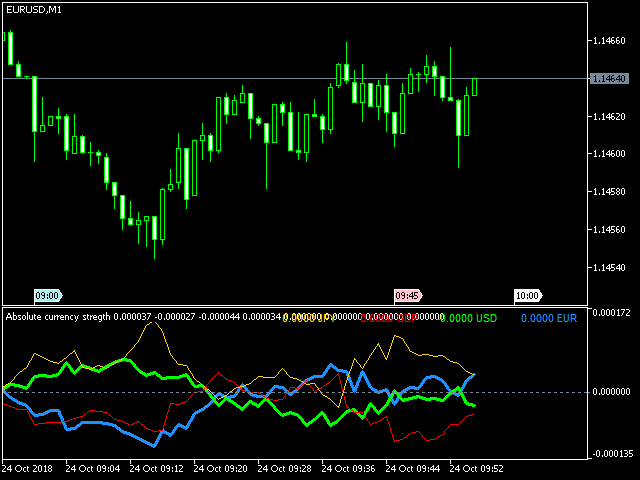
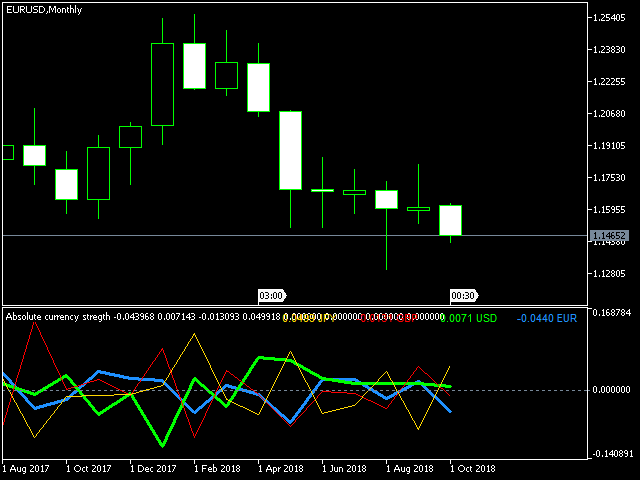
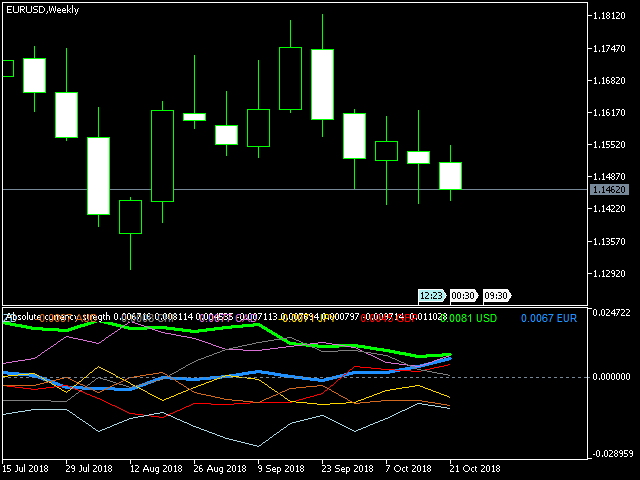
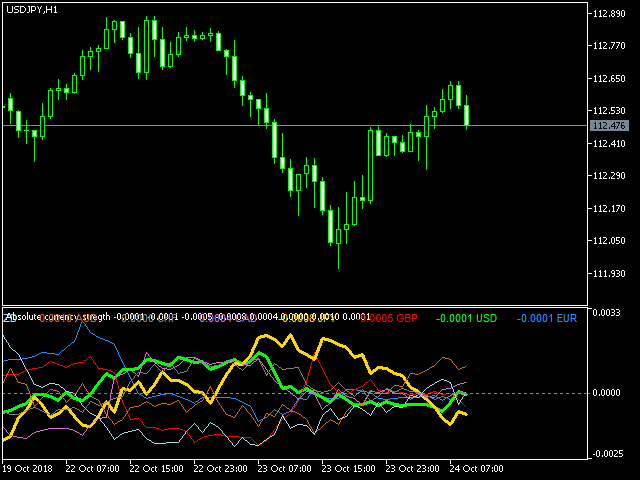
Indicator measures strength of each currency in your list.
Main idea:
It simply iterates through all combinations of pairs and adds difference between open and close in percent.
Parameters:
- List of currencies - what currencies will be calculated (maximum is 8)
- Calculation type - from which data will be strength calculated
- Calculation data input - used as input related to calculation type
- Symbol suffix - used in case of suffix on symbols, e.g: when your symbols look like EURUSDm, EURUSDmicro etc. (suffix is "m", "micro")
Calculation type:
From which source are open and close prices taken.
- RAW - raw data
- MA - simple moving average with period taken from "Calculation data"


.