Fibonacci Expansion and Retracement Pro
- インディケータ
- Jianyuan Huang
- バージョン: 2.3
- アップデート済み: 23 11月 2022
- アクティベーション: 10
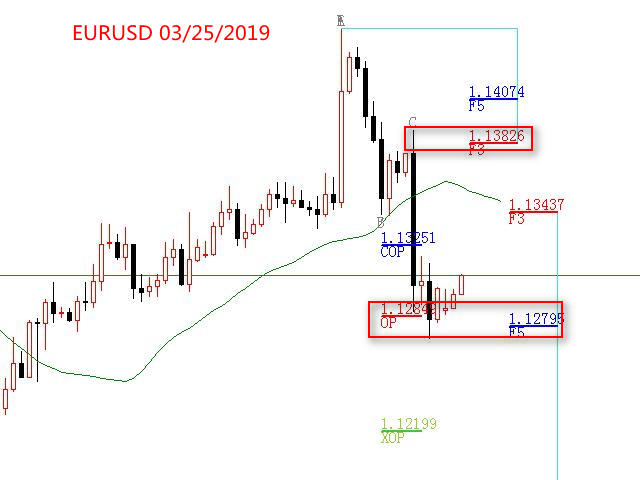
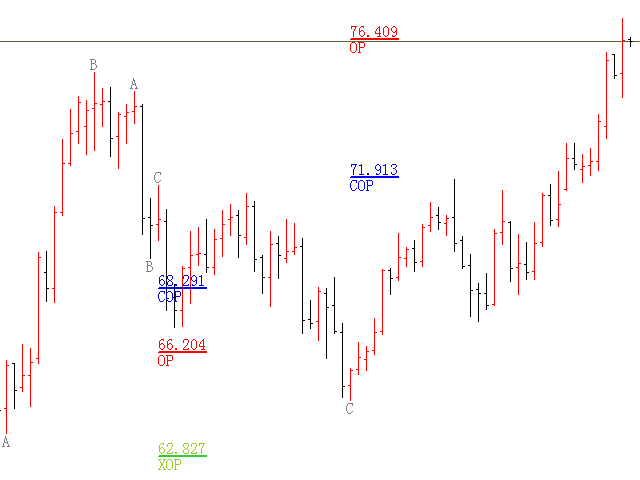
フィボナッチリトレースと拡張ラインツール
DiNapoliポイント取引方法とゴールデンセクション取引を使用するトレーダーにとって理想的なMT4プラットフォームのフィボナッチリトレースと拡張ラインツール
主な特長:
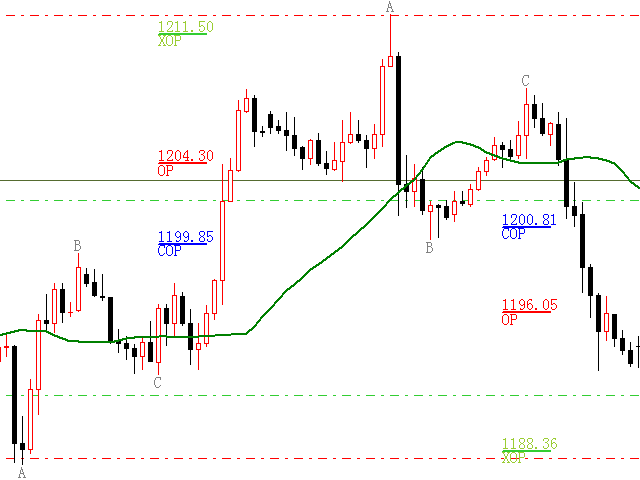
あなたはフィボナッチリトレースメントの複数のセットを直接描くことができ、重要なリターンポイント間の関係は一目瞭然です。
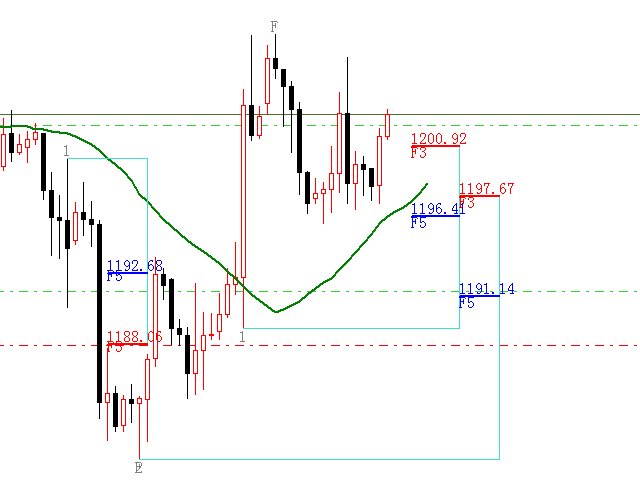
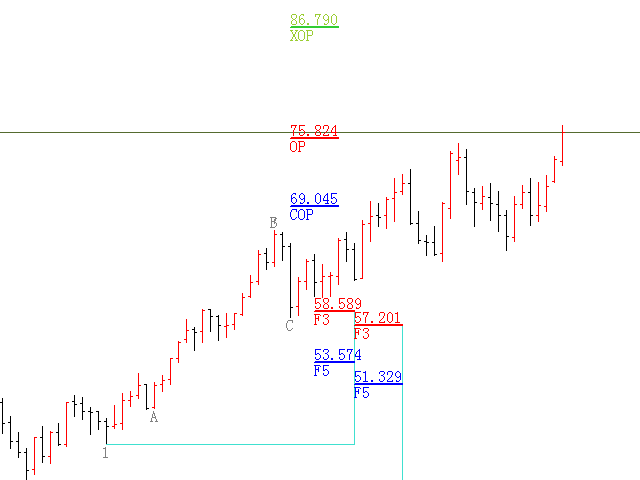
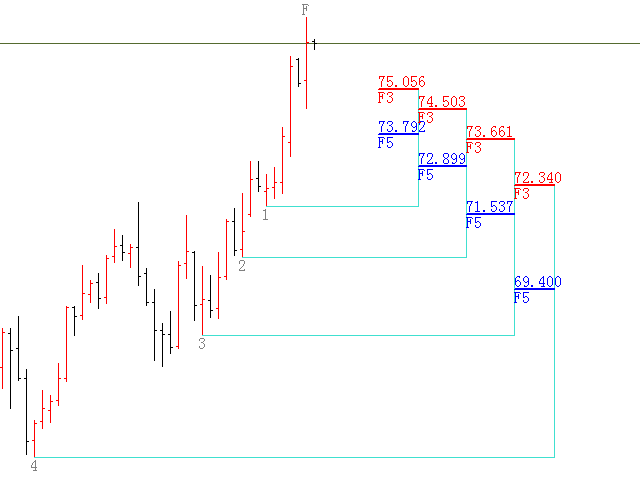
2.フィボナッチ拡張を描画することができます。
3.フィボナッチフォールドバックとラインの延長は、簡単な観察と数値表示のために左右に動かすことができます。
4.チャートは非常に爽やかな
5.数字キーでサイクルを切り替えることができます。
ファンクションキー:
1。 [戻るを押す、要求に応じて描画する、最大8つのグループにする
2。拡張]を描くには[押す]
3。 \を押すと、現在のサイクルの下にあるすべての拡張機能と折り畳みが削除されます
4。フォールドバックを移動して削除して展開する
(1)最初のフォールドバックセットのF5行をクリックします。
一度クリックすると(黄色に変わります)、キーボードのDeleteキーを押すと、フォーカスのフォーカスが削除されます。
適切な位置に戻るには、2回クリック(色を復元)してください。
(2)COPの行をクリックする
一度クリックすると(黄色に変わります)、キーボードのDELETEを押してグループを元に戻します
適切な場所に移動するには、2回クリック(色を復元)します。
5。フォールドバックと拡張機能を変更する:
(1)フォーカスFまたはリバウンドポイント番号(Fまたはリバウンドポイントフォントが大きくなると黄色に変わります)を選択し、マウスを動かします。
(2)3つのABCポイントのいずれかを選択し(フォントが大きくなり黄色に変わります)、マウスを動かします。
関連ビデオを見るための使い方