MESA Cycles
- インディケータ
- Christopher Kryza
- バージョン: 1.5
- アップデート済み: 5 12月 2018
- アクティベーション: 5
Version 1.05 - added option to use mouse to set the Data Offset (anchor). Just hold down your SHIFT key, then double-click anywhere on the chart, then release the SHIFT key and the anchor will be set to the bar nearest to your double-click.
Version 1.04 - added fix for demo mode (i.e., operation in Strategy Tester). Use Open Prices Only and check Use Date (select a date range)
The MESA Cycles indicator calculates the power spectrum of a data series using the Maximum Entropy Spectrum Estimation method and produces a plot of the strongest cycles in the correct phase and relative amplitude. These cycles are then extended into the future by a user-defined number of bars. The Maximum Entropy algorithm, unlike a simple FFT transform, will include frequencies from the entire complex frequency plane and not just the Nyquist interval which, in general terms, means that it can resolve cycle periods that are larger than the data window passed to the function. In addition, MESA has the ability to fit very sharp spectral features which are often missed by other analysis methods.
Prior to being passed to the MESA algorithm, the log of the price data is detrended using a least means squared filter.
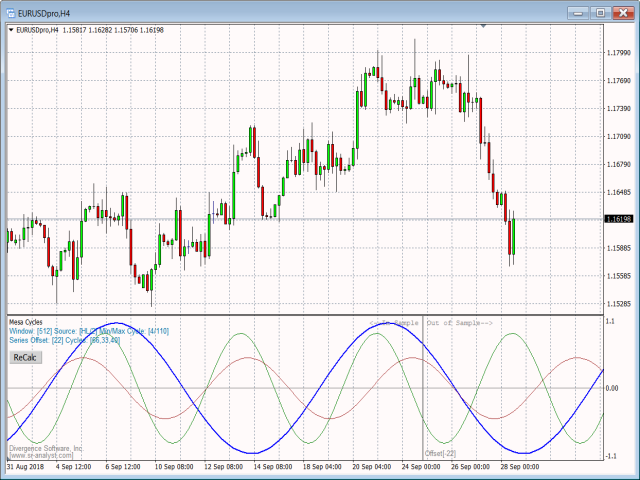
The MESA Cycles tool is extremely useful for identifying cycles in the price data that may continue for some time into the future. The recommended approach is to set the Offset just past a recent swing high or swing low. Then compare the plotted cycles AFTER the offset with what actually occurred in the price action, and look for any cycle that tracks very closely with the price action in this out-of-sample period. Only price data to the left of your Offset will be used for cycle analysis purposes. Everything to the right of the Offset is out-of-sample and is not seen or used by the cycle analysis routines.
See the EURAUD H4 snapshot below for an example. Here we set the Offset/anchor to a swing high 77 bars back in time. In the out-of-sample period we see that the green cycle (36 period) very closely tracks the price action and, therefore, would be a good cycle to monitor going forward to forecast upcoming swings. As each new swing completes, we would repeat the process and run tests by setting the Offset to a recent swing high or swing low, and keeping the Offset that provides us with good out-of-sample performance for one or more cycles. Typically you will want to set the Offset just past one of the 3 most recent swing highs/swing lows. Going back further than 3 swings is not recommended unless the swings are very short.
Keep in mind that, in many cases, the dominant cycle may not necessarily be the most useful cycle to use for forecasting purposes.
The MESA Cycles indicator is a companion indicator to our MESA Spectrum indicator, which is also available in the MQL Marketplace.
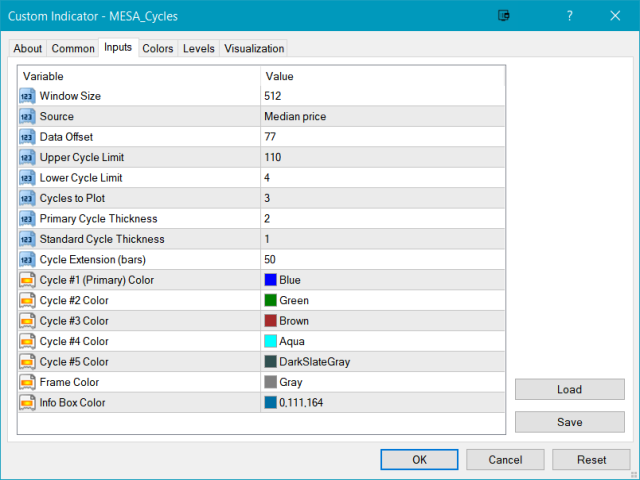
Options:
| Menu Option | Description |
|---|---|
| Window Size | Select from 1024, 512, 256, or 128. Generally the 512 or 256 window size is recommended. The default is 512. |
| Source | Select the price input source. The default is Median Price. |
| Data Offset | Set the offset into the price series. The default is 1 (bar). |
| Upper Cycle Limit | Select the largest acceptable cycle length. The default is 110. Range is 1-512. |
| Lower Cycle Limit | Select the smallest acceptable cycle length. The default is 4. Range is 1-512. |
| Cycles to Plot | Set the total number of cycles to plot. Range is from 1 to 5. Default is 3. |
| Primary Cycle Thickness | Set the line thickness for the primary cycle plot. Range is from 1 to 6. Default is 2. |
| Standard Cycle Thickness | Set the line thickness for all other cycle plots. Range is from 1 to 6. Default is 1. |
| Cycle Extension | Set the number of bars into the future each cycle plot should be extended. Default is 20 bars. |
| Cycle #1 (Primary) Color | Set the color for the primary (dominant) cycle plot. |
| Cycle #2 Color | Set the color for the 2nd cycle plot. |
| Cycle #3 Color | Set the color for the 3rd cycle plot. |
| Cycle #4 Color | Set the color for the 4th cycle plot. |
| Cycle #5 Color | Set the color for the 5th cycle plot. |
| Frame Color | Set the color for the frame lines and text. |
| Info Box Color | Set the color for the information box displayed below the title. |
