Murray Math Levels several oktavs
- インディケータ
- Vladyslav Goshkov
- バージョン: 1.1
- アップデート済み: 3 2月 2022
- アクティベーション: 5
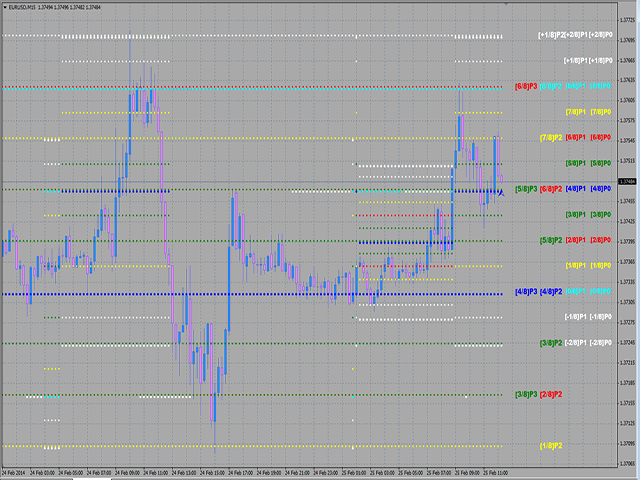
This indicator calculates and displays Murrey Math Lines on the chart.
The differences from the free version:
It allows you to plot up to 4 octaves, inclusive (this restriction has to do with the limit imposed on the number of indicator buffers in МТ4), using data from different time frames, which enables you to assess the correlation between trends and investment horizons of different lengths.
It produces the results on historical data. A publicly available free version with modifications introduced by different authors, draws the results on history as calculated on the current bar, which prevents it from being used for accurate analysis of the price movement in the past and complicates determination of the possible direction of the price at the current price range. There are versions that show values based on history but I don't know how accurate they are.
The calculated values can be obtained from indicator buffers using the iCustom() function:
- indicator line with 0 index contains line 4/8 of the octave set by the Р0 variable value selected on a time frame set by the BaseTF_P0 variable with the selection criterion specified by the BaseMGTD_P0 variable.
Obtaining the value of this level on the zero bar: double p0_4_8 = iCustom(NULL,0,"ivgMMLevls",..list of parameters..,0,0);
On the previous bar (number N): double p0_4_8_prev = iCustom(NULL,0,"ivgMMLevls",..list of parameters..,0,N); - indicator line with index 1 contains the grid step of the same octave.
Obtaining the value of this level on the zero bar: double p0_step = iCustom("ivgMMLevls",..list of parameters..,1,0);
On the previous bar (number N): double p0_step_prev = iCustom("ivgMMLevls",..list of parameters..,1,N);
A similar approach is used to access data of the other octaves:
- indicator line with index 2 - line 4/8, for octave Р1
- indicator line with index 3 - grid step, for octave Р1
- indicator line with index 4 - line 4/8, for octave Р2
- indicator line with index 5 - grid step, for octave Р2
- indicator line with index 6 - line 4/8, for octave Р3
- indicator line with index 7 - grid step, for octave Р3
This is for those who want to use these levels in Expert Advisors.
An example of the script that obtains data for octave Р0 on the zero bar:
input string s0="Latest Bar Number to calculate >= 0 ";
input int StepBack = 0;
input string s01="Culc Oktavs Count - max 4";
input int _pCNT =  4;
input string s1="History Bars Count";
input int BarsCNT =  150;
input string s2 = "Parameters group for configuring";
input string s20 = "Murray Math Diapazone new search algorithm";
input string s21 = "!!! If you are unsure, do not change these settings !";
input int P0 =    8;
input int P1 =   16;
input int P2 =   32;
input int P3 =  128;
input int BaseTF_P0    = 60;
input int BaseTF_P1    = 60;
input int BaseTF_P2    = 60;
input int BaseTF_P3    = 60;
input int BaseMGTD_P0 =  1;
input int BaseMGTD_P1 =  1;
input int BaseMGTD_P2 =  1;
input int BaseMGTD_P3 =  1;
input string s22 = "**** End Of Parameters group for configuring *** ";
input string s3 = "Line Colors adjustment";
input color  mml_clr_m_2_8 = White;       // [-2]/8
input color  mml_clr_m_1_8 = White;       // [-1]/8
input color  mml_clr_0_8   = Aqua;        //  [0]/8
input color  mml_clr_1_8   = Yellow;      //  [1]/8
input color  mml_clr_2_8   = Red;         //  [2]/8
input color  mml_clr_3_8   = Green;       //  [3]/8
input color  mml_clr_4_8   = Blue;        //  [4]/8
input color  mml_clr_5_8   = Green;       //  [5]/8
input color  mml_clr_6_8   = Red;         //  [6]/8
input color  mml_clr_7_8   = Yellow;      //  [7]/8
input color  mml_clr_8_8   = Aqua;        //  [8]/8
input color  mml_clr_p_1_8 = White;       // [+1]/8
input color  mml_clr_p_2_8 = White;       // [+2]/8
input string s4 = "Line thickness adjustment";
input int    mml_wdth_m_2_8 = 2;        // [-2]/8
input int    mml_wdth_m_1_8 = 1;        // [-1]/8
input int    mml_wdth_0_8   = 2;        //  [0]/8
input int    mml_wdth_1_8   = 1;        //  [1]/8
input int    mml_wdth_2_8   = 1;        //  [2]/8
input int    mml_wdth_3_8   = 1;        //  [3]/8
input int    mml_wdth_4_8   = 2;        //  [4]/8
input int    mml_wdth_5_8   = 1;        //  [5]/8
input int    mml_wdth_6_8   = 1;        //  [6]/8
input int    mml_wdth_7_8   = 1;        //  [7]/8
input int    mml_wdth_8_8   = 2;        //  [8]/8
input int    mml_wdth_p_1_8 = 1;        // [+1]/8
input int    mml_wdth_p_2_8 = 2;        // [+2]/8
input string s5 = "Font adjustment";
input int    dT = 7;
input int    fntSize  =  7;
input string s6 = "Latest Bar Marker adjustment";
input color  MarkColor   = Blue;
input int    MarkNumber  = 217;

int start()
{
    double p0_4_8 = iCustom(NULL,0,"ivgMMLevls",
    s0,StepBack,s01,_pCNT,s1,BarsCNT,
    s2,s20,s21,P0,P1,P2,P3,BaseTF_P0,BaseTF_P1,BaseTF_P2,BaseTF_P3,
    BaseMGTD_P0,BaseMGTD_P1,BaseMGTD_P2,BaseMGTD_P3,s22,
    s3,
    mml_clr_m_2_8,mml_clr_m_1_8,mml_clr_0_8,mml_clr_1_8,mml_clr_2_8,mml_clr_3_8,
    mml_clr_4_8,
    mml_clr_5_8,mml_clr_6_8,mml_clr_7_8,mml_clr_8_8,mml_clr_p_1_8,mml_clr_p_2_8,
    s4,
    mml_wdth_m_2_8,mml_wdth_m_1_8,mml_wdth_0_8,mml_wdth_1_8,mml_wdth_2_8,mml_wdth_3_8,
    mml_wdth_4_8,
    mml_wdth_5_8,mml_wdth_6_8,mml_wdth_7_8,mml_wdth_8_8,mml_wdth_p_1_8,mml_wdth_p_2_8,
    s5,dT,fntSize,s6,MarkColor,MarkNumber,
    0,0);
    double p0_step = iCustom(NULL,0,"ivgMMLevls",
    s0,StepBack,s01,_pCNT,s1,BarsCNT,
    s2,s20,s21,P0,P1,P2,P3,BaseTF_P0,BaseTF_P1,BaseTF_P2,BaseTF_P3,
    BaseMGTD_P0,BaseMGTD_P1,BaseMGTD_P2,BaseMGTD_P3,s22,
    s3,
    mml_clr_m_2_8,mml_clr_m_1_8,mml_clr_0_8,mml_clr_1_8,mml_clr_2_8,mml_clr_3_8,
    mml_clr_4_8,
    mml_clr_5_8,mml_clr_6_8,mml_clr_7_8,mml_clr_8_8,mml_clr_p_1_8,mml_clr_p_2_8,
    s4,
    mml_wdth_m_2_8,mml_wdth_m_1_8,mml_wdth_0_8,mml_wdth_1_8,mml_wdth_2_8,mml_wdth_3_8,
    mml_wdth_4_8,
    mml_wdth_5_8,mml_wdth_6_8,mml_wdth_7_8,mml_wdth_8_8,mml_wdth_p_1_8,mml_wdth_p_2_8,
    s5,dT,fntSize,s6,MarkColor,MarkNumber,
    1,0);
    Print("p0_4_8 = ",DoubleToStr(p0_4_8)," | p0_step = ",DoubleToStr(p0_step));
    return(0);
}
To simplify the operation of the indicator, the number of bars of history is limited - the BarsCNT parameter.
To analyze the behavior of the indicator over the history in the manual mode, there is a shift parameter StepBack, which allows you to draw the specified number of indicator values not only from the current bar (with 0 number).
Attention! This version of the indicator features an improved selection of ranges for plotting octaves.
By default, the indicator is set with minimal differences from the basic calculation algorithm for intraday trading with lines drawn over the hourly range, which allows you to properly use it for all intrahourly ranges. If it is necessary to use the indicator on senior time frames, the current chart time frame will be selected automatically. Alternatively, you can manually set the desired time frame, being higher than the current chart time frame.
Please modify the default parameters only if you know exactly what you are doing. The default parameters should be optimal for most trading strategies.