Pivots Dashboard Scanner
- インディケータ
- Benedict Jamora
- バージョン: 1.0
- アクティベーション: 10
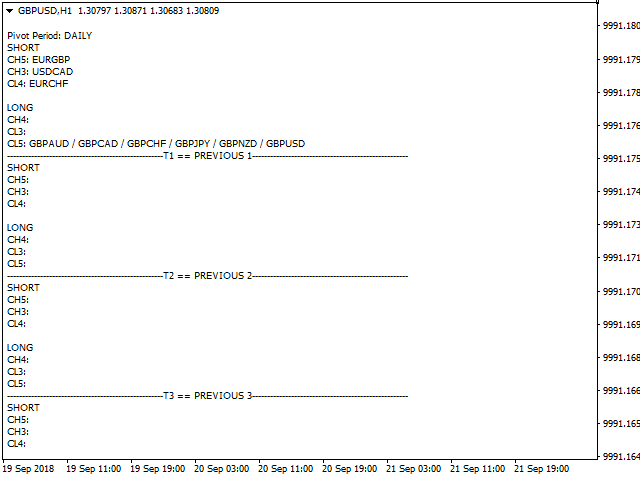
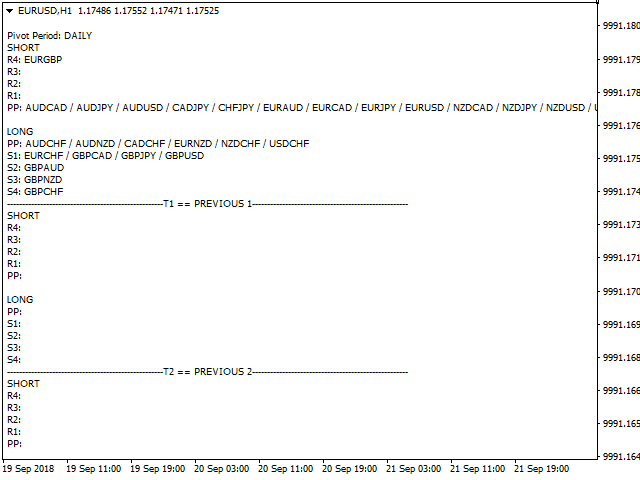
This indicator scans and displays where the currency pairs currently are in reference to Pivot Levels. You have the option to choose between Daily, Weekly, Monthly, Quarterly, and Yearly pivots. Standard Pivot Levels and Camarilla Pivot Levels formulas came from the book Secrets of a Pivot Boss: Revealing Proven Methods for Profiting in the Market by Frank O. Ochoa. It also includes all types of alert options.
Features
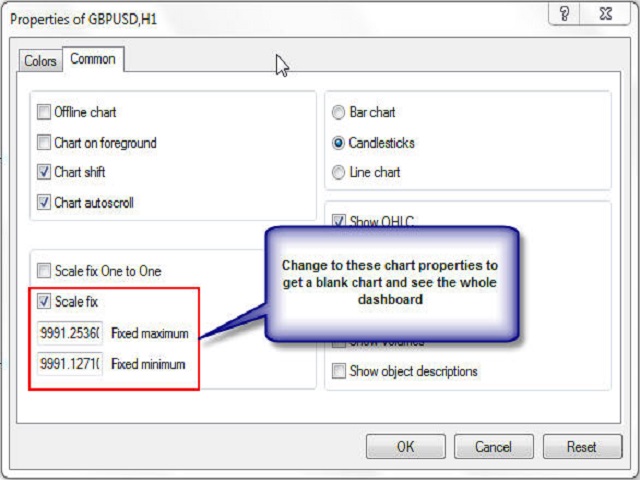
- Attach to one chart and scans all the currency pairs configured and visible in the Market Watch Window
- It can monitor all the available timeframes from M1 to MN1 and sends alerts on every timeframe's candle close to update on the current Pivot Level location of the currency pairs configured
- Display configured currency pairs and on what Pivot Level they currently are
- Support for Daily, Weekly, Monthly, Quarterly, and Yearly Pivots
- Support for Camarilla Pivots as described in Franklin O. Ochoa's book Secrets of a Pivot Boss: Revealing Proven Methods for Profiting in the Market
- Support for all types of notifications
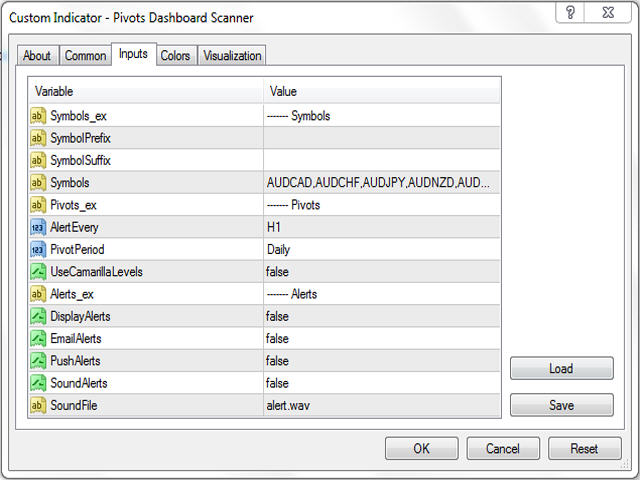
Parameters
- SymbolPrefix: If broker has prefix for its currency pairs, you can put it here
- SymbolSuffix: If broker has suffix for its currency pairs, you can put it here
- Symbols: All symbols (comma separated) that you want the scanner to monitor. Make sure that all the symbols that you want to be monitored is also present in the Market Watch Window
- AlertEvery: Frequency of alerts and when you want the dashboard to update
- Pivot Period: Period of the Pivots you want the dashboard to monitor
- UseCamarillaLevels: Display and monitor Camarilla Pivots instead of the Standard Pivots
- DisplayAlerts: Display pop-up alerts
- EmailAlerts: Send email alerts
- PushAlerts: Send push alerts
- SoundAlerts: Enable sound alerts
- SoundFile: Sound file that will be used by SoundAlert