T3IndiSlow
- インディケータ
- Ridwan Kureemun
- バージョン: 1.0
Supporting file (1 of 2) for T3 Cloud MA
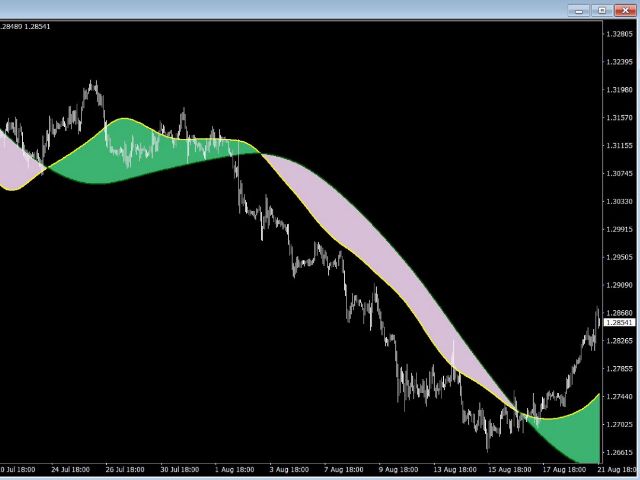
Trend indicator derived from T3 moving averages. The cloud is bounded by a fast T3 and slow T3 lines.
Buying/Selling opportunities above/below cloud. The fast and slow T3 MA lines can also be used as dynamic support/resistance for more aggressive entries.
Use default values for best settings. The number of look back bars is user defined.
This indicator can be used in combination with other strategies such as price action.
Suitable for all time frames.
Prerequisites: T3IndiSlow and T3IndiFast indicators