BidAsk Balance
- インディケータ
- Dmitriy Gurenko
- バージョン: 1.10
- アップデート済み: 31 8月 2018
- アクティベーション: 5
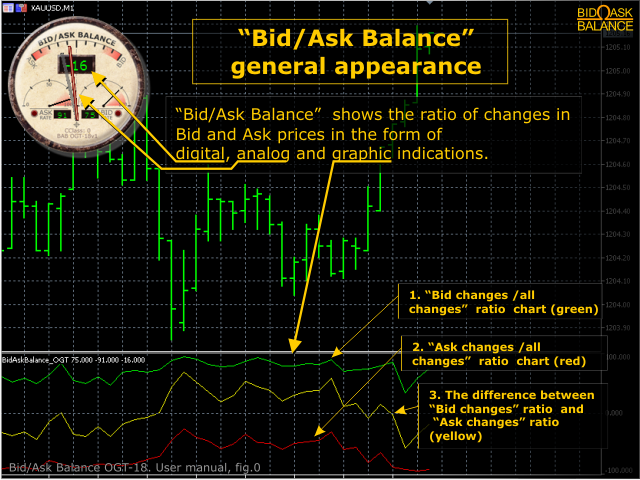
The indicator measures and displays the difference in the number of "Bid" and "Ask" prices changes in the form of digital, analog and graphic indicators.
Designed for market research and for determine the moments of position closing during scalping trade with H1 or less timeframe. Use with bigger timeframe is not prohibited, but it is not informative because of a large number of accumulated values.
Theory
"Bid" and "Ask" prices do not change simultaneously for most symbols. Often you can see how one of the prices is fixed at a certain value, while the second changes with a high frequency, which causes a change in the symbol spread (which, in turn, is associated with a change in the mood of active players of the market). In general, the price behavior is not determined depending on the ratio of the number of changes in Bid and Ask prices (indicator is not predictive), but it is often possible to identify key patterns. For example, a sharp blending of the ratio of price changes towards Ask (a negative value of the indicator (2), a shift of the pointer arrow (1) to the left (see Figure 1.)) with an increasing trend on the symbol "XAUUSD" means a close termination of the trend (as well as the bias towards Bid for a downtrend). In turn, maintaining the ratio of changes approximately equal for several measurement periods indicates that the trend persists regardless of the prevailing magnitude.
Indicator reading
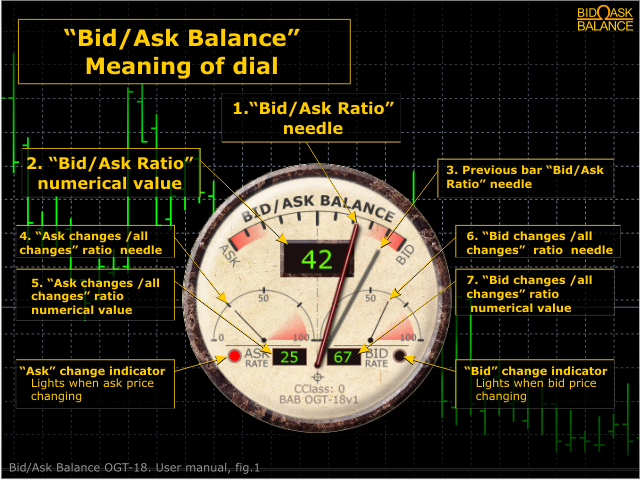
The indicator displays the following values for market analysis:
- The ratio of the number of changes in the "Ask" price to the total number of price changes: readings 4 and 5 (Figure 1) and graph 3 (figure 0)
- The ratio of the number of changes in the "Bid" price to the total number of price changes: readings 6 and 7 (Figure 1) and graph 1 (Figure 0)
- The difference between the "Bid" and "Ask" changes: readings 1 and 2 (Figure 1) and graph 2 (Figure 0)
- The value of the difference in the previous measurement interval: the reading 3 (Figure 1) and visually on the chart
Launching the indicator
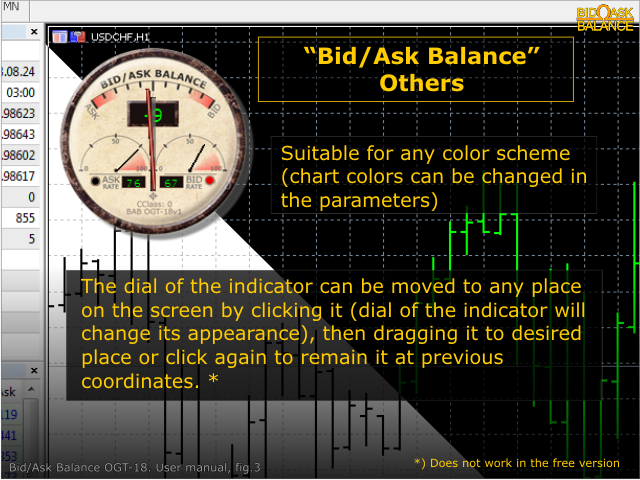
Drag the indicator to the desired chart. When you start, the indicator is displayed in the upper left corner, but you can move it to the desired location by clicking on it with the left mouse button, then moving it to the selected location. The indicator does not use the input parameters. The colors of the charts can be customized in the "Colors" tab of the indicator settings window.
Attention!
The indication of the indicator in the test mode does not make sense because of the synthetic nature of the generated ticks. To check the indicator, use the free version of the indicator: https://www.mql5.com/en/market/product/31264 (there are usage limits).