• 概要
  • レビュー
  • コメント

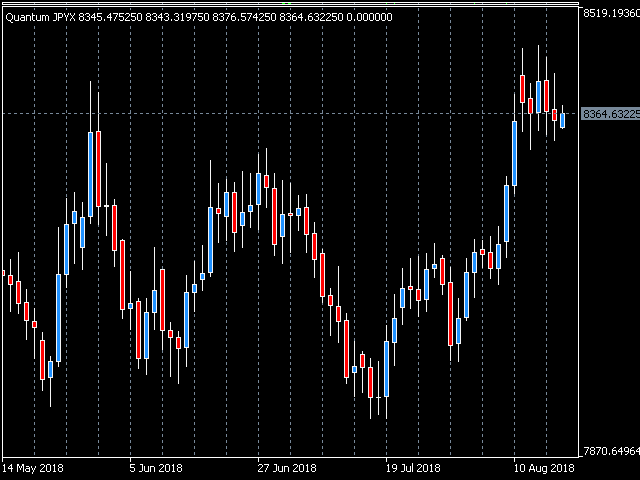
Quantum Japanese Yen Index Indicator for MT5

Many Forex traders have either been told, or have learnt from painful experience, that the Yen currency pairs can be both dangerous and volatile to trade. The GBP/JPY is perhaps the most infamous and volatile of all. No wonder then, that many Forex traders simply stay away from the Yen currency pairs. But then they probably don’t have a very clear idea of where the Yen itself is heading. If they did, then trading the Yen pairs would be much more straightforward.

And this is where the Quantum JPYX indicator steps in. It has been designed to give you the heads up on where the Japanese yen is heading next, against a basket of four currencies. The index is then constructed using an equal weighting of 25% as follows:

  • Euro
  • US Dollar
  • Australian Dollar
  • New Zealand Dollar

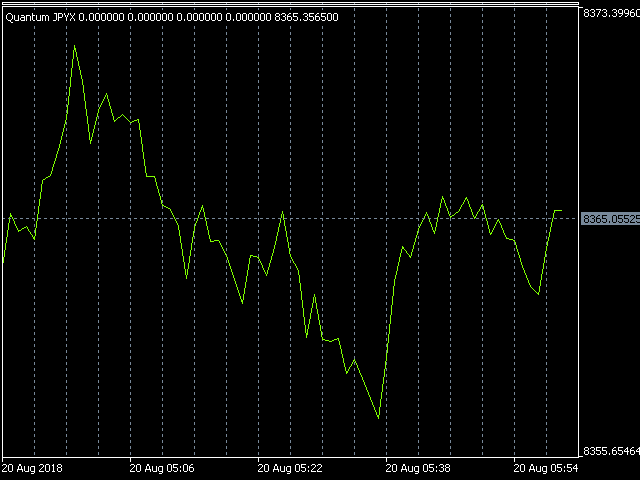
Best of all, you can simply attach it to the bottom of your chart, and never have to leave your MT4 account. The indicator plots strength or weakness in the Yen as a single line, supported by two simple moving averages.

For an even more forensic view of the Yen, why not combine it with the Quantum Currency Strength indicator. Now you can trade the Yen currency pairs with complete confidence, growing your trading account quickly, but with confidence!

おすすめのプロダクト
Knowledge of the strength and weakness of each currency is vital for every forex trader. Our   Currency Strength Meter indicator   measures the strength of eight major currencies (USD, EUR, GBP, CHF, JPY, CAD, AUD, NZD) by using the Relative Strength Index indicator, also known as RSI. The Currency Strength Meter indicator shows you, simply and quickly, when a currency is oversold, overbought, or in "normal area". This way, you can identify which currency is the strongest and the weakest. Our
Just Copier MT5
Agung Imaduddin
4.75 (4)
"Just copier" is designed to copy trading without any complicated settings. The copy can be done in one PC. One EA can be set as master (provider) or slave (receiver). The receiver lot can be set to multiple providers lots. Please also check this product at fxina.hostingerapp.com.  Any type of copy is available. MT4 -> MT5 MT4 -> MT4 MT5 -> MT5 MT5 -> MT4 If you want to copy MT4 -> MT5 or MT5 -> MT4, please purchase "Just copier" for MT4 and "Just copier" for MT5 separately. Just Copier can copy
Best Tested Pairs :-  Step Index (Also can use on other pairs which spread is lowest) How does the Magic Storm work The Magic Storm will commence only if the Initial Trade becomes a losing trade. In case the initial trade is a profitable one, or has been closed by the trader there is no need for the Magic Stormto be initiated. Let’s assume that the initial trade was a 1 lot buy trade with Recovery Zone Range Pips is 50 and Recovery Zone Exit Pips is 150 pips. The take profit fo
Pipfinite creates unique, high quality and affordable trading tools. Our tools may or may not work for you, so we strongly suggest to try the Demo Version for MT4 first. Please test the indicator prior to purchasing to determine if it works for you. We want your good reviews, so hurry up and test it for free...we hope you will find it useful. Combo Razor Scalper with Trend Laser Strategy: Scalp in the direction of the trend Watch Video: (Click Here) Features Scalping indicator using a confir
Before installing the HeatMap indicator make sure you are using a broker that gives you access to the Depth of market (DOM) !! This indicator creates a heatmap on your chart allowing you to see the buy or sell limit orders easily and in real time. You have the possibility to change the setting and the colors of the HeatMap in order to adapt to all markets and all charts. Here is an example of a setting you can use with the NASDAQ100 on the AMPGlobal broker :  https://www.youtube.com/watch?v=x0
Gold Step
Ignacio Agustin Mene Franco
Step Gold. It is an Echo oscillator for trading synthetic and forex indices at a professional level, grasping long trends, whether long or short works for all seasons also for scalping, very good level in the crash and boom pairs, volatility's , jump in forex pairs, eur/usd usd/jpy, gbp/eur, aud/cad and others! when it hits the ceiling it gives a signal to a short when it hits the floor it signals a long! Enjoy it.
Nowadays a lot of traders need to open more positions for the same pair, because one position is not usually the best possible position. Thus a lot of trades are accumulated, sometimes with different lot sizes, and it is not easy to calculate the breakeven price of all opened positions. For solving this issue the Breakeven Price indicator was created. Breakeven Price is an MT5 indicator which calculates real time the breakeven price of all Buy & Sell positions opened by trader or EAs. It shows r
Supply and Demand Monster
Tsog Erdene Borjigon Enkhkhudulmur
Supply and demand zones are at the heart of   supply and demand trading . These zones are areas that show  liquidity at a specific price.  The supply zone is also called the distribution zone, while the demand zone is called the accumulation zone.   Our indicator automatically draw supply and demand zones in Metatrader 5. It give opportunity to understand trading zone and avoiding risk.
Currency Power Meter shows the power of major currencies against each other. The indicator shows the relative strength of currency/pair at the current moment in a period of time (H4, daily, weekly, monthly). It is useful for day traders, swing traders and position traders with suitable period options. Currency power is the true reason of market trend: The strongest currency against the weakest currency will combine into a most trending pair. As we know, trend makes money and all traders love tre
インジケータMTFクリスタリウム矢印は、半自動取引システムであります. これは、すべての通貨ペアで動作します。  インジケータは、三つのルールを使用しています:1)我々は唯一のトレンドで取引、2)"誰もが販売しているときに購入し、誰もが買うときに販売する"、3)価格  インジケータMTF矢印は、内蔵の指標を使用して、複数の時間枠全体のクリスタリウムフィルタルール。 トレンドは、選択した時間間隔で一致した場合、インジケータは、市場に参入するための矢印を与えます。 それからあなた自身の決定をする。 購入する-緑の矢印、売る-赤い矢印。 指標では、ロットを変更したり、EAの取引時間とシャットダウン時間を設定することができます。 また、作業期間と時間フィルタを変更することができます。 ビープ音が鳴ってる  推薦された働く期間D1。 フィルタH1とH4。  設定: TF働く期間(推薦されたD1) Cci_cperiodcomment CCIレベルアップ CCIレベルDn CCI価格 SARステップ SAR最大値 TFのFilter1–(推薦されたH1)
Your Pointer is no ordinary Forex channel. This corridor is built on the basis of the analysis of several candles, starting from the last one, as a result of which the extremes of the studied interval are determined. They are the ones who create the channel lines. Like all channels, it has a middle line as well as a high and low line. This channel is worth watching for its unusual behavior. The use of the Your Pointer indicator allows the trader to react in time to the price going beyond the bo
HAWA GOLD MT5 Advanced trading indicator with realistic pre-defined entry and exit levels with almost 80% win rate.  The system focuses only  Small and Steady Profits . It uses fixed stop loss for every signal to keep money management in place.  As compare to other available indicators in market, HAWA gold has unique feature of displaying total profit and loss in terms of points where 1PIP=10points and Minimum profit is 10 pips. Its smart and advanced algorithm detects trend and trend strengt
MarketSchedule displays market sessions' open/close time for each day through out the week, also broker's timezone. It also supports instruments that have more than 1 session per day (maximum of 2 as most instruments don't have more than this) e.g. crypto market such as BTCUSD which usually has a few hours break mid-day thus it spans into 2 market sessions. You don't have to spend time looking for such information on broker's website. It's an on-demand script that you can drop onto the chart t
Market volume profile indicator.  It works on almost all instruments - currency pairs, stocks, futures, on real volumes and on ticks.  It can be set as automatic determination of the range of building a profile, for example, for a week or a month, etc.  and set the range manually by moving the borders (two vertical lines red and blue).  Shown as a bar graph.  The width of the histogram at a given level means, conventionally, the number of trades made on it.  With the "Mode level line color" para
Multicurrency and multitimeframe modification of the Commodity Channel Index (CCI) indicator. You can specify any desired currencies and timeframes in the parameters. Also, the panel can send notifications when crossing overbought and oversold levels. By clicking on a cell with a period, this symbol and period will be opened. This is MTF Scanner. The key to hide the dashboard from the chart is "D" by default. Parameters CCI Period  — averaging period. CCI Applied price  — price type. Clea
ベータ指数、またはベータインジケーターは、ヘッジ機関の参考指標の一つです。 これは、通貨や商品などの個別資産の相対的なリスクを市場ポートフォリオ、通貨クロス、米ドル指数、株価指数と比較して測定するのに役立ちます。資産が市場基準と比較してどのように動くかを理解することで、投資リスクについてより明確な理解を得ることができます。 主な特徴: 正確なリスク評価:ベータ指数は、資産のリスクを市場全体と比較して正確に評価し、情報を元に投資判断を行うのに役立ちます。 分散戦略:この指数を活用して、さまざまな資産カテゴリーを横断して投資ポートフォリオを最適化し、分散戦略の機会を探ることができます。 マルチ通貨ヘッジに適しています:マルチ通貨ヘッジに参加する投資家は、この指数を重要な参考指標として考慮できます。 リアルタイムの洞察:タイムリーな意思決定のためにリアルタイムのデータ分析を利用できます。 ベータ指数を取引ツールに組み込むことで、データとリスク分析の力を活用できます。より賢明な選択をして、ポートフォリオの無駄なリスクを軽減しましょう。 β = 1:βが1と等しい場合、資産の価格変動は市場全体と
Was: $249  Now: $99   Market Profile defines a number of day types that can help the trader to determine market behaviour. A key feature is the Value Area, representing the range of price action where 70% of trading took place. Understanding the Value Area can give traders valuable insight into market direction and establish the higher odds trade. It is an excellent addition to any system you may be using. Inspired by Jim Dalton’s book “Mind Over Markets”, this indicator is designed to suit the
The US dollar sits at the heart of all the financial markets. It is the currency of first reserve. It is the ultimate safe haven currency, and it is the currency in which all commodities are priced. It is the currency which every Forex trader should consider – first! Having a view of the US dollar is paramount in gauging market sentiment, attitude to risk, and money flows into related markets and instruments. If you know which way the USD is headed – the rest is easy. The Quantum DXY indicator g
This is my version of Currency Strength Meter.  One of the best indicators for spotting weak and strong currencies. Based on the information obtained, its very simple to decide which currency buy and which sell.  It is very simple to use, but extremely effective.  General rules are: - Buy currencies above level 0  - Sell currencies below level 0 You can also mix the main currencies together -->  EURUSD > 0 and USDJPY < 0  --> BUY on EURJPY 
FREE
このインジケーターは、チャート上のすべての注文 (トランザクション/注文ラインにクローズ) に対して既に設定した TP および SL 値 (その通貨で) を表示し、すべての注文の利益と損失を見積もるのに大いに役立ちます。また、PIP 値も表示されます。表示されている形式は、「利益または損失の通貨値 / PIP 値」です。 TP 値は緑色で表示され、SL 値は赤色で表示されます。 ご質問や詳細については、fxlife.asia@hotmail.com で販売者にお気軽にお問い合わせください。 (そして、近日中にインジケータに追加される次の機能は、「自動または半自動の TP および SL 設定」であり、お客様は無料で更新バージョンを入手できます。よろしくお願いします。) (または、表示に何か機能を追加すべきだと思われる場合は、お気軽にお申し付けください)
Pipfinite creates unique, high quality and affordable trading tools. Our tools may or may not work for you, so we strongly suggest to try the Demo Version for MT4 first. Please test the indicator prior to purchasing to determine if it works for you. We want your good reviews, so hurry up and test it for free...we hope you will find it useful. Combo Energy Beam with Swing Control Strategy: Confirm swing pullback signals Watch Video: (Click Here) Energy Beam with Trend Laser Strategy: Confirm Tr
The   Supply and Demand Zones indicator   is one of the best tools we have ever made. This great tool automatically draws supply and demand zones, the best places for opening and closing positions. It has many advanced features such as multi timeframe zones support, displaying the width of zones, alert notifications for retouched zones, and much more. Because of market fractality, this indicator can be used for any kind of trading. Whether you are a positional, swing, or intraday trader does no
HiperCube ADX Histogram is here! This indicators helps you to know if could be a strong trend in the market . ADX is a very popular and usefull indicator, so many top traders reccomends use it as filter to bad trades, or in combinations of other analysis. With HiperCube ADX you will be a premium exoerience using a beautifula and great indicator for your trading. FEATURES: Fully Customizable Custom Your Chart! Custom Color to Histogram In Sub Windows for have a clear main chart
trend view panel; AutoSignals Trend The indicator tracks the trend in 5 different chart times for the same asset, based on 6 signals for each chart time. The main objective of the indicator is to show us the majority trend of the financial asset in which it was placed. The system transmits the information of the trends in different graphic times, in this way the user is able to have a wide view of the movement of the asset, this type of tool makes the user have a higher hit rate by
ATrend: その仕組みと使い方 仕組み MT5プラットフォーム向けの「ATREND」インジケーターは、テクニカル分析手法の組み合わせを利用して、トレーダーに堅牢な買いと売りのシグナルを提供するように設計されています。このインジケーターは主に、ボラティリティ測定のために平均真の範囲(ATR)を活用し、潜在的な市場動向を特定するためのトレンド検出アルゴリズムを併用しています。 購入後にメッセージを残すと、特別なボーナスギフトが贈呈されます。 39ドルの価格で残り8部 主な特徴: - ダイナミックなトレンド検出: インジケーターは市場トレンドを評価し、シグナルを適宜調整することで、トレーダーが優位な市場環境に合わせて戦略を立てるのを支援します。     - ボラティリティ測定: ATRを使用することで、インジケーターは最適なストップロス(SL)とテイクプロフィット(TP)レベルを決定するために不可欠な市場ボラティリティを測定します。 - シグナルの視覚化: インジケーターは、チャート上に買いと売りのシグナルを視覚的に表示することで、トレーダーの意思決定を強化します。 操作手順 入力
Market Profile MetaTrader System  — is a classic Market Profile implementation that can show the price density over time, outlining the most important price levels, value area, and control value of a given trading session. This indicator can be attached to timeframes between M1 and D1 and will show the Market Profile for daily, weekly, monthly, or even intraday sessions. Lower timeframes offer higher precision. Higher timeframes are recommended for better visibility. It is also possible to use a
回帰取引を意味する専門的かつ定量的なアプローチを実装する独自の指標。これは、価格が予測可能かつ測定可能な方法で迂回して平均に戻るという事実を利用しており、非定量的な取引戦略を大幅に上回る明確な出入りルールを可能にします。 [ Installation Guide | Update Guide | Troubleshooting | FAQ | All Products ] 明確な取引シグナル 驚くほど簡単に取引できます カスタマイズ可能な色とサイズ パフォーマンス統計を実装します ほとんどの取引戦略を上回ります 適切なSLおよびTPレベルを表示します 電子メール/音声/視覚アラートを実装します 使い方 インディケータは、より高い時間枠からの完全にカスタマイズ可能な移動平均の周りの標準偏差を測定し、トレンドフォローアプローチを使用して正確に取引を見つけます。取引は、現在のチャートの価格アクションに飛び込むことによって見つけられ、価格が選択したより高い時間枠から計算された平均価格帯に戻ったときに閉じられます。それがコード化される方法のために、指標は高ボラティリティと強いトレンドの
MT4 Version SMT Divergences MT5 SMT Divergences is one of the most innovative indicators in the market. It offers the possibility of analyzing price divergences between 2 pairs. These divergences highlight and help to foresee what banks and institutions are planning to do. SMT divergences also provides you with a kill zones indicator and the possibility of filtering divergences occurring during these kill zones.  This indicator is specially powerful if applied in 2 highly correlated pairs. A pr
トレンドトレーディング は、タイミングのプルバックとブレイクアウトにより、市場で起こっているトレンドから可能な限り利益を得るように設計された指標です。確立されたトレンドの中で価格が何をしているかを分析することにより、取引の機会を見つけます。 [ インストールガイド | 更新ガイド | トラブルシューティング | よくある質問 | すべての製品 ] 自信を持って効率的に金融市場を取引する むち打ちにならずに確立されたトレンドから利益を得る 収益性の高いプルバック、ブレイクアウト、早期の逆転を認識する この指標は、独自の品質とパフォーマンスを分析します 複数時間枠のダッシュボードを実装します インジケーターは再描画されていません 電子メール/音声/視覚アラートを実装します 確立されたトレンドは多くの取引機会を提供しますが、ほとんどのトレンド指標はそれらを完全に無視しています。インジケーターの解釈はかなり簡単です: (1) トレンドの変化 (2) トレンドの方向への後退 (3) トレンドの方向へのブレイクアウト 赤いダッシュ は下降トレンド中の修正です 青いダッシュ は上昇ト
A huge number of traders use the VolumeProfile/MarketProfile analysis method. And I think there is no need to explain such concepts as POC and VAH/VAL. However, the standard VolumeProfile representation has a drawback - we only see the current picture of the market. We see the "convexity" of the volume distribution within the period. But we don't see the main thing - the "migration" of the POC level during the price movement. Our indicator is unique. It is dynamic. The first feature is that the
このプロダクトを購入した人は以下も購入しています
まず第一に、この取引インジケーターは再描画されず、再描画されず、遅延しないことを強調する価値があります。これにより、手動取引とロボット取引の両方に理想的なものになります。 ユーザーマニュアル:設定、入力、戦略。 アトミックアナリストは、価格の強さとモメンタムを利用して市場でより良いエッジを見つけるためのPA価格アクションインジケーターです。ノイズや誤ったシグナルを除去し、取引ポテンシャルを高めるための高度なフィルターを備えています。複雑なインジケーターの複数のレイヤーを使用して、アトミックアナリストはチャートをスキャンし、複雑な数学的計算をシンプルなシグナルと色に変換します。これにより、どのような初心者トレーダーでも理解して使用し、一貫した取引の決定を行うことができます。 「アトミックアナリスト」は、新規および経験豊富なトレーダー向けにカスタマイズされた包括的な取引ソリューションです。プレミアムインジケーターとトップノッチの機能を1つの取引戦略に組み合わせ、すべてのタイプのトレーダーにとって汎用性のある選択肢にします。 デイリートレーディングとスキャルピング戦略:高速で正確な
Atbot
Zaha Feiz
4.97 (29)
AtBot: どのように機能し、どのように使用するか ### どのように機能するか MT5プラットフォーム用の「AtBot」インジケーターは、テクニカル分析ツールの組み合わせを使用して売買シグナルを生成します。単純移動平均(SMA)、指数移動平均(EMA)、および平均真実範囲(ATR)インデックスを統合して取引機会を特定します。さらに、Heikin Ashiキャンドルを使用してシグナルの精度を向上させることもできます。 購入後にレビューを残すと、特別なボーナスギフトを受け取ります。 ### 主な機能: - 再描画なし: シグナルはプロット後に変更されません。 - 再描画なし: シグナルは一貫しており、変更されません。 - 遅延なし: 遅延なくタイムリーなシグナルを提供します。 - 多様な時間枠: あらゆる時間枠で使用可能で、取引戦略に合わせることができます。 ### 操作手順: #### 入力と設定: - firstkey (TrendValue): トレンド検出の感度を調整します。 - Secondkey (SignalValue): 売買シグナル生成の感度を定義します。 - ma
まず第一に、このトレーディングシステムがノンリペイント、ノンリドロー、ノンラグのインジケーターであることを強調する価値がある。これにより、手動取引とロボット取引の両方に理想的なものになっています。 オンラインコース、マニュアル、プリセットのダウンロード。 「スマートトレンドトレーディングシステム MT5」は、新規および経験豊富なトレーダー向けにカスタマイズされた包括的なトレーディングソリューションです。10以上のプレミアムインジケーターを組み合わせ、7つ以上の堅実なトレーディング戦略を備えており、多様な市場状況に対応する多目的な選択肢となっています。 トレンドフォロー戦略:トレンドを効果的に乗り越えるための正確なエントリーとストップロス管理を提供します。 リバーサル戦略:潜在的なトレンドの反転を特定し、トレーダーがレンジ相場を活用できるようにします。 スキャルピング戦略:高速で正確なデイトレードおよび短期取引のために設計されています。 安定性:すべてのインジケーターはノンリペイント、ノンリドロー、ノンラグであり、信頼性の高いシグナルを保証します。 カスタマイズ:個々の取引の嗜好に合わせ
最初のパルスレベルを反転 (RFI)     指示する     ロシア     -        utilizar con   el indicador の ESP 推奨事項 -   TPSpro トレンド プロフェッショナル版 -   MT5のバージョン 最も重要なことは、将来においても最も重要なことです。 機能のプリンシパル: ゾーンのほとんどは、ベンダーとコンプラドールによってアクティブ化されます。 状況を直感的に把握できるよう、初期の衝動を修正します。 LOGIC AI: MUESTRA zonas (círculos) parabuscar puntos de entrada cuando se activa una plantilla 視覚的に優れた視覚効果があり、最も重要な機能がすべて揃っていることに注意してください。 優れたニベレス/ゾーンの視覚化 (modo MTF) 世界で最も人気のある場所/ゾーンです。これを使用するのに最適な方法です (   TPSproTREND PRO   )。 アルゴリズム プロフェッショナル セパラド パソ ア パソ パラ オペラ それは
TPSpro TREND PRO は 、市場を自動的に分析し、トレンドとその各変化に関する情報を提供し、再描画せずに取引にエントリーするためのシグナルを提供するトレンド指標です。 インジケーターは各ローソク足を使用し、個別に分析します。上向きまたは下向きのさまざまな衝撃を指します。通貨、仮想通貨、金属、株、指数の取引への正確なエントリーポイント! バージョンMT5                   インジケーターの完全な説明     RFI LEVELS インジケーター と併用することをお勧めします。 主な機能: レンダリングなしで正確な入力信号! シグナルが表示されると、それは関連性を維持します。これは、シグナルを提供してからそれを変更し、その結果、入金された資金が失われる可能性があるリドローインジケーターとの重要な違いです。より高い確率と精度で市場に参入できるようになりました。矢印が表示された後、ターゲットに到達する (利益確定) か反転シグナルが表示されるまで、ローソク足に色を付ける機能もあります。 STOP-LOSS/TAKE-PROFITゾーンの表示 エントリーポイン
Gold Stuff mt5
Vasiliy Strukov
4.9 (185)
Gold Stuff mt5 は、金専用に設計されたトレンド指標であり、あらゆる金融商品にも使用できます。 インジケーターは再描画せず、遅れません。 推奨時間枠 H1. 設定と個人的なボーナスを得るために、購入後すぐに私に連絡してください!  トレンド スキャナーの強力なサポートを利用して、無料のインジケーターを入手し、プライバシーを守ります。あーみー!   設定 矢印を描く - オンオフ。 チャートに矢印を描く。 アラート - 可聴アラートのオンオフ。 メール通知 - オンオフ。 電子メール通知。 プチ通知 - オンオフ。 プッシュ通知。 次に、色域を調整します。 Gold Stuff mt5 は、金専用に設計されたトレンド指標であり、あらゆる金融商品にも使用できます。 インジケーターは再描画せず、遅れません。 推奨時間枠 H1. 設定と個人的なボーナスを得るために、購入後すぐに私に連絡してください!   設定 矢印を描く - オンオフ。 チャートに矢印を描く。 アラート - 可聴アラートのオンオフ。 メール通知 - オンオフ。 電子メール通知。 プチ通
Quantum Trend Sniper
Bogdan Ion Puscasu
4.92 (48)
ご紹介   クォンタム トレンド スナイパー インジケーターは 、トレンド反転を特定して取引する方法を変革する画期的な MQL5 インジケーターです。 13年以上の取引経験を持つ経験豊富なトレーダーのチームによって開発されました。     クォンタムトレンドスナイパーインジケーター   は、非常に高い精度でトレンドの反転を識別する革新的な方法で、あなたのトレーディングの旅を新たな高みに押し上げるように設計されています。 ***Quantum Trend Sniper Indicatorを購入すると、Quantum Breakout Indicatorを無料で入手できます!*** クォンタム ブレイクアウト インジケーターは、トレンドの反転を特定するとアラートを発し、矢印を示し、3 つのテイクプロフィットレベルを提案します。 初心者トレーダーにもプロのトレーダーにも適しています。 量子EAチャネル:       ここをクリック MT4のバージョン:       ここをクリック 推奨事項: 期間:すべての時間枠。最良の結果を得るには、M
これはMT5のインジケーターで、再描画なしで取引に参入するための正確なシグナルを提供します。 外国為替、暗号通貨、金属、株式、インデックスなど、あらゆる金融資産に適用できます。かなり正確な見積もりを提供し、取引を開始して終了するのに最適な時期を教えてくれます。1つのシグナルを処理しただけでインジケーターの元が取れた例の 動画 (6:22)をご覧ください。Entry PointsPro インジケーターの助けを借りたほとんどのトレーダーの最初の1週間の結果が改善しています。 Telegramグループ に登録してください。Entry Points Proインジケーターのメリットは次の通りです。 再描画のないエントリーシグナル 再描画されるインジケーターでは一度表示されたシグナルが削除されて大きな金銭的損失につながることがありますが、これと異なり、表示されて確認されたシグナルは消えることがありません。 エラーなしの取引開始 インジケーターアルゴリズムによって取引を開始する(資産を売買する)理想的な瞬間を見つけることができます。それを使用するすべてのトレーダーの成功率が向上します。
まず第一に、この取引ツールはノンリペイント、ノンリドロー、ノンラグの指標であり、プロの取引に理想的ですことを強調する価値があります。 オンラインコース、ユーザーマニュアル、デモ。 スマートプライスアクションコンセプトインジケーターは、新米から経験豊富なトレーダーまで、非常 に強力なツールです。Inner Circle Trader AnalysisやSmart Money Concepts Trading Strategiesなど、20以上の有用な指標を1つに組み合わせています。このインジケーターはスマートマネーコンセプトに焦点を当て、大手機関の取引方法を提供し、彼らの動きを予測するのに役立ちます。 特に、流動性分析に優れており、機関がどのように取引しているかを理解しやすくしています。市場のトレンドを予測し、価格の動きを慎重に分析するのに優れています。機関の戦略とトレードを合わせることで、市場の動向についてより正確な予測ができます。このインジケーターは多目的であり、市場構造を分析し、重要な注文ブロックを特定し、さまざまなパターンを認識するのに優れています。 このインジ
トレンド スクリーナー インジケーターでトレンド取引の力を解き放ちます。ファジー ロジックと複数通貨システムを活用した究極のトレンド取引ソリューションです。 ファジー ロジックを活用した革新的なトレンド インジケーターである Trend Screener を使用して、トレンド取引を向上させます。 これは、13 を超えるプレミアム ツールと機能、および 3 つの取引戦略を組み合わせた強力なトレンド追跡インジケーターであり、Metatrader をトレンド アナライザーにする多用途の選択肢となります。 期間限定オファー : トレンド スクリーナー インジケーターは、わずか 50 ドルで生涯ご利用いただけます。 (元の価格 125$ ) (オファー延長) Trend Screener の 100% 非再描画精度の揺るぎない精度を体験して、取引の決定が過去の価格変動の影響を受けないようにしてください。 マルチタイムフレームおよびマルチ通貨機能の多用途性を解放し、比類のない自信を持って外国為替、商品、暗号通貨、インデックスの世界を取引できるようにします。 Trend Screener の包括的な
mql5と Telegramの モーニング・ブリーフィングで、詳細とスクリーンショットを含む毎日のマーケット・アップデートをご覧 ください! FX Power MT5 NGは 、長年の人気を誇る通貨強度計FX Powerの次世代モデルです。 この次世代ストレングスメーターは何を提供するのでしょうか?初代FXパワーの魅力すべて プラス GOLD/XAUの強さ分析 より正確な計算結果 個別に設定可能な分析期間 カスタマイズ可能な計算上限値により、さらに優れたパフォーマンスを実現 もっと見たい人のための特別なマルチインスタンス設定 すべてのチャートでお好みの色を無限に設定可能 数え切れないほどの通知オプションにより、重要なことを見逃すことはありません。 Windows 11とmacOSのスタイルで角を丸くした新しいデザイン 魔法のように動くインジケーターパネル FXパワーの主な機能 すべての主要通貨の強さの完全な履歴 すべての時間枠における通貨の強さの履歴 すべてのブローカーとチャートで同一の計算結果 100%信頼できるリアルタイム計算 -> リペイントなし ドロップダウン・リストから
FX Volume MT5
Daniel Stein
4.94 (17)
mql5と Telegramの モーニング・ブリーフィングで、詳細とスクリーンショットを含む毎日のマーケット・アップデートをご覧 ください! FX Volumeは、ブローカーの視点から市場のセンチメントをリアルに洞察する、最初で唯一の出来高インジケーターです。 ブローカーのような機関投資家が外国為替市場でどのようなポジションをとっているか、COTレポートよりもはるかに速く、素晴らしい洞察を提供します。 この情報をチャート上で直接見ることは、あなたの取引にとって真のゲームチェンジャーであり、画期的なソリューションです。 以下のようなユニークなマーケットデータ洞察から利益を得てください。 比率は 、通貨のロングポジションとショートポジションの比率をパーセントで表示します。 比率の変化は 、選択した期間内のロング比率とその変化率を表示します。 Volumes Totalは 、通貨の取引量(ロングとショート)の合計をロット単位で表示します。 Volumes Long :全通貨のロングポジションの取引量を表示します。 Volumes(ショート )は、全通貨のショートポジションの取引量を表示
Easy By Sell is a market indicator for opening and closing positions. It becomes easy to track market entries with alerts. It indicates trend reversal points when a price reaches extreme values ​​and the most favorable time to enter the market. it is as effective as a Fibonacci to find a level but it uses different tools such as an algorithm based on ATR indicators and Stochastic Oscillator. You can modify these two parameters as you wish to adapt the settings to the desired period. My othe
IX Powerは 、FX Powerの無敵の精度をついにFX以外のシンボルにも提供します。 お気に入りの指数、株式、コモディティ、ETF、さらには暗号通貨の短期、中期、長期のトレンドの強さを正確に判断します。 お使いの端末が提供する すべてを分析する ことができます。ぜひお試しいただき、取引 タイミングが大幅に改善 されることをご体験ください。 IXパワーの主な特徴 100%正確で再描画されない計算結果 - ターミナルで利用可能なすべての取引シンボルに対して 予め設定され、さらに個別に設定可能な強度分析期間のドロップダウン選択 Eメール、メッセージ、モバイル通知による無数の通知オプション EAリクエストのためのアクセス可能なバッファ カスタマイズ可能な計算制限により、さらに優れたパフォーマンスを実現 もっと見たい人のための特別なマルチインスタンス設定 すべてのチャートでお好みの色を無限に設定可能 Windows 11とmacOSのスタイルで角を丸くした新しいパネルデザイン サブ・ウィンドウとメイン・チャートの間をシームレスに移動する、魔法のように動くイン
note: this indicator is for METATRADER4, if you want the version for METATRADER5 this is the link:  https://www.mql5.com/it/market/product/108106 TRENDMAESTRO ver 2.4 TRENDMAESTRO recognizes a new TREND in the bud, he never makes mistakes. The certainty of identifying a new TREND is priceless. DESCRIPTION TRENDMAESTRO identifies a new TREND in the bud, this indicator examines the volatility, volumes and momentum to identify the moment in which there is an explosion of one or more of these data a
今、147ドル(いくつかの更新後に499ドルに増加します) - 無制限のアカウント(PCSまたはMac) RelicusRoad ユーザー マニュアル + トレーニング ビデオ + プライベート Discord グループへのアクセス + VIP ステータス 市場の新しい見方 RelicusRoad は、外国為替、先物、暗号通貨、株式、および指数の世界で最も強力な取引インジケーターであり、トレーダーに収益を維持するために必要なすべての情報とツールを提供します。初心者から上級者まで、すべてのトレーダーが成功するためのテクニカル分析と取引計画を提供します。これは、将来の市場を予測するのに十分な情報を提供する重要な取引指標です。意味をなさないチャート上のいくつかの異なる指標ではなく、完全な解決策を信じています.これは、信号、矢印 + 価格アクション情報を表示するオールインワンのインジケーターで、他に類を見ない非常に正確です。 強力な AI に基づいて、RelicusRoad は不足している情報とツールを提供して、あなたを教育し、トレーディングのプロ、成功したトレーダーにします。
Step into the realm of Forex trading with confidence and precision using XQ, a cutting-edge Forex indicator designed to elevate your trading game to unprecedented heights. Whether you're a seasoned trader or just stepping into the world of currency exchange, XQ Forex Indicator empowers you with the insights and signals needed to make informed trading decisions. The signal conditions are a combination of three indicators, and XQ Forex Indicator only display  medium and long-term trends . The ind
このダッシュボードは、選択されたシンボルの最新の利用可能なハーモニックパターンを表示するので、時間を節約し、より効率的に /   MT4バージョン 。 無料インジケーター:   Basic Harmonic Pattern インジケーター列 Symbol : 選択したシンボルが表示されます。 Trend :   強気または弱気 Pattern : パターンの種類(ガートレー、バタフライ、バット、カニ、サメ、サイファー、ABCD) Entry : エントリー価格 SL: ストップロス価格 TP1: 1回目の利食い価格 TP2: 2回目の利食い価格 TP3:   3回目の利食い価格 Current price :   現在値 Age (in bars):    最後に描画されたパターンの年齢 主な入力項目 Symbols:   "28 Major Currency Pairs "または "Selected Symbols "から選択。 Selected Symbols:   カンマで区切られた監視したいシンボル("EURUSD,GBPUSD,XAUUSD")。ブローカーが
Golden Spikes Detector Acknowledgement and Dedications:  The name of this indicator was Inspired by an Original; Mr Grant Koopman; a Knowledgeable and experienced Synthetics trader. I dedicate this indicator to Mr Grant.  Overview: The Golden Spikes Premium is a groundbreaking trading indicator meticulously crafted for the Boom and Crash indices on the Deriv market. Tailored to meet the needs of discerning traders, this powerful tool operates exclusively on the one-minute timeframe, providin
Gartley Hunter Multi - An indicator for searching for harmonic patterns simultaneously on dozens of trading instruments and on all possible timeframes. Manual (Be sure to read before purchasing) | Version for MT4 Advantages 1. Patterns: Gartley, Butterfly, Shark, Crab. Bat, Alternate Bat, Deep Crab, Cypher 2. Simultaneous search for patterns on dozens of trading instruments and on all possible timeframes 3. Search for patterns of all possible sizes. From the smallest to the largest 4. A
ICT, SMC, SMART MONEY CONCEPTS, SMART MONEY, Smart Money Concept, Support and Resistance, Trend Analysis, Price Action, Market Structure, Order Blocks, BOS/CHoCH,   Breaker Blocks ,  Momentum Shift,   Supply&Demand Zone/Order Blocks , Strong Imbalance,   HH/LL/HL/LH,    Fair Value Gap, FVG,  Premium  &   Discount   Zones, Fibonacci Retracement, OTE, Buy Side Liquidity, Sell Side Liquidity, BSL/SSL Taken, Equal Highs & Lows, MTF Dashboard, Multiple Time Frame, BigBar, HTF OB, HTF Market Structure
サポート線と抵抗線のプロットにうんざりしていませんか? サポートレジスタンス は、非常に興味深いひねりを加えてチャート内のサポートとレジスタンスラインを自動検出およびプロットするマルチタイムフレームインジケーターです。価格レベルは時間とともにテストされ、その重要性が高まるにつれて、ラインは太くなり、暗くなります。 [ インストールガイド | 更新ガイド | トラブルシューティング | よくある質問 | すべての製品 ] 一晩でテクニカル分析を強化 チャートを閲覧せずに重要な価格レベルを検出 一目ですべての価格レベルの相対的な強さを認識する すべての取引で最大30時間のプロットラインを節約 インジケーターは、すべての価格レベルの年齢を表示します インジケーターは再描画されていません 過去および現在の価格レベルは近接によって崩壊し、現在の市場行動に合わせて調整されます。動作は、必ずしもピークではない場所に線が引かれます。 価格レベルは、時間とともに拒否されるにつれて、より暗く、より広くなります ノイズを避けるために、重要でない価格レベルは定期的にクリアされます カスタマイズ可能な時間枠の
The Smart Liquidity Profile is color-coded based on the importance of the traded activity at specific price levels, allowing traders to identify significant price levels such as support and resistance levels, supply and demand zones, liquidity gaps, consolidation zones, Buy-Side/Sell-Side Liquidity and so on.  Smart Liquidity Profile allows users to choose from a number of different time periods including 'Auto,' 'Fixed Range,' 'Swing High,' 'Swing Low,' 'Session,' 'Day,' 'Week,' 'Month,' 'Quart
The Volumebyprice.com Indicator for MetaTrader 5 features Volume Profile and Market Profile TPO (Time Price Opportunity). Volume and TPO histogram bar and line charts. Volume Footprint charts. TPO letter and block marker collapsed and split structure charts. Static, dynamic and flexible range segmentation and compositing methods with relative and absolute visualizations. Session hours filtering and segment concatenation with Market Watch and custom user specifications. Graphical layering, posit
Volatility Trend System - a trading system that gives signals for entries. The volatility system gives linear and point signals in the direction of the trend, as well as signals to exit it, without redrawing and delays. The trend indicator monitors the direction of the medium-term trend, shows the direction and its change. The signal indicator is based on changes in volatility and shows market entries. The indicator is equipped with several types of alerts. Can be applied to various trading in
TPA True Price Action indicator reveals the true price action of the market makers through 100% non-repainting signals strictly at the close of a candle! TPA shows entries and re-entries, every time the bulls are definitely stronger than the bears and vice versa. Not to confuse with red/green candles. The shift of power gets confirmed at the earliest stage and is ONE exit strategy of several. There are available now two free parts of the TPA User Guide for our customers. The first "The Basics"
Matrix Arrow Indicator MT5
Juvenille Emperor Limited
5 (14)
マトリックスアローインジケーターMT5は、すべてのシンボル/商品(外国為替、商品、暗号通貨、インデックス、株式)で使用できる100%再描画されていないマルチタイムフレームインジケーターに続くユニークな10in1トレンドです。マトリックスアローインジケーターMT5は、初期段階で現在のトレンドを判断し、最大10の標準インジケーターから情報とデータを収集します。 平均方向移動指数(ADX) 商品チャネルインデックス(CCI) クラシック平研アシキャンドル 移動平均 移動平均収束発散(MACD) 相対活力指数(RVI) 相対力指数(RSI) 放物線SAR ストキャスティクス ウィリアムズのパーセント範囲 すべてのインジケーターが有効な買いまたは売りシグナルを与えると、対応する矢印がチャートに印刷され、次のろうそく/バーの開始時に強い上昇トレンド/下降トレンドを示します。ユーザーは、使用するインジケーターを選択し、各インジケーターのパラメーターを個別に調整できます。マトリックスアローインジケーターMT5は選択されたインディケーターからのみ情報を収集し、それらのデータのみに基づいてアローを印
** All Symbols x All Timeframes scan just by pressing scanner button ** ***Contact me after purchase to send you instructions and add you in "123 scanner group" for sharing or seeing experiences with other users. After 17 years of experience in the markets and programming, Winner indicator is ready. I would like to share with you! Introduction The 123 Pattern Scanner indicator with a special enhanced algorithm is a very repetitive common pattern finder with a high success rate . Interestingly,
Was: $299  Now: $99   Supply Demand uses previous price action to identify potential imbalances between buyers and sellers. The key is to identify the better odds zones, not just the untouched ones. Blahtech Supply Demand indicator delivers functionality previously unavailable on any trading platform. This 4-in-1 indicator not only highlights the higher probability zones using a multi-criteria strength engine, but also combines it with multi-timeframe trend analysis, previously confirmed swings
Order Block Hunter MT5
Noha Mohamed Fathy Younes Badr
5 (1)
Order block hunter indicator is the best indicator for  hunt the order blocks that area where there has been a large concentration of limit orders waiting to be executed Order blocks are identified on a chart by observing previous price action and looking for areas where the price experienced significant movement or sudden changes in direction .This indicator does that for you by using very complicated codes and helps you to take the best areas To buy and sell because it make marks at the best a
作者のその他のプロダクト
This indicator has been developed to identify and display these trends quickly and easily, allowing you to see instantly, those currency pairs which are trending, and those which are not – and in all timeframes, with just one click. The 28 currency pairs are displayed as a fan as they sweep from strong to weak and back again, and this is why we call it the ‘currency array’. All 28 pairs are arrayed before you, giving an instant visual description of those pairs that are trending strongly, those
Renko is a well-known Japanese charting technique that removes time from the chart. Instead of drawing bars in constant intervals (time) as a normal chart would, a Renko chart does so only when price moves beyond a predefined amount. In a Renko chart, a bar is created when price exceeds the previous bar’s high or low by a predefined amount or what we call the Box Size. The result is a chart with equally sized bars running up or down in 45 degree angles. Such a chart offers the following advant
Your success as a forex trader depends on being able to identify when a currency or currency pair is oversold or overbought. If it is strong or weak. It is this concept which lies at the heart of forex trading. Without the Quantum Currency Strength indicator, it is almost impossible. There are simply too many currencies and too many pairs to do this quickly and easily yourself. You need help! The Quantum Currency Strength indicator has been designed with one simple objective in mind. To give you
Currency pairs never go up or down in a straight line. They rise and fall constantly, creating pullbacks and reversals. And with each rise and fall, so your emotions rise and fall. Hope, then fear, then hope. This is when the market will try to frighten you out of a strong position. It is when you are most vulnerable. But not if you have the Quantum Trend Monitor. And here, you even get two indicators for the price of one! The Quantum Trend Monitor has been designed to absorb these temporary pau
Quantum Trends Indicator
QUANTUM TRADING SOFTWARE LIMITED
1 (1)
One of the oldest maxims in trading is ‘let the trend be your friend’. You must have come across it! This is easier said than done! First, you have to identify one, then you have to stay in – not easy. Staying in a trend to maximise your profits is extremely difficult. In addition, how do you know when a trend has started? It’s very easy to look back and identify the trend. Not so easy at the live edge of the market. The Quantum Trends indicator is the ‘sister’ indicator to the Quantum Trend Mon
Quantum Tick Volumes Indicator
QUANTUM TRADING SOFTWARE LIMITED
5 (2)
Many Forex traders assume there is no volume in the foreign exchange market. And they would be correct. There is no central exchange, not yet anyway. And even if there were, what would it report? What there is however is activity, and this is captured as tick volume. After all, volume is simply displaying activity, the buyers and sellers in the market. So for volume read activity, and for activity read volume – simple. The MT4 platform delivers tick data which the Quantum Tick Volumes indicator
For aspiring price action traders, reading a candle chart at speed can be learnt, but is a skill which takes years to perfect. For lesser mortals, help is required, and this is where the Quantum Dynamic Price Pivots indicator steps in to help. As a leading indicator based purely on price action, the indicator delivers simple clear signals in abundance, highlighting potential reversals with clinical efficiency. Just like volume and price, pivots are another ‘predictive’ indicator, and a leading i
If you've been trading for any time, you will almost certainly have come across the concept of support and resistance. This powerful and simple concept lies at the heart of technical analysis. It forms the cornerstone of price action trading. Strange to consider therefore, that such a key component of the traders chart has largely been ignored. Most Forex traders still draw their lines manually, leading to a crude interpretation of these key levels. Even those companies who have developed a trad
Have you ever wondered why so many Forex traders get trapped in weak positions on the wrong side of the market? One of the easiest ways the market makers do this, is by using volatility. A currency pair moves suddenly, often on a news release or economic data. Traders jump in, expecting some quick and easy profits, but the move suddenly moves in the opposite direction. This happens in all timeframes, and in all currency pairs. The candle or bar closes, with a wide spread, but then reverses sharp
The US dollar sits at the heart of all the financial markets. It is the currency of first reserve. It is the ultimate safe haven currency, and it is the currency in which all commodities are priced. It is the currency which every Forex trader should consider – first! Having a view of the US dollar is paramount in gauging market sentiment, attitude to risk, and money flows into related markets and instruments. If you know which way the USD is headed – the rest is easy. The Quantum DXY indicator g
We don’t want to become boring, but the US dollar is the most important currency for all traders, and not just in Forex. Trading without a clear view of the US dollar is like driving in fog. Sooner or later you are going to crash – it’s just a question of when. That’s why at Quantum we have developed two US dollar indices. The first is the Quantum DXY, and the second is the Quantum USDX. So what’s the difference? Well, the reason we created the Quantum USDX is that many Forex traders believe tha
Many Forex traders have either been told, or have learnt from painful experience, that the Yen currency pairs can be both dangerous and volatile to trade. The GBP/JPY is perhaps the most infamous and volatile of all. No wonder then, that many Forex traders simply stay away from the Yen currency pairs. But then they probably don’t have a very clear idea of where the Yen itself is heading. If they did, then trading the Yen pairs would be much more straightforward. And this is where the Quantum JPY
Of all the four principle capital markets, the world of foreign exchange trading is the most complex and most difficult to master, unless of course you have the right tools! The reason for this complexity is not hard to understand. First currencies are traded in pairs. Each position is a judgment of the forces driving two independent markets. If the GBP/USD for example is bullish, is this being driven by strength in the pound, or weakness in the US dollar. Imagine if we had to do the same thing
The Quantum VPOC indicator has been developed to expand the two dimensional study of volume and price, to a three dimensional one which embraces time. The volume/price/time relationship then provides real insight to the inner workings of the market and the heartbeat of sentiment and risk which drives the price action accordingly. The Quantum VPOC indicator displays several key pieces of information on the chart as follows: Volume Profile - this appears as a histogram of volume on the vertical pr
Quantum Euro Index Indicator
QUANTUM TRADING SOFTWARE LIMITED
The Euro Currency Index or EURX , quantifies and displays strength and weakness of the single currency. As the index rises it signals strength in the single currency against a basket of currencies. As the index falls this signals weakness in the euro. The Quantum EURX is calculated from a basket of four currencies with each currency having an equal weighting of 25%. US Dollar Japanese Yen British Pound Australian Dollar The indicator can be used in one of three ways: First, to identify and con
Trading the currency markets is a complex business, not least since we are dealing with pairs of currencies, and by inference, pairs of economies. All economies around the world are interlinked, and reflected in the constant ebb and flow of currency strength and weakness. The problem for us as traders is monitoring so many pairs simultaneously, since every pair does not move independently, but reflects the interrelated nature of this market. The Quantum Currency Heatmap delivers the informatio
The words powerful, unique and game changing are ones that are often over used when applied to trading indicators, but for the MT4/MT5 Quantum Camarilla levels indicator, they truly describe this new and exciting indicator completely. Why? Because the indicator has something to offer every trader, from the systematic to the discretionary and from swing trading to breakout trading. And it’s not an indicator which is simply used for entries. The Camarilla indicator delivers in all areas, from ge
The Quantum GBPX is the latest addition to our suite of currency indices, and one which we have been asked for many times, and even more so since Brexit. It is an index which has taken us some time to develop, and through a series of complex calculations draws its primary data from a basket of currencies based on the old style dollar index, the Dixie. This is converted to a chart for the British pound. The result is an accurate index which describes strength and weakness for the GBP currency in
If there is only one MT5 indicator you ever buy for trading forex – this has to be it. Your success as a forex trader depends on being able to identify when a currency or currency pair is oversold or overbought. If it is strong or weak. It is this concept which lies at the heart of forex trading. Without the Quantum Currency Strength indicator, it is almost impossible. There are simply too many currencies and too many pairs to do this quickly and easily yourself. You need help! The Quantum C
The Euro Currency Index or EURX , quantifies and displays strength and weakness of the single currency. As the index rises it signals strength in the single currency against a basket of currencies. As the index falls this signals weakness in the euro. The Quantum EURX is calculated from a basket of four currencies with each currency having an equal weighting of 25%. US Dollar Japanese Yen British Pound Australian Dollar The indicator can be used in one of three ways: First, to identify and con
Have you ever wondered why so many Forex traders get trapped in weak positions on the wrong side of the market? One of the easiest ways the market makers do this, is by using volatility. A currency pair moves suddenly, often on a news release or economic data. Traders jump in, expecting some quick and easy profits, but the move suddenly moves in the opposite direction. This happens in all timeframes, and in all currency pairs. The candle or bar closes, with a wide spread, but then reverses sharp
If you've been trading for any time, you will almost certainly have come across the concept of support and resistance. This powerful and simple concept lies at the heart of technical analysis. It forms the cornerstone of price action trading. Strange to consider therefore, that such a key component of the traders chart has largely been ignored. Most Forex traders still draw their lines manually, leading to a crude interpretation of these key levels. Even those companies who have developed a trad
One of the oldest maxims in trading is ‘let the trend be your friend’. You must have come across it! This is easier said than done! First, you have to identify one, then you have to stay in – not easy. Staying in a trend to maximise your profits is extremely difficult. In addition, how do you know when a trend has started? It’s very easy to look back and identify the trend. Not so easy at the live edge of the market. The Quantum Trends indicator is the ‘sister’ indicator to the Quantum Trend Mon
Of all the four principle capital markets, the world of foreign exchange trading is the most complex and most difficult to master, unless of course you have the right tools! The reason for this complexity is not hard to understand. First currencies are traded in pairs. Each position is a judgment of the forces driving two independent markets. If the GBP/USD for example is bullish, is this being driven by strength in the pound, or weakness in the US dollar. Imagine if we had to do the same thing
We don’t want to become boring, but the US dollar is the most important currency for all traders, and not just in Forex. Trading without a clear view of the US dollar is like driving in fog. Sooner or later you are going to crash – it’s just a question of when. That’s why at Quantum we have developed two US dollar indices. The first is the Quantum DXY, and the second is the Quantum USDX. So what’s the difference? Well, the reason we created the Quantum USDX is that many Forex traders believe tha
For aspiring price action traders, reading a candle chart at speed can be learnt, but is a skill which takes years to perfect. For lesser mortals, help is required, and this is where the Quantum Dynamic Price Pivots indicator steps in to help. As a leading indicator based purely on price action, the indicator delivers simple clear signals in abundance, highlighting potential reversals with clinical efficiency. Just like volume and price, pivots are another ‘predictive’ indicator, and a leading i
Many Forex traders assume there is no volume in the foreign exchange market. And they would be correct. There is no central exchange, not yet anyway. And even if there were, what would it report? What there is however is activity, and this is captured as tick volume. After all, volume is simply displaying activity, the buyers and sellers in the market. So for volume read activity, and for activity read volume – simple. The MT5 platform delivers tick data which the Quantum Tick Volumes indicator
Currency pairs never go up or down in a straight line. They rise and fall constantly, creating pullbacks and reversals. And with each rise and fall, so your emotions rise and fall. Hope, then fear, then hope. This is when the market will try to frighten you out of a strong position. It is when you are most vulnerable. But not if you have the Quantum Trend Monitor. And here, you even get two indicators for the price of one! The Quantum Trend Monitor has been designed to absorb these temporary pau
The Quantum VPOC indicator has been developed to expand the two dimensional study of volume and price, to a three dimensional one which embraces time. The volume/price/time relationship then provides real insight to the inner workings of the market and the heartbeat of sentiment and risk which drives the price action accordingly. The Quantum VPOC indicator displays several key pieces of information on the chart as follows: Volume Profile - this appears as a histogram of volume on the vertical pr
The US dollar sits at the heart of all the financial markets. It is the currency of first reserve. It is the ultimate safe haven currency, and it is the currency in which all commodities are priced. It is the currency which every Forex trader should consider – first! Having a view of the US dollar is paramount in gauging market sentiment, attitude to risk, and money flows into related markets and instruments. If you know which way the USD is headed – the rest is easy. The Quantum DXY indicator g
フィルタ:
レビューなし
レビューに返信