Quantum Euro Index Indicator
- インディケータ
- QUANTUM TRADING SOFTWARE LIMITED
- バージョン: 1.0
- アクティベーション: 5
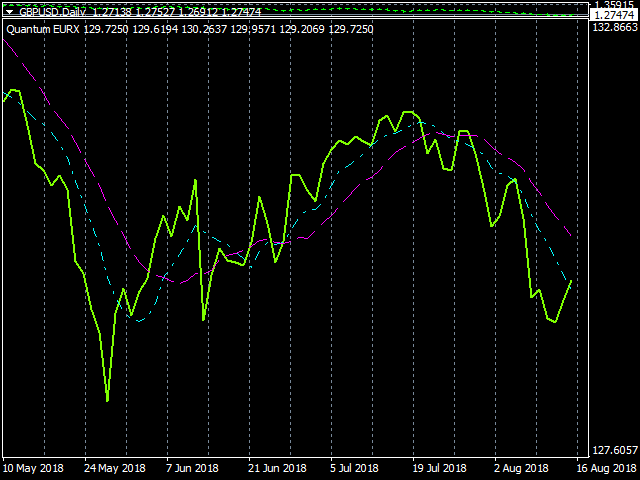
The Euro Currency Index or EURX , quantifies and displays strength and weakness of the single currency. As the index rises it signals strength in the single currency against a basket of currencies. As the index falls this signals weakness in the euro.
The Quantum EURX is calculated from a basket of four currencies with each currency having an equal weighting of 25%.
- US Dollar
- Japanese Yen
- British Pound
- Australian Dollar
The indicator can be used in one of three ways:
- First, to identify and confirm strength and weakness in major and cross currency euro pairs, helping you get in, stay in, and get out.
- Second, as a confirming indicator for the Quantum Currency Strength indicator providing a perspective against other currencies.
- Finally, to provide a relevant and consolidated view of the euro.
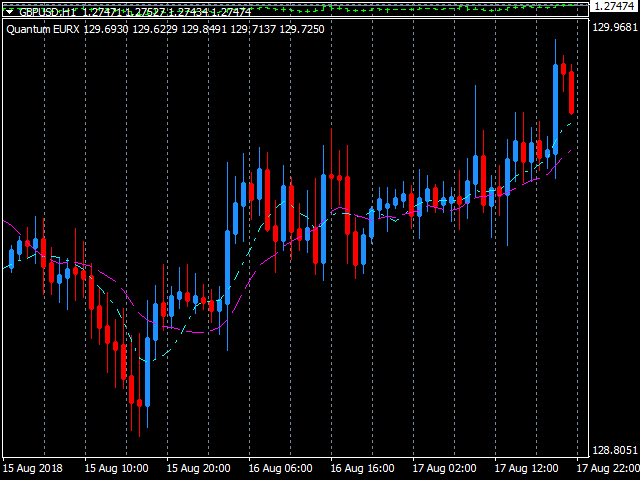
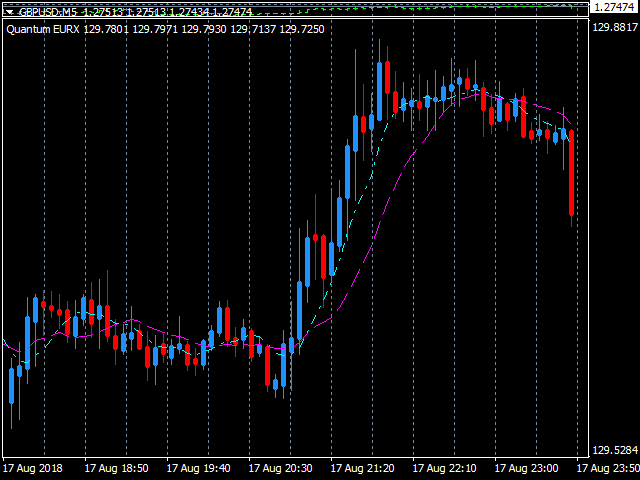
The indicator plots strength and weakness of the euro as a candlestick chart in a separate indicator window when you attach it to the chart. In addition there are two configurable simple moving averages to help with your analysis of the chart.
Whether the single currency survives in the longer term, is one for debate. In the meantime, having a quick and easy way to view the euro and its performance against other currencies is key. The Quantum EURX indicator does just that – removing the hard work and presenting a chart which is simple and easy to read, and which provides an instant view of the euro and whether it is rising or falling, second by second and minute by minute. When used in tandem with the Quantum Currency Strength Indicator it’s the closest you can come to having your own euro crystal ball.