Kappa Trender
- インディケータ
- Artur Brud
- バージョン: 1.7
- アップデート済み: 5 9月 2018
- アクティベーション: 5
Kappa Trender is a unique indicator that will recognize trend direction and give you dynamically changing values for stop loss accordingly to further market movements and unique target calculations (take profit or trailing stop loss) based on last market movements.
Even if you miss the signal (or close last trade at TP), this tool will give you range of price where you can re-enter with good risk-to-reward relation or you can enter manually and use current stop loss and take profit values.
How to use it:
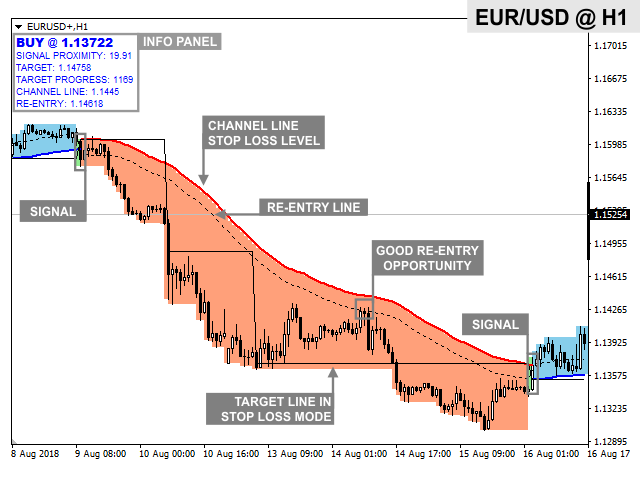
- Enter at signal occurrence with stop loss moving accordingly to channel line value (info panel) and hold it until next signal occure. If price breaks channel line and hit stop loss you can put pending order at re-entry value (info panel)
- Basically same as 1 but if price will close above target line (or below regarding to direction), set there stop loss (target mode = stop loss), if channel line exceed it return to SL = channel line. If price will hit SL then you can seek opportunity in re-entry zone (between channel line and re-enter line) or re-enter manually using current channel line value for SL.
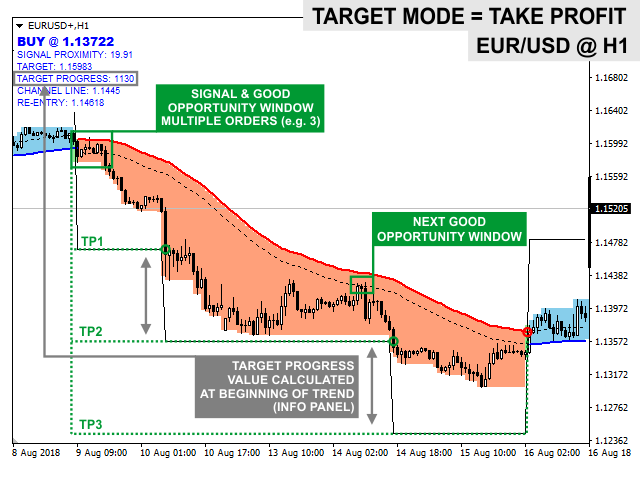
- Basically same as 1 but with take profit usage. After enter, set take profit at target value (info panel). Same as 2 - when price hit TP then you can seek for opportunity in re-enter zone or re-enter manually using current SL and new TP level.
- (MOST EFFECTIVE) Same as 3 but enter with multiple orders and set different TP level for each one of them accordingly to current target and target progression value (info panel) or reduce order partially.
- Your own methodology - this is only a tool that will give you some informations about market and additional reasons to take position (or not) or how long to hold it in profit if You catch the trend. Even if you have your own methodology of entering and exiting trades you can use it as additional tool to determine current trend and potential take profit levels.
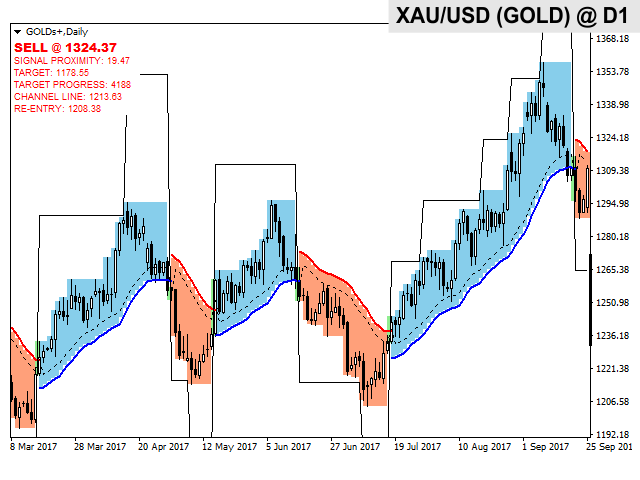
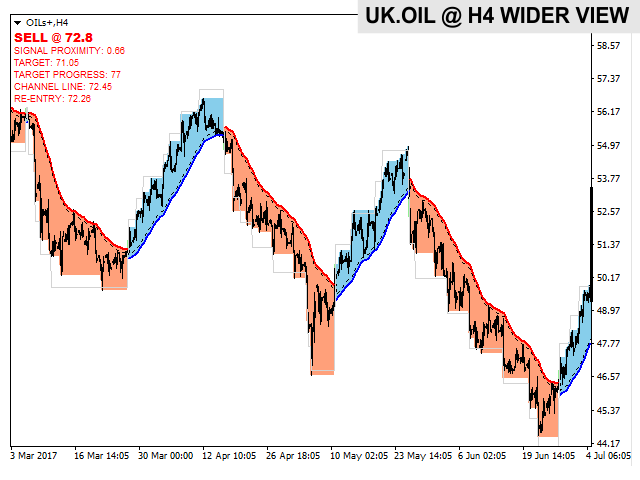
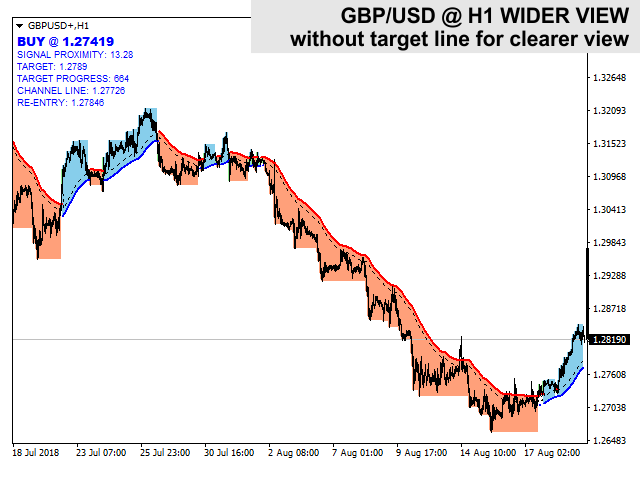
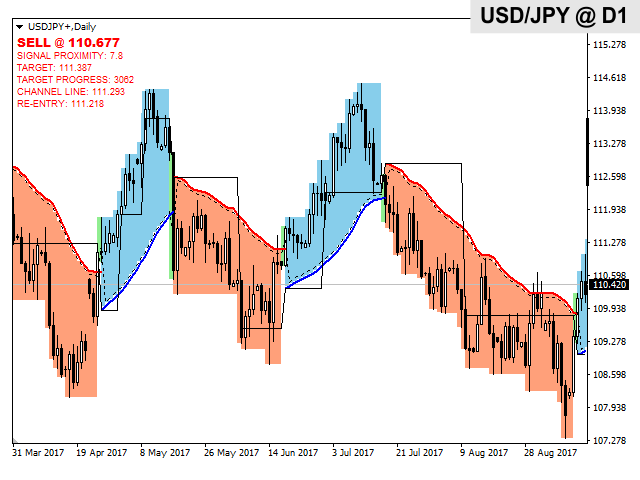
Info panel
- Signal proximity - less value means higher signal occurrence probability.
- Target - last value of target line.
- Target progress - target line progression (in points) if exceeded.
- Channel line - last value of channel line.
- Re-entry line - last value of re-entry line (with channel line creates re-entry zone).
Channel lines refeers only to bid values so in case of sell orders, stop loss level should be corrected by current or average spread value. Re-entry line is calculated with given avg spread value when necessary.
Some further explanations in comments section:
Inputs:
Signal period - number of bars used to calculate signal occurrence (recommended value between 5-20 but can be much higher on lower time frames)
Channel period - number of bars used to calculate channel edge (stop loss value). Lower value give faster progression but will be often broken by price.
Re-entry factor - determines direction and size of re-entry zone (negative values draws opposite zone).
Average spread - average spread value in points (if 0 then current spread value is obtained).
Target factor - multiplier in target line calculation.
Target type - type of target line progression.
- Stop Loss - progression when close exceeds value (new SL level after breakthrough).
- Take Profit - progression when low/high exceeds value.
Notifications on signal - send notification after signal occurrence.
Alerts on signal - pop-up terminal alert after signal occurrence.
Visual parameters:
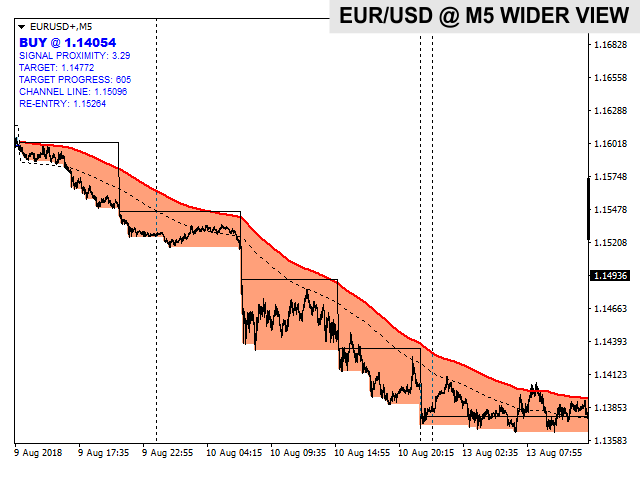
Channel blocks drawing - if true, draws colored blocks on each bars accordingly to trend direction from channel line to last low/high.
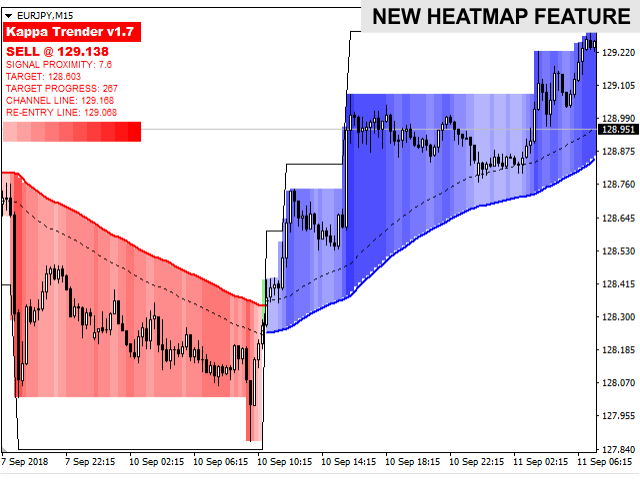
Channel blocks heatmap - if true, use gradient colors (overrides buy and sell channel color)
Info panel X - position of info panel in X-axis
Info panel Y - position of info panel in Y-axis
Other parameters are simply styles and colors (grouped and named accordingly).








Thanks