RSI And Moving Average Line Indicator
- インディケータ
- Zied Ben Daoud
- バージョン: 2.0
- アップデート済み: 28 8月 2018
- アクティベーション: 5
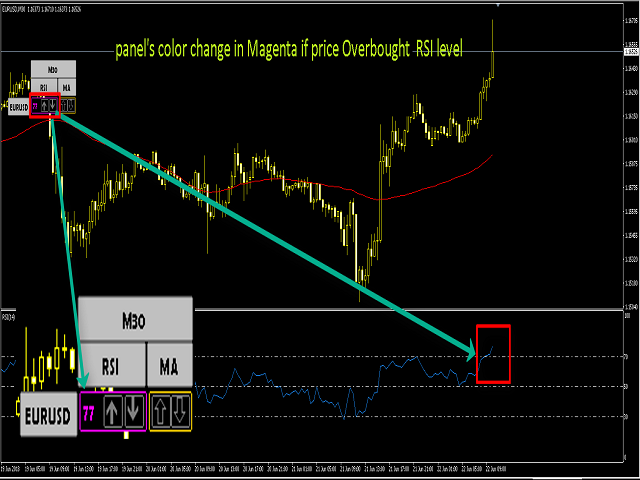
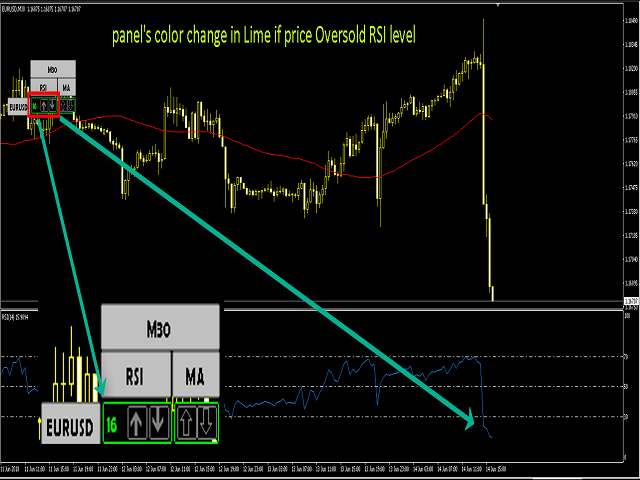
The indicator depends on the price action's analysis how is based on the rsi indicator and the moving average line from a platform containing multi symbols and different time-frames with the possibility to select your desired symbols and time-frames .
Special Characteristics :
* Real time analysis or at price close .
* The possibility to open several windows with the selected symbols .
* Different alert systems .
Indicator Characteristics :
* Multiple symbol and time frame with the possibility to choose the current symbol.
* Open a new chart window for the selected symbol if the mode and enabled .
* Automatic charging your tpl in new chart window .
* Hide all the graphic components .
Alert Settings :
- Alert if Price Above or Below overbought or Oversold Rsi Level .
- Alert if Price Above or Below Rsi Level 50.
- Alert if Price Above or Below Moving Average Line.
- Alert if Price exceed overbought or Oversold Rsi Level and if Above or Below Moving Average Line.
Note if you choose one of the alert methods you receive only the notifications corresponding to the selected method .
- Send Notifications : send notifications to mobile terminals, with the MetaQuotes ID configured in advance how to do it ( https://www.mql5.com/en/forum/43579 ).
- Signal shift - number of the candle to take the values to generate signals
