• 概要
  • レビュー
  • コメント

TradeStatistics

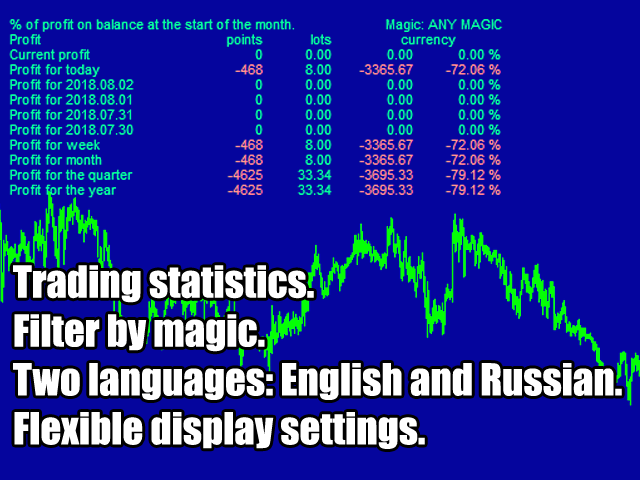
The trading statistics indicator notifies the trader of the aggregate income of the trading account for different time intervals. The indicator has wide display settings on the graph.

There is a choice of one of the two display languages on the chart- English and Russian.
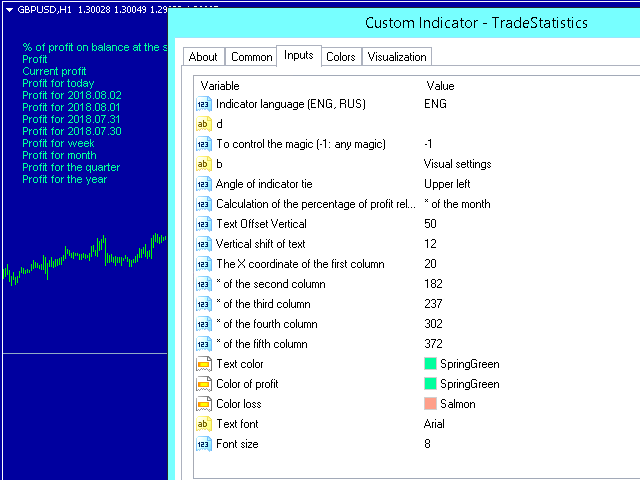

Settings

  • Indicator language (ENG, RUS) - Select the language to display on the chart;
  • To control the magic (-1: any magic) - Entering the Magic for control (-1: any Magic);
  • Angle of indicator tie - Selecting the angle of the chart;
  • Calculation of the percentage of profit relative to: - Calculation of the percentage of profit in relation to;
    • Current balance sheet - Current balance sheet;
    • Balance at the beginning of the day -Balance at the beginning of the day;
    • * of the week - Balance at the beginning of the week;
    • * of the month - Balance at the beginning of the month;
    • * of the quarter - Balance at the beginning of the quarter;
    • * of the year - Balance at the beginning of the year;
  • Text Offset Vertical - Text Offset Vertical;
  • Vertical shift of text - Vertical text shift;
  • The X coordinate of the first column - X coordinate of the first column;
  • * of the second column -The X coordinate of the second column;
  • * of the third column - X-coordinate of the third column;
  • * of the fourth column - X coordinate of the fourth column;
  • * of the fifth column - X coordinate of the fifth column;
  • Text color - Text color;
  • Color of profit - Text color in case of a profit;
  • Color loss - Text color in case of loss;
  • Text font - Text font;
  • Font size - Font size.
おすすめのプロダクト
VR Cub
Vladimir Pastushak
VR Cub は、質の高いエントリーポイントを獲得するためのインジケーターです。このインジケーターは、数学的計算を容易にし、ポジションへのエントリーポイントの検索を簡素化するために開発されました。このインジケーターが作成されたトレーディング戦略は、長年にわたってその有効性が証明されてきました。取引戦略のシンプルさはその大きな利点であり、初心者のトレーダーでもうまく取引することができます。 VR Cub はポジション開始ポイントとテイクプロフィットとストップロスのターゲットレベルを計算し、効率と使いやすさを大幅に向上させます。取引の簡単なルールを理解するには、以下の戦略を使用した取引のスクリーンショットを見てください。 設定、設定ファイル、デモ版、説明書、問題解決方法は、以下から入手できます。 [ブログ] レビューを読んだり書いたりすることができます。 [リンク] のバージョン [MetaTrader 5] エントリーポイントの計算ルール ポジションをオープンする エントリーポイントを計算するには、VR Cub ツールを最後の高値から最後の安値までストレッチする必要があります。
Noize Absorption Index - is the manual trading system that measures the difference of pressure between bears forces and bulls forces. Green line - is a noize free index that showing curent situation. Zero value of index shows totally choppy/flat market.Values above zero level shows how powerfull bullish wave is and values below zero measures bearish forces.Up arrow appears on bearish market when it's ready to reverse, dn arrow appears on weak bullish market, as a result of reverse expectation. S
フィボナッチリトレースと拡張ラインツール DiNapoliポイント取引方法とゴールデンセクション取引を使用するトレーダーにとって理想的なMT4プラットフォームのフィボナッチリトレースと拡張ラインツール 主な特長: あなたはフィボナッチリトレースメントの複数のセットを直接描くことができ、重要なリターンポイント間の関係は一目瞭然です。 2.フィボナッチ拡張を描画することができます。 3.フィボナッチフォールドバックとラインの延長は、簡単な観察と数値表示のために左右に動かすことができます。 4.チャートは非常に爽やかな 5.数字キーでサイクルを切り替えることができます。 ファンクションキー: 1。 [戻るを押す、要求に応じて描画する、最大8つのグループにする 2。拡張]を描くには[押す] 3。 \を押すと、現在のサイクルの下にあるすべての拡張機能と折り畳みが削除されます 4。フォールドバックを移動して削除して展開する (1)最初のフォールドバックセットのF5行をクリックします。 一度クリックすると(黄色に変わります)、キーボードのDel
The Th3Eng PipFinite indicator is based on a very excellent analysis of the right trend direction with perfect custom algorithms. It show the true direction and the best point to start trading. With StopLoss point and Three Take Profit points. Also it show the right pivot of the price and small points to order to replace the dynamic support and resistance channel, Which surrounds the price. And Finally it draws a very helpful Box on the left side on the chart includes (take profits and Stop loss
Forex Gump
Andrey Kozak
2.75 (4)
Forex Gump is a fully finished semi-automatic trading system. In the form of arrows, signals are displayed on the screen for opening and closing deals. All you need is to follow the instructions of the indicator. When the indicator shows a blue arrow, you need to open a buy order. When the indicator shows a red arrow, you need to open a sell order. Close orders when the indicator draws a yellow cross. In order to get the most effective result, we recommend using the timeframes H1, H4, D1. There
Was: $249  Now: $99   Market Profile defines a number of day types that can help the trader to determine market behaviour. A key feature is the Value Area, representing the range of price action where 70% of trading took place. Understanding the Value Area can give traders valuable insight into market direction and establish the higher odds trade. It is an excellent addition to any system you may be using. Blahtech Limited presents their Market Profile indicator for the MetaTrader community. Ins
TWO PAIRS SQUARE HEDGE METER INDICATOR Try this brilliant 2 pairs square indicator It draws a square wave of the relation between your two inputs symbols when square wave indicates -1 then it is very great opportunity to SELL pair1 and BUY Pair2 when square wave indicates +1 then it is very great opportunity to BUY pair1 and SELL Pair2 the inputs are : 2 pairs of symbols         then index value : i use 20 for M30 charts ( you can try other values : 40/50 for M15 , : 30 for M30 , : 10 for H1 ,
This unique multi-currency strategy simultaneously determines the strength of trends and market entry points, visualizing this using histograms on the chart. The indicator is optimally adapted for trading on the timeframes М5, М15, М30, Н1. For the convenience of users, the indicator renders the entry point (in the form of an arrow), recommended take profit levels (TP1, TP2 with text labels) and the recommended Stop Loss level. The take profit levels (TP1, TP2) are automatically calculated for
PipFinite Exit EDGE
Karlo Wilson Vendiola
4.75 (77)
Did You Have A Profitable Trade But Suddenly Reversed? In a solid strategy, exiting a trade is equally important as entering. Exit EDGE helps maximize your current trade profit and avoid turning winning trades to losers. Never Miss An Exit Signal Again Monitor all pairs and timeframes in just 1 chart www.mql5.com/en/blogs/post/726558 How To Trade You can close your open trades as soon as you receive a signal Close your Buy orders if you receive an Exit Buy Signal. Close your Sell orde
We present you the indicator "Candle closing counter", which will become your indispensable assistant in the world of trading. That’s why knowing when the candle will close can help: If you like to trade using candle patterns, you will know when the candle will be closed. This indicator will allow you to check if a known pattern has formed and if there is a possibility of trading. The indicator will help you to prepare for market opening and market closure. You can set a timer to create a p
Binary Options Assistant (BOA) Multi Currency Dashboard for Binary Options (MT4) . You can use any of the BOA Signals Indicators with the dashboard. Just change the BOA Signals Indicator Name in the dashboard settings to the indicator you want to get signals from. For example: CHILL. BOA_BURN_Indicator_v1   Strategy :   Ana Trader Binary Options Strategy (MACD & Stochastic) BOA_COLD_Indicator_v1   Strategy :  Amalia Trader Binary Options Strategy (Keltner & Stochastic) BOA_CHILL_Indicator_
Strong Retracement Points Pro demo edition! SRP (Strong Retracement/Reversal Points) is a powerful and unique support and resistance indicator. It displays the closest important levels which we expect the price retracement/reversal! If all level are broken from one side, it recalculates and draws new support and resistance levels, so the levels might be valid for several days depending on the market! If you are still hesitating to start using this wonderful tool, you can check this link to see h
Improved version of the free HMA Trend indicator (for MetaTrader 4) with statistical analysis. HMA Trend is a trend indicator based on the Hull Moving Average (HMA) with two periods. HMA with a slow period identifies the trend, while HMA with a fast period determines the short-term movements and signals in the trend direction. The main differences from the free version: Ability to predict the probability of a trend reversal using analysis of history data. Plotting statistical charts for analyz
トレンドトレーディング は、タイミングのプルバックとブレイクアウトにより、市場で起こっているトレンドから可能な限り利益を得るように設計された指標です。確立されたトレンドの中で価格が何をしているかを分析することにより、取引の機会を見つけます。 [ インストールガイド | 更新ガイド | トラブルシューティング | よくある質問 | すべての製品 ] 自信を持って効率的に金融市場を取引する むち打ちにならずに確立されたトレンドから利益を得る 収益性の高いプルバック、ブレイクアウト、早期の逆転を認識する この指標は、独自の品質とパフォーマンスを分析します 複数時間枠のダッシュボードを実装します インジケーターは再描画されていません 電子メール/音声/視覚アラートを実装します 確立されたトレンドは多くの取引機会を提供しますが、ほとんどのトレンド指標はそれらを完全に無視しています。インジケーターの解釈はかなり簡単です: (1) トレンドの変化 (2) トレンドの方向への後退 (3) トレンドの方向へのブレイクアウト 赤いダッシュ は下降トレンド中の修正です 青いダッシュ は上昇ト
Owl smart levels
Sergey Ermolov
4.13 (23)
MT5版  |   FAQ Owl Smart Levels Indicator   は、 Bill Williams   の高度なフラクタル、市場の正しい波構造を構築する Valable ZigZag、エントリの正確なレベルをマークする Fibonacci レベルなどの一般的な市場分析ツールを含む 1 つのインジケーター内の完全な取引システムです。 利益を得るために市場と場所に。 戦略の詳細な説明 インジケータを操作するための指示 顧問-取引助手 プライベートユーザーチャット ->購入後に私に書いて、私はプライベートチャットにあなたを追加し、あなたはそこにすべてのボーナスをダウンロードすることができます 力はシンプルさにあります! Owl Smart Levels   取引システムは非常に使いやすいので、専門家にも、市場を勉強し始めて自分で取引戦略を選択し始めたばかりの人にも適しています。 戦略と指標に秘密の数式や計算方法が隠されているわけではなく、すべての戦略指標は公開されています。 Owl Smart Levels を使用すると、取引を開始するためのシグナルをすばやく確認し、
This is a trend indicator without redrawing Developed instead of the binary options strategy (by the color of the Martingale candlestick) Also works well in forex trading When to open trades (binary options) A signal will appear in the place with a candle signaling the current candle It is recommended to open a deal for one candle of the current timeframe M1 and M5 When a blue dot appears, open a deal up When a red dot appears, open a trade down. How to open trades on Forex. When a signal is rec
これは、キャンドルの終値を予測する指標です。 このインジケータは、主にD1チャートでの使用を目的としていますが. この指標は、従来の外国為替取引とバイナリオプション取引の両方に適しています。 インジケーターは、スタンドアロンのトレーディングシステムとして使用することも、既存のトレーディングシステムへの追加として機能させることもできます。 このインジケーターは、現在のキャンドルを分析し、キャンドル自体の内部の特定の強度係数と、前のキャンドルのパラメーターを計算します。 したがって、この指標は、市場の動きのさらなる方向性と現在のキャンドルの終値を予測します。 この方法のおかげで、この指標は、短期の日中取引だけでなく、中期および長期の取引にも適しています。 インジケーターを使用すると、市場の状況の分析中にインジケーターが生成する潜在的な信号の数を設定できます。 インジケーターの設定には、このための特別なパラメーターがあります。 また、インジケーターは、チャート上のメッセージの形式で、電子メールで、およびPUSH通知の形式で、新しい信号について通知することができます。 購入後は必ず私に書いて
Laguerre SuperTrend Clouds adds an Adaptive Laguerre averaging algorithm and alerts to the widely popular SuperTrend indicator. As the name suggests, Laguerre SuperTrend Clouds (LSC) is a trending indicator which works best in trendy (not choppy) markets. The SuperTrend is an extremely popular indicator for intraday and daily trading, and can be used on any timeframe. Incorporating Laguerre's equation to this can facilitate more robust trend detection and smoother filters. The LSC uses the impro
The Point61 indicator is the result of many years of monitoring of price behavior of currency pairs and metals. It is not a secret, that in times of uncertainty, traders are looking for possible levels of support and resistance - the point, where price should stop its movement. There are 2 possible scenarios at these points: 1. Reverse (correction) to the opposite direction; 2. Breakthrough to continue movement. Very often these points are used to set stop orders - TakeProfit or
This indicator is another variant of the famous powerful indicator Fibonacci-SS https://www.mql5.com/en/market/product/10136 but has different behaviour in placing Pending Order and TP Line. Automatically places Fibonacci retracement lines from the last highest and lowest visible bars on the chart with: An auto Pending Order (Buy/Sell). Taking Profit 1, Taking Profit 2 is pivot point and Taking Profit 3 for extended reward opportunity. The best risk and reward ratio. Simple and powerful indica
Wave WOLD MT4外国為替インジケータは、Wolf waveを検索し、取引端末の現在のウィンドウに表示するように設計されています。 取引でオオカミの波を使用するトレーダーのための優れた指標。 取引戦略への適用は、効率と収益性を大幅に向上させます。 指標に関する情報 他のWolf wave指標とは異なり、Wave WOLD MT4外国為替指標は、その有効性を大幅に高める多くの機能を備えています: 最初のものは開いているWindows5Pointパラメータ(真の値)情報サポートを提供します。つまり、Wolf waveが登場したチャートのウィンドウを展開します。 たとえば、EURUSD、AUDUSD、GBPUSDチャートが開いていて、それぞれにWave WOLD MT4インジケーターがインストールされている場合、ユーロモデルが検出されると、対応するチャートが自動的に他のチャートの上に前景に表示され、多数の商品を取引するときに非常に便利になります。  2番目の機能は、ユーザーが自分で選択できるパラメータ(デフォルト設定(12,26,9))であるmacd上の組み込みの発散分析で
Basic Support and Resistance インジケータは、テクニカル分析を強化するために必要なソリューションです。このインジケータを使用すると、チャートにサポートレベルとレジスタンスレベルを投影できます/ mt5バージョン 機能 フィボナッチレベルの統合: サポートと抵抗レベルとともにフィボナッチレベルを表示するオプションを使用すると、私たちの指標は市場行動と逆転領域の可能性についてさらに深い洞察を提供します。 パフォーマンスの最適化: 各バーの開口部のみで拡張ラインを更新するオプションを使用すると、インジケータは、サポートレベルと抵抗レベルの精度を犠牲にすることなく最適なパフォーマンスを保証します。 入力 メイン設定 Timeframe:  この入力を通じて、より高い時間枠のサポートラインとレジスタンスラインをチャート上に表示することを選択できます。 Support/Resistance Strength [Number of Bars]:  この入力を使用して、サポートと抵抗の強度を決定できます。数が高いほど、サポート/抵抗がより強くなります。 Pri
The indicator provides a superior alternative to price action analysis. It enables the identification of normalized patterns, which are then transformed into a graphical representation to forecast future steps within a time series. In the top-left corner, you'll find information regarding the expected prediction accuracy, determined through a complex MSQE calculation. You have the flexibility to adjust the time window, making it easy to validate the indicator's performance. Additionally, you can
フラットとトレンドを決定するための指標。 価格が2つのヒストグラムと2つの線(赤と青)のいずれかを下回っている場合、これは売りゾーンです。 このバージョンのインジケーターを購入するときは、1つの実際のアカウントと1つのデモアカウント用のMT4バージョン-ギフトとして(受け取るには、プライベートメッセージを書いてください)! 価格が2つのヒストグラムと2つの線(赤と青)のいずれかを上回っている場合、これは購入ゾーンです。 MT4バージョン: https//www.mql5.com/en/market/product/3793 価格が2つの線の間、またはいずれかのヒストグラムのゾーンにある場合、市場に明確な傾向はありません。簡単に言えば、市場は横ばいです。 インジケーターの動作は、スクリーンショットでより明確に示されています。
Awesome Oscillator by Bill Williams with the ability to fine-tune and replace the averaging algorithms of the indicator, which significantly expands the possibilities of using this oscillator in algorithmic trading and brings it closer in its properties to such an indicator as the MACD. To reduce price noise, the final indicator is processed with an additional Smooth averaging. The indicator has the ability to give alerts, send mail messages and push signals when the direction of movement of th
The indicator displays the data of the Stochastic oscillator from a higher timeframe on the chart. The main and signal lines are displayed in a separate window. The stepped response is not smoothed. The indicator is useful for practicing "manual" forex trading strategies, which use the data from several screens with different timeframes of a single symbol. The indicator uses the settings that are identical to the standard ones, and a drop-down list for selecting the timeframe. Indicator Parame
Title : Market Bias Indicator - Oscillator-Based Trading Tool Introduction : Discover the potential of the "Market Bias Indicator," a revolutionary oscillator-based trading tool designed for precise market analysis. If you're in search of a robust alternative to traditional bias indicators, your quest ends here. Market Bias Indicator offers unparalleled accuracy in identifying market sentiment and is your gateway to confident trading decisions. Recommended Trading Pairs : Market Bias Indicator i
インディケータは現在のクオートを作成し、これを過去のものと比較して、これに基づいて価格変動予測を行います。インジケータには、目的の日付にすばやく移動するためのテキスト フィールドがあります。 オプション: シンボル - インジケーターが表示するシンボルの選択; SymbolPeriod - 指標がデータを取る期間の選択; IndicatorColor - インジケータの色; HorisontalShift - 指定されたバー数だけインディケータによって描画されたクオートのシフト; Inverse - true は引用符を逆にします。false - 元のビュー。 ChartVerticalShiftStep - チャートを垂直方向にシフトします (キーボードの上下矢印)。 次は日付を入力できるテキストフィールドの設定で、「Enter」を押すとすぐにジャンプできます。
An indicator of pattern #31 ("Long Island") from Encyclopedia of Chart Patterns by Thomas N. Bulkowski. The second gap is in the opposite direction. Parameters: Alerts - show alert when an arrow appears   Push - send a push notification when an arrow appears (requires configuration in the terminal) GapSize - minimum gap size in points ArrowType - a symbol from 1 to 17 ArrowVShift - vertical shift of arrows in points   ShowLevels - show levels ColUp - color of an upward line ColDn - color of
このプロダクトを購入した人は以下も購入しています
Gann Made Easy は、ミスター・ギャンの理論を使用した取引の最良の原則に基づいた、プロフェッショナルで使いやすい外国為替取引システムです。 W・D・ガン。このインジケーターは、ストップロスとテイクプロフィットレベルを含む正確な買いと売りのシグナルを提供します。 PUSH通知を利用して外出先でも取引可能です。 購入後はご連絡ください!私の取引のヒントと素晴らしいボーナスインジケーターを無料で共有します! おそらく、ギャンの取引手法についてはすでに何度も聞いたことがあるでしょう。通常、ギャンの理論は初心者のトレーダーだけでなく、すでにある程度の取引経験がある人にとっても非常に複雑なものです。なぜなら、ギャンの取引手法は理論的にはそれほど簡単に適用できるものではないからです。私はその知識を磨き、最良の原則を私の外国為替インジケーターに組み込むために数年を費やしました。 このインジケーターは非常に簡単に適用できます。必要なのは、それをチャートに添付し、簡単な取引推奨事項に従うだけです。このインジケーターは常に市場分析の仕事を行い、取引の機会を探します。適切なエントリーポイントを検出
まず第一に、この取引インジケーターは再描画されず、再描画されず、遅延しないことを強調する価値があります。これにより、手動取引とロボット取引の両方に理想的なものになります。 ユーザーマニュアル:設定、入力、戦略。 アトミックアナリストは、価格の強さとモメンタムを利用して市場でより良いエッジを見つけるためのPA価格アクションインジケーターです。ノイズや誤ったシグナルを除去し、取引ポテンシャルを高めるための高度なフィルターを備えています。複雑なインジケーターの複数のレイヤーを使用して、アトミックアナリストはチャートをスキャンし、複雑な数学的計算をシンプルなシグナルと色に変換します。これにより、どのような初心者トレーダーでも理解して使用し、一貫した取引の決定を行うことができます。 「アトミックアナリスト」は、新規および経験豊富なトレーダー向けにカスタマイズされた包括的な取引ソリューションです。プレミアムインジケーターとトップノッチの機能を1つの取引戦略に組み合わせ、すべてのタイプのトレーダーにとって汎用性のある選択肢にします。 デイリートレーディングとスキャルピング戦略:高
Gold Stuff
Vasiliy Strukov
4.89 (201)
Gold Stuff は、金専用に設計されたトレンド指標であり、あらゆる金融商品にも使用できます。 インジケーターは再描画せず、遅れません。 推奨時間枠 H1. それインディケータでフルオートExpert Advisor EA Gold Stuffが動作します。 あなたは私のプロフィールでそれを見つけることができます. 設定と個人的なボーナスを得るために、購入後すぐに私に連絡してください! トレンド スキャナーの強力なサポートを利用して、無料のインジケーターを入手し、プライバシーを守ります。あーみー!   設定 矢印を描く - オンオフ。 チャートに矢印を描く。 アラート - 可聴アラートのオンオフ。 メール通知 - オンオフ。 電子メール通知。 プチ通知 - オンオフ。 プッシュ通知。 次に、色域を調整します。 Gold Stuff は、金専用に設計されたトレンド指標であり、あらゆる金融商品にも使用できます。 インジケーターは再描画せず、遅れません。 推奨時間枠 H1. それインディケータでフルオートExpert Advisor EA Gold Stuff
Trend Punch
Mohamed Hassan
5 (12)
This indicator is unstoppable when combined with our other indicator called  Support & Resistance . After purchase, send us a message and you will get it   for  FREE as a BONUS! Introducing Trend Punch , the revolutionary forex trend indicator that will transform the way you trade! Trend Punch is uniquely designed to provide precise buy and sell arrows during strong market trends, making your trading decisions clearer and more confident. Whether you're trading major currency pairs or exotic sym
An exclusive indicator that utilizes an innovative algorithm to swiftly and accurately determine the market trend. The indicator automatically calculates opening, closing, and profit levels, providing detailed trading statistics. With these features, you can choose the most appropriate trading instrument for the current market conditions. Additionally, you can easily integrate your own arrow indicators into Scalper Inside Pro to quickly evaluate their statistics and profitability. Scalper Inside
mql5と Telegramの モーニング・ブリーフィングで、詳細とスクリーンショットを含む毎日のマーケット・アップデートをご覧 ください! FX Power MT4 NGは 、長年の人気を誇る通貨強度計FX Powerの次世代モデルです。 この次世代ストレングスメーターは何を提供するのでしょうか?初代FXパワーの魅力すべて プラス GOLD/XAUの強さ分析 より正確な計算結果 個別に設定可能な分析期間 カスタマイズ可能な計算上限値により、さらに優れたパフォーマンスを実現 もっと見たい人のための特別なマルチインスタンス設定 すべてのチャートでお好みの色を無限に設定可能 数え切れないほどの通知オプションにより、重要なことを見逃すことはありません。 Windows 11とmacOSのスタイルで角を丸くした新しいデザイン 魔法のように動くインジケーターパネル FXパワーの主な機能 すべての主要通貨の強さの完全な履歴 すべての時間枠における通貨の強さの履歴 すべてのブローカーとチャートで同一の計算結果 100%信頼できるリアルタイム計算 -> リペイントなし ドロップダウン・リストから
Please contact me after purchase to immediately get your PDF strategy + documentation for Trend Pulse !  Official release price of $89  (1 /50 copies left). Next price is $199 . Introducing Trend Pulse , a unique and robust indicator capable of detecting bullish, bearish, and even ranging trends! Trend Pulse uses a special algorithm to filter out market noise with real precision. If the current symbol is moving sideways, Trend Pulse will send you a ranging signal, letting you know that it'
製品を購入する前に、以下の情報をお読みください。 Apollo Pips PLUS SP はユニークな製品です。これは、私の新しい「アポロ ピップス」インジケーターと、私のすべての取引インジケーターにアクセスできる「スーパー パック」ボーナスを手に入れたい人のためのものです。 Apollo Pips PLUS SP 製品を購入すると、実際には私の Apollo Pips インジケーターのまったく新しいバージョンを購入することになります。このバージョンのインジケーターには改良されたアルゴリズムと使いやすいパラメーターがあり、あらゆる市場およびあらゆる取引スタイルでインジケーターを使用する機会が得られます。 この製品の購入者は、私のスーパーボーナスとして、他のすべてのインジケーターにも無料でアクセスできます!私のすべての取引ツールにアクセスしたい場合は、この製品が最適です!:) しかし、これがすべてではありません!:) この製品のすべての購入者は、私の新しいインジケーターを無料で入手する資格もあります!:)新しい取引インジケーターを利用できるようになりました。私の特権のある「スーパー パッ
TPSpro TREND PRO は 、市場を自動的に分析し、トレンドとその各変化に関する情報を提供し、再描画せずに取引に参加するためのシグナルを提供するトレンド指標です。 インディケータは各ローソク足を使用し、個別に分析します。さまざまなインパルス(アップまたはダウンインパルス)を指します。通貨、仮想通貨、金属、株、指数の取引への正確なエントリーポイント! バージョンMT5                   インジケーターの完全な説明   インジケーター -   RFI LEVELS と併用することをお勧めします。 主な機能: レンダリングなしで正確な入力信号! シグナルが表示された場合、それは関連性を維持します。これは、シグナルを提供してからそれを変更する可能性があり、入金時の資金の損失につながる可能性があるリドローインジケーターとの重要な違いです。より高い確率と精度で市場に参入できるようになりました。矢印が表示された後、ターゲットに達する (利益確定) か反転シグナルが表示されるまで、ローソク足を色付けする機能もあります。 STOP LOSS / TAKE PROFIT
まず第一に、この取引ツールはノンリペイント、ノンリドロー、ノンラグの指標であり、プロの取引に理想的ですことを強調する価値があります。 オンラインコース、ユーザーマニュアル、デモ。 スマートプライスアクションコンセプトインジケーターは、新米から経験豊富なトレーダーまで、非常 に強力なツールです。Inner Circle Trader AnalysisやSmart Money Concepts Trading Strategiesなど、20以上の有用な指標を1つに組み合わせています。このインジケーターはスマートマネーコンセプトに焦点を当て、大手機関の取引方法を提供し、彼らの動きを予測するのに役立ちます。 特に、流動性分析に優れており、機関がどのように取引しているかを理解しやすくしています。市場のトレンドを予測し、価格の動きを慎重に分析するのに優れています。機関の戦略とトレードを合わせることで、市場の動向についてより正確な予測ができます。このインジケーターは多目的であり、市場構造を分析し、重要な注文ブロックを特定し、さまざまなパターンを認識するのに優れています。 このインジケー
- Real price is 80$ - 40% Discount ( It is 49$ now ) Contact me for instruction, any questions! Introduction The breakout and retest strategy is traded support and resistance levels. it involves price breaking through a previous level.  The break and retest strategy is designed to help traders do two main things, the first is to avoid false breakouts. Many false breakouts start with a candlestick that breaks out of a level but ends with an immediate candlestick that brings the price back into t
通貨強さウィザードは、取引を成功させるためのオールインワン ソリューションを提供する非常に強力な指標です。このインジケーターは、複数の時間枠のすべての通貨のデータを使用して、このまたはその外国為替ペアのパワーを計算します。このデータは、使いやすい通貨インデックスと通貨パワーラインの形式で表され、特定の通貨のパワーを確認するために使用できます。 必要なのは、取引したいチャートにインジケーターを接続することだけです。インジケーターは、取引する通貨の実際の強さを示します。このインジケーターは、トレンドに合わせて取引するときに有利に利用できる売買高の圧力の極値も示します。このインジケーターには、フィボナッチに基づく可能なターゲットも表示されます。 このインジケーターは、PUSH 通知を含むあらゆるタイプのアラートを提供します。 購入後ご連絡下さい。私の取引のヒントをあなたと共有し、素晴らしいボーナスインジケーターを無料で提供します! 幸せで有益な取引をお祈りします。
最初のパルスレベルを反転 (RFI)     指示する     ロシア     -        utilizar con   el indicador の ESP 推奨事項 -   TPSpro トレンド プロフェッショナル版 -   MT5のバージョン 最も重要なことは、将来においても最も重要なことです。 機能のプリンシパル: ゾーンのほとんどは、ベンダーとコンプラドールによってアクティブ化されます。 状況を直感的に把握できるよう、初期の衝動を修正します。 LOGIC AI: MUESTRA zonas (círculos) parabuscar puntos de entrada cuando se activa una plantilla 視覚的に優れた視覚効果があり、最も重要な機能がすべて揃っていることに注意してください。 優れたニベレス/ゾーンの視覚化 (modo MTF) 世界で最も人気のある場所/ゾーンです。これを使用するのに最適な方法です (   TPSproTREND PRO   )。 アルゴリズム プロフェッショナル セパラド パソ ア パソ パラ オペラ それは
現在31%オフ! 初心者やエキスパートトレーダーに最適なソリューション! このインジケータは、独自の機能と秘密の数式を組み込んだ、ユニークで高品質かつ手頃な価格のトレーディングツールです。たった1枚のチャートで28の通貨ペアのアラートを表示します。新しいトレンドやスキャルピングチャンスの引き金となるポイントを正確に把握することができるので、あなたのトレードがどのように改善されるか想像してみてください! 新しい基本的なアルゴリズムに基づいて構築されているため、潜在的な取引の特定と確認がより簡単になります。これは、通貨の強さや弱さが加速しているかどうかをグラフィカルに表示し、その加速のスピードを測定するためです。加速すると物事は明らかに速く進みますが、これはFX市場でも同じです。つまり、反対方向に加速している通貨をペアにすれば、利益を生む可能性のある取引を特定することができるのです。 通貨の勢いを示す縦の線と矢印は、あなたの取引の指針となるでしょう。 ダイナミックマーケットフィボナッチ23レベルはアラートトリガーとして使用され、市場の動きに適応します。もしインパルスが黄色
今、147ドル(いくつかの更新後に499ドルに増加します) - 無制限のアカウント(PCSまたはMac) RelicusRoad ユーザー マニュアル + トレーニング ビデオ + プライベート Discord グループへのアクセス + VIP ステータス 市場の新しい見方 RelicusRoad は、外国為替、先物、暗号通貨、株式、および指数の世界で最も強力な取引インジケーターであり、トレーダーに収益を維持するために必要なすべての情報とツールを提供します。初心者から上級者まで、すべてのトレーダーが成功するためのテクニカル分析と取引計画を提供します。これは、将来の市場を予測するのに十分な情報を提供する重要な取引指標です。意味をなさないチャート上のいくつかの異なる指標ではなく、完全な解決策を信じています.これは、信号、矢印 + 価格アクション情報を表示するオールインワンのインジケーターで、他に類を見ない非常に正確です。 強力な AI に基づいて、RelicusRoad は不足している情報とツールを提供して、あなたを教育し、トレーディングのプロ、成功したトレーダーにします。
現在20%OFF! 初心者やエキスパートトレーダーのためのベストソリューション! このダッシュボードソフトウェアは、28の通貨ペアで動作しています。それは私達の主要な指標(高度な通貨の強さ28と高度な通貨インパルス)の2に基づいています。それは全体の外国為替市場の大きい概観を与えます。それは、すべての(9)時間枠で28の外国為替ペアのための高度な通貨の強さの値、通貨の動きの速度と信号を示しています。チャート上で1つのインディケータを使用して市場全体を観察し、トレンドやスキャルピングの機会をピンポイントで見つけることができたら、あなたのトレードがどのように改善されるか想像してみてください。 このインディケータには、強い通貨と弱い通貨の識別、潜在的な取引の識別と確認がより簡単になるような機能が搭載されています。このインディケータは、通貨の強さや弱さが増加しているか減少しているか、また、すべての時間枠でどのように機能しているかをグラフィカルに表示します。 新機能として、現在の市場環境の変化に適応するダイナミックなマーケットフィボナッチレベルが追加され、すでに当社のAdvan
現在26%オフ 初心者やエキスパートトレーダーに最適なソリューション! このインジケーターは、独自の機能と新しい計算式を取り入れた、ユニークで高品質、かつ手頃な価格のトレーディングツールです。たった1枚のチャートで28の為替ペアの通貨強度を読み取ることができます。新しいトレンドやスキャルピングチャンスの引き金となるポイントを正確に特定することができるので、あなたのトレードがどのように改善されるか想像してみてください。 ユーザーマニュアルはこちら  https://www.mql5.com/en/blogs/post/697384 これが最初の1本、オリジナルだ! 価値のないクローンを買わないでください。 特別な サブウィンドウの矢印で強い通貨の勢いを表示 GAPがあなたのトレードを導く! 基準通貨や気配値が売られすぎ・買われすぎのゾーン(外相フィボナッチレベル)にあるとき、個別チャートのメインウィンドウに警告表示。 通貨がレンジの外側から反落した場合、プルバック/リバーサルのアラート。 クロスパターンの特別なアラート 複数の時間枠を選択可能で、トレンドを素早く
Trend Screener
STE S.S.COMPANY
4.79 (81)
トレンドインジケーター、1つのツールに組み込まれたすべての重要なトレンド機能を備えたトレンドトレーディングとフィルタリングのための画期的なユニークなソリューション! これは、すべてのシンボル/商品(外国為替、商品、暗号通貨、インデックス、株式)で使用できる100%再描画されていないマルチタイムフレームおよびマルチ通貨インジケーターです。 トレンドスクリーナーは、チャート内のドットで矢印トレンドシグナルを提供するインジケーターに続く効率的なインジケーターです。 トレンド分析インジケーターで使用できる機能: 1.トレンドスキャナー。 2.最大利益分析を備えたトレンドライン。 3.トレンド通貨強度メーター。 4.アラート付きのトレンド反転ドット。 5.アラート付きの強いトレンドドット。 6.トレンド矢印 毎日の分析例、毎日のシグナルパフォーマンス...など、トレンドスクリーナーインジケーターを使用して、ここで見つけることができます: ここをクリックしてください 期間限定オファー:トレンドスクリーナーインジケーターは、50ドルと生涯でのみご利用いただけます。 (元の価格125 $) MQ
Clear Breakout
Martin Alejandro Bamonte
「Breakout Buy-Sell」インジケーターは、異なる市場セッション(東京、ロンドン、ニューヨーク)での価格ブレイクアウトに基づいて、潜在的な売買機会を識別し、強調するために設計されています。このインジケーターは、トレーダーが買いゾーンと売りゾーン、および利益確定(TP)とストップロス(SL)レベルを明確に視覚化するのに役立ちます。 使用戦略 インジケーターは以下のように使用できます: 初期設定 :市場セッションを選択し、GMTオフセットを調整します。 市場の視覚化 :各セッションの開始時に描かれるブレイクアウトボックスを観察します。これらのボックスは期間の高値と安値を示します。 売買シグナル :ボックスの高値を超えた場合は買いシグナルと見なされます。安値を下回った場合は売りシグナルと見なされます。 リスク管理 :TP1、TP2、TP3、およびSLレベルを使用してポジションを管理します。TPレベルは異なる利益目標のために設計されており、SLは不利な動きに対する保護を保証します。 応用戦略 このインジケーターを最大限に活用するために、以下の戦略が推奨されます: ロンドンセッション
Gold Channel is a volatility-based indicator, developed with a specific timing algorithm for the XAUUSD pair, which consists of finding possible corrections in the market. This indicator shows two outer lines, an inner line (retracement line) and an arrow sign, where the theory of the channel is to help identify overbought and oversold conditions in the market. The market price will generally fall between the boundaries of the channel. If prices touch or move outside the channel it is a tra
ご紹介   クォンタム トレンド スナイパー インジケーターは 、トレンド反転を特定して取引する方法を変革する画期的な MQL5 インジケーターです。 13年以上の取引経験を持つ経験豊富なトレーダーのチームによって開発されました。     クォンタムトレンドスナイパーインジケーター   は、非常に高い精度でトレンドの反転を識別する革新的な方法で、あなたのトレーディングの旅を新たな高みに押し上げるように設計されています。 ***Quantum Trend Sniper Indicatorを購入すると、Quantum Breakout Indicatorを無料で入手できます!*** クォンタム ブレイクアウト インジケーターは、トレンドの反転を特定するとアラートを発し、矢印を示し、3 つのテイクプロフィットレベルを提案します。 初心者トレーダーにもプロのトレーダーにも適しています。 量子EAチャネル:       ここをクリック MT5のバージョン:       ここをクリック 推奨事項: 期間: すべての時間枠。最良の結果を得るには、
PRO Renko Systemは、特別にRENKOチャートを取引するために設計された高精度の取引システムです。 これは、様々な取引商品に適用することができる普遍的なシステムです。 システムは効果的に正確な逆転信号へのアクセスを与えるいわゆる市場の騒音を中和する。 表示器は非常に使いやすく、信号の生成に責任がある1つの変数だけがあります。 あなたは簡単にお好みの任意の取引ツールとレンコバーのサイズにツールを適応させることができます。 私はいつもあなたが私のソフトウェアで収益性の高い取引を支援するために余分なサポートを提供する準備ができています! 私はあなたに幸せで収益性の高い取引をしたいです! ご購入後にご連絡ください! 私はあなたに私のレンコチャートジェネレータを送信します。 私はまた、私の個人的な推奨事項やシステムの他のモジュールを無料で共有します!
`All in One Chart Patterns` チャートパターンはトレーダーの間で議論の的となっています。信頼できるシグナルだと考える人もいれば、そうでないと考える人もいます。当社の「Chart Patterns All-in-One」インジケーターは、これらのパターンを表示し、自分自身で理論を検証できるようにします。これらのパターンの収益性は、インジケーターの有効性を反映するものではなく、むしろパターン自体の評価です。「Chart Patterns All-in-One」インジケーターは、これらのパターンを視覚化するための優れたツールであり、取引戦略における有効性について自分自身で結論を下すことができます。 このインジケーターは、複数のチャートパターンを1つの統合ツールに組み合わせて、MetaTrader 4 (MT4) で使用します。チャートから直接各パターンをオンまたはオフに切り替える機能を提供し、カスタマイズ可能で効率的な分析を可能にします。以下は、インジケーターとその中に含まれるパターンの詳細な説明です。 #### 含まれるパターン: 1. **パターン
ICT, SMC, SMART MONEY CONCEPTS, SMART MONEY, Smart Money Concept, Support and Resistance, Trend Analysis, Price Action, Market Structure, Order Blocks, BOS/CHoCH,   Breaker Blocks ,  Momentum Shift,   Supply&Demand Zone/Order Blocks , Strong Imbalance, HH/LL/HL/LH,    Fair Value Gap, FVG,  Premium  &   Discount   Zones, Fibonacci Retracement, OTE, Buy Side Liquidity, Sell Side Liquidity, BSL/SSL Taken, Equal Highs & Lows, MTF Dashboard, Multiple Time Frame, BigBar, HTF OB, HTF Market Structure, 
NAM Order Blocks
NAM TECH GROUP, CORP.
5 (1)
MT4マルチタイムフレームオーダーブロック検出インジケーター。 特徴 -チャートコントロールパネルで完全にカスタマイズ可能で、完全な相互作用を提供します。 -必要な場所でコントロールパネルを表示および非表示にします。 -複数の時間枠でOBを検出します。 -表示するOBの数量を選択します。 -さまざまなOBユーザーインターフェイス。 -OBのさまざまなフィルター。 -OB近接アラート。 -ADRの高線と低線。 -通知サービス(画面アラート|プッシュ通知)。 概要 注文ブロックは、金融機関や銀行からの注文収集を示す市場行動です。著名な金融機関と中央銀行が外国為替市場を牽引しています。したがって、トレーダーは市場で何をしているのかを知る必要があります。市場が注文ブロックを構築するとき、それは投資決定のほとんどが行われる範囲のように動きます。 注文の構築が完了すると、市場は上向きと下向きの両方に向かって急激に動きます。注文ブロック取引戦略の重要な用語は、機関投資家が行っていることを含むことです。それらは主要な価格ドライバーであるため、機関投
Order Block Hunter
Noha Mohamed Fathy Younes Badr
5 (1)
Order block hunter indicator is the best indicator for  hunt the order blocks that area where there has been a large concentration of limit orders waiting to be executed Order blocks are identified on a chart by observing previous price action and looking for areas where the price experienced significant movement or sudden changes in direction .This indicator does that for you by using very complicated codes and helps you to take the best areas To buy and sell because it make marks at the best a
Scalper Vault は、スキャルピングを成功させるために必要なすべてを提供するプロフェッショナルなスキャルピング システムです。このインジケーターは、外国為替およびバイナリー オプションのトレーダーが使用できる完全な取引システムです。推奨される時間枠は M5 です。 システムは、トレンドの方向に正確な矢印シグナルを提供します。また、トップとボトムのシグナルとギャン マーケット レベルも提供します。 インジケーターは、プッシュ通知を含むすべてのタイプのアラートを提供します。 インジケータの購入後にご連絡ください。私の個人的な取引の推奨事項と素晴らしいボーナス指標を無料で共有します! 幸せで有益な取引をお祈りします!
M1 Arrow
Oleg Rodin
4.67 (12)
市場の2つの基本原則に基づく日中戦略。 このアルゴリズムは、追加のフィルターを使用したボリュームと価格の波の分析に基づいています。インディケータのインテリジェントアルゴリズムは、2つの市場要因が1つに結合した場合にのみシグナルを出します。インディケータは、より高い時間枠のデータを使用して、M1チャート上の特定の範囲の波を計算します。そして波を確認するために、インジケーターはボリュームによる分析を使用します。 このインディケータはレディトレーディングシステムです。トレーダーが必要とするのは、信号に従うことだけです。また、インジケーターはあなた自身の取引システムの基礎になることができます。取引はミニッツチャートでのみ行われます。 インジケーターがMTFの原則を使用しているという事実にもかかわらず、インジケーターのアルゴリズムは可能な限り安定しています。 購入後、必ず私に書いてください!私の取引設定と推奨事項をあなたと共有します!
Advanced Supply Demand
Bernhard Schweigert
4.9 (271)
現在33%オフ 初心者にもエキスパートトレーダーにも最適なソリューション このインジケーターは独自の機能と新しい公式を多数内蔵しており、ユニークで高品質かつ手頃な取引ツールです。このアップデートでは、2つの時間枠ゾーンを表示できるようになります。より長いTFだけでなく、チャートTFとより長いTF(ネストゾーンを表示)の両方を表示できます。すべてのSupply Demandトレーダーの皆さんのお気に召すはずです。:) 重要情報の公開 Advanced Supply Demandの可能性を最大化するには、 https://www.mql5.com/ja/blogs/post/720245 にアクセスしてください。   エントリーまたはターゲットの正確なトリガーポイントを正確に特定できれば取引がどのように改善されるか想像してみてください。新しい基盤となるアルゴリズムに基づいて構築されているため、買い手と売り手の間の潜在的な不均衡をさらに簡単に特定できます。これは、最も強い需要と供給のゾーンと、過去のパフォーマンス(古いゾーンを表示)がグラフィカルに表現されるためです。これらの機能は、最適
IX Powerは 、FX Powerの無敵の精度をついにFX以外のシンボルにも提供します。 お気に入りの指数、株式、コモディティ、ETF、さらには暗号通貨の短期、中期、長期のトレンドの強さを正確に判断します。 お使いの端末が提供する すべてを分析する ことができます。ぜひお試しいただき、取引 タイミングが大幅に改善 されることをご体験ください。 IXパワーの主な特徴 100%正確で再描画されない計算結果 - ターミナルで利用可能なすべての取引シンボルに対して 予め設定され、さらに個別に設定可能な強度分析期間のドロップダウン選択 Eメール、メッセージ、モバイル通知による無数の通知オプション EAリクエストのためのアクセス可能なバッファ カスタマイズ可能な計算制限により、さらに優れたパフォーマンスを実現 もっと見たい人のための特別なマルチインスタンス設定 すべてのチャートでお好みの色を無限に設定可能 Windows 11とmacOSのスタイルで角を丸くした新しいパネルデザイン サブ・ウィンドウとメイン・チャートの間をシームレスに移動する、魔法のように動く
作者のその他のプロダクト
Oxide
Evgeniy Zhdan
5 (1)
The algorithm of the Expert Advisor determines the angle of the "expanding triangle" pattern and starts working when the price touches one of the triangle's sides. The trades are filtered by the delay characteristic of the RSI indicator. After opening a deal, the EA sets the mandatory take profit and stop loss and manages the deal it with a tight trailing stop. The Max Spread parameter sets the maximum spread, exceeding which (by spread expansion) will prevent opening deals. The default settings
フラットとトレンドを決定するための指標。 価格が2つのヒストグラムと2つの線(赤と青)のいずれかを下回っている場合、これは売りゾーンです。 このバージョンのインジケーターを購入するときは、1つの実際のアカウントと1つのデモアカウント用のMT4バージョン-ギフトとして(受け取るには、プライベートメッセージを書いてください)! 価格が2つのヒストグラムと2つの線(赤と青)のいずれかを上回っている場合、これは購入ゾーンです。 MT4バージョン: https//www.mql5.com/en/market/product/3793 価格が2つの線の間、またはいずれかのヒストグラムのゾーンにある場合、市場に明確な傾向はありません。簡単に言えば、市場は横ばいです。 インジケーターの動作は、スクリーンショットでより明確に示されています。
Divergence indicator 10 different indicators. Finding and displaying classic and hidden divergences. Indicators in which divergences are searched: MACD MACD Histogram; RSI; Stochastic; CCI; momentum; OBV; VWmacd; Chaikin Money Flow; Money Flow Index. This is a replica of the indicator from the   tradingview   resource, adapted for the MT5 terminal. MT4 version available here:  https://www.mql5.com/en/market/product/87846 Settings: Bars in history for analysis - number of bars for analysis
SuperTrend
Evgeniy Zhdan
2.5 (2)
The Supertrend Expert Advisor The Supertrend Expert Advisor with averaging elements. It has been developed during three months until I finally got good results. It is not a scalper. The minimum balance to start trading - 100 $. Is automatically adjusted to the 4 and 5-digit prices. Has an efficient risk management system. The lot and limit on the maximum lot is automatically calculated based on the settings specified in the EA. As a result, you have a complete automated trading system. Download
StarDust searches for divergences in the values of several indicators considering them as signs of flat and enters the market if a relatively steady trend is detected. The Expert Advisor trades "basic" symbols with a low spread. The best results are achieved on М15. The EA automatically adjusts to 4 and 5-digit quote flows. Settings Comment_to_orders – comment to a placed order. The field can be left blank if no comment is required. MM – enable money management with automatic setting of a work
The EA catches the price when it moves against the trend in an effort to open an order in an opposite direction (direction of the main trend). Screenshots illustrate examples of entries and the strategy gist. The EA uses stop losses depending on values of ATR. Settings: Lot_ - if Risk_ = 0, the EA will trade this lot; Risk_ - risk per one trade. Stop loss is taken into account; koeff_ATR - coefficient multiplied by the ATR value to calculate stop loss (the bigger the value, the bigger stop los
The FastBoom EA finds the most probable points of price pullback/reverse and places an order. It places averaging orders if the price moves further against take profit. Settings of the EA: Lots - initial lot; LotExponent - multiplier for following orders (Martingale). 1 - no multiplier. TakeProfit - take profit in points; Stochastic Settings InpKPeriod - K Period of Stochastic InpDPeriod - D Period of Stochastic InpSlowing - Stochastic Slowing LevHigh - level for sell positions of Stochastic
The Expert Advisor calculates the double/triple divergence of volumes, and starts trading. It uses a unique formula of lot calculation, which greatly improves stability of trading. Recommended TF - 1h. Currency pair - EURUSD , but the EA can be used on any trading instruments which are not subject to high volatility. Settings mode - trading direction can be set manually; close - order close level (details on the screenshot); Step between orders - step between orders in points; Maximum orders -
The Expert Advisor opens orders from the horizontal line, the a trader can set on any level by dragging using the mouse or by changing the line properties. For example, when a horizontal line is above the current price, the EA will open a Buy order once the horizontal line is reached. And vice versa: If the line is below the current price, the EA will open a sell order once the line is crossed. A buy crossover of the line is: opening of the current candlestick below the horizontal line; the curr
SellerATR
Evgeniy Zhdan
5 (1)
The Expert Advisor only sells. Recommended currency pairs : EURUSD; GBPUSD; USDCHF; USDJPY; USDCAD; AUDUSD; EURGBP; EURAUD; EURCHF; EURJPY; GBPCHF; CADJPY; GBPJPY; AUDNZD; AUDCAD; AUDCHF; AUDJPY; CHFJPY; EURNZD; EURCAD; CADCHF; NZDJPY; NZDUSD. Timeframe: H1. Percent% manages closing both loss-making and profitable deals based on the account overall status. Using the EA on 23 symbols mentioned above allows the robot to cope with the drawdown in case of a long trend. While positions on some pairs
Illusion
Evgeniy Zhdan
3 (2)
The Illusion EA uses the probability theory - after a series of consecutive virtual losses - i.e. right during a flat the EA already starts trading in the trend. In addition, the EA considers the ratio of bullish/bearish candles on the higher timeframes to determine the greatest probability of the price movement direction. Only 1 order can be opened at a time. In case of a loss the following order will be placed with an increased lot (the multiplication coefficient is set in the parameters). The
インディケータは、最も可能性の高いトレンドストップ/反転エリア、自信のあるトレンド移動エリアを計算します。 計算では次のことが考慮されます。 価格変動率; チャートの相対偏差角度。 価格変動の平均振幅。 その「コンフォートゾーン」を離れる価格。 ATRインジケーターの値。 インジケーターは、価格がストップ/リバーサルエリアに入るとアラートを生成できます。 設定 全長を描きますか? -チャートの最後まで領域を描画します。 Show StopUP-trend-上昇トレンドのストップ/反転エリアを表示します。 上昇トレンドを表示-自信を持って上昇トレンドの領域を表示します。 下降トレンドを表示-自信を持って下降トレンドの領域を表示します。 Show StopDOWN-trend-下降トレンドのストップ/反転エリアを表示します。 エリア変更のアラート-価格がトレンドストップ/変更エリアに入ったときにアラートを生成します。 次は、各商圏の色設定です。
インディケータの主な目的は、トレンドの方向、パワー、および潜在的な反転を定義して、各キャンドルの平均価格勾配の2乗(高-低)の比率を計算することです。 計算に基づいて、インジケーターは次のことを示します。 トレンド反転; トレンドの方向性; トレンドパワー。 推奨される時間枠はM1とM5です。 この場合、インジケーターはM15の時間枠のトレンド方向に基づいています。 M5よりも高い時間枠で作業する場合、インジケーターは分析でより高い時間枠を使用しません。 信号が互いに一致する場合、たとえば: 現在のSugnal:購入; トレンドパワー:強い; トレンドの方向性:UP。 また 現在のSugnal:SELL; トレンドパワー:強い; トレンドの方向性:DOWN、 適切な方向で市場に参入することを検討してください。 インディケータは、スタンドアロンの取引システムとして、または他のシステムへの追加として使用できます。 設定 情報の位置-テキストの接続角度。 情報テキスト-テキストの色; ポップアップサウンドアラート-ポップアップ信号アラート。 電子メー
The indicator plots a trend line and determines the levels for opening trades, in case the price goes "too far" away from the trend level. More detailed information is available in the screenshots. Settings Away from the trend line - distance from the trend line to the trades level; Arrow Signal for deals - enable displaying an arrow when the price reaches the trades level; Size of Arrow - size of the arrow; Alert Signal for deals - enable generating alerts when the price reaches the trades le
Turbina
Evgeniy Zhdan
5 (2)
The axiom of the Forex market is that any trend will be broken. The Expert Advisor determines trend direction (the pink line), and calculates levels for opening opposite orders depending on the settings. The value of Away from the trend line for Deal will be different for each pair and timeframe, depending on the volatility of the trading instrument. Next orders can be opened with an increased lot (a static lot is used by default). See the screenshots to understand the idea of the Expert Advisor
The Expert Advisor determines the moments of strong movements and opens a position in the direction of the most probable price movement. The strategy always uses stop loss and take profit. Several independent orders can be in the market (the maximum number is set in parameters). The goal of the EA's underlying trading system is the quantitative excess of the number of profitable deals over the number of losing ones. Recommended: EURUSD 5m; GBPUSD 5m; USDJPY 5m. The Expert Advisor is able to work
Vise is a trend indicator. The upper and lower lines follow the price showing the prevailing price direction. Frequent breakthroughs of the upper line indicate a bullish trend, while frequent breakthroughs of the lower line indicate a bearish one. Parameters Points for UpLine - initial number of points for the upper line; Points for DownLine - initial number of points for the lower line. During the breakthrough of the upper level (line), this level shifts upwards by Points for UpLine. If the u
Twinkle is a trend-based scalper using stop loss and take profit invisible to the broker. The EA does not look for trend reversals. The EA catches strong market movements and opens orders in the direction of the trend. Your broker will not see the order closing levels. The EA closes orders independently when reaching the take profit or stop loss levels specified in the settings. Recommended trading symbols: EURUSD M5, GBPUSD M5. ECN accounts with 5 digits quotes are recommended. Expert Advisor
Shine
Evgeniy Zhdan
4.75 (4)
This Expert Advisor implements elements of the Martingale system. Orders are opened at a specified distance from the moving average. The Parabolic SAR indicator and certain technical details are used to ensure the most accurate entries. The EA is highly customizable. It is recommended for simultaneous use on 4 currency pairs: EURUSD M15; GBPUSD M15; USDJPY M15; USDCAD M15. Despite good stability, it is advisable to disable the EA operation during the days rich in news releases. Configurations
SolaceSystem is a trend scalper. The Expert Advisor algorithm calculates price consolidation levels and opens trades if a strong market movement is expected. The Parabolic SAR standard indicator is used to filter trade opening. Distinctive features Martingale is not used. Does not accumulate loss. Uses take profit and stop loss. Trades are closed either by TP and SL, or using a unique trailing stop algorithm. Automatic lot calculation. The Expert Advisor is fully ready for long-term automated
LuckyCase is an Expert Advisor with martingale elements. The EA strategy is based on a significant "deviation" of the price from SAR inadicator and the Bands levels breakthrough point. The money management system is an essential part of the EA. It starts working after a trade is opened. Trades are closed after accumulating specified points of market orders, by deposit % or after an opposite side of the channel is broken through. The default EA settings are meant for: EURUSD M15; USDJPY M15. The
The Elize Expert Advisor has been designed to work with the EURCHF currency pair. It considers the peculiarities of this trading instrument, its behavior and dependence on the behavior of other currencies. In particular, when the currencies of the European countries (EURUSD, GBPUSD, EURNOK, EURCHF) move in the same direction, the EA starts its operation and opens a deal in the trend direction of the European currencies. In the event of price rollbacks, the EA uses a unique method for making the
The indicator determines the support/resistance lines on three timeframes simultaneously: one TF smaller; current TF; one TF higher. In addition to the support/resistance lines, the indicator identifies the reversal points (wave peaks): red dots - peaks on the smallest timeframe; yellow points - peaks on the current timeframe. Support: https://www.mql5.com/en/channels/TrendHunter Parameters Show trend line - show the main trend line. Main Trend Line Color - color of the trend line. Show trend te
The Expert Advisor has been specifically developed for trading gold (Spot Gold). The strategy is based on Fibo levels calculated from the previous (first) candle High/Low and the width of the current and lower timeframes channel. If important Fibo levels of different orders are located in a single price channel (within a spread), the EA defines this channel as the target for price movement and starts operation. Martingale and averaging are not used. Each order is independent and is accompanied b
The algorithm of this Expert Advisor determines the significant price levels, where the trend often turns into a flat or reverses. Stochastic Oscillator serves as an additional filter of overbought/oversold zones. The EA sets stop loss and take profit after opening an order. The underlying trailing strategy applies a trailing stop. The EA is recommended for simultaneously use on three trading instruments: EURUSD M5, GBPUSD M5, EURCHF M5. Settings: Comment to order - comment to orders. MaxRisk -
The Expert Advisor looks for technical analysis patterns formed on the higher (hourly) timeframe to start working on the 5-minute chart. Technical analysis patterns used: double top/double bottom, head/shoulders, flag, expanding/narrowing triangles. The Relative Vigor Index technical indicator is used as the filter for opening deals. It is based on the idea that on the bull market the closing price is, as a rule, higher, than the opening price. It is the other way round on the bear market. This
The Expert Advisor calculates the divergence on the current and higher timeframes. In case the divergences coincide, the EA starts its operation. Deals have strict take profit and stop loss levels. Each deal is managed by trailing stop. The strategy involves the use of a tight stop-loss. Therefore, losing deals and/or series of losing deals are not uncommon. This EA is not suitable for those who have difficulties coping with losing deals. The EA is recommended for simultaneous use on the followi
The Expert Advisor has been developed specifically for the features of the CHFJPY currency pair. The EA's algorithm determines the direction of the current trend and starts operation. In case of a price reversal within the current trend, the EA adds additional orders. If trend changes, the EA starts to work in the direction contrary to the initial grid of orders. If there were no conditions for closing orders and the trend direction changed again, the EA continues to work with the "first" grid o
The Expert Advisor algorithm determines on daily charts those candlestick patterns, which set the intraday trading direction. The trading EA determines how long the price is moving in overbought/oversold zones and starts working in the direction of the expected trend movement. Each position is accompanied with a tight stop loss and take profit. Only one active position can be open in the market. The EA was developed and tested using 99% quality quotes. The Expert Advisor has a built-in news filt
The strategy of this Expert Advisor is based on a hedging system, which implies placing opposite orders. The EA algorithm determines trend beginning and opens a position in the trend direction. In case of a wrong entry, the EA tries to neutralize the drawdown through opposite (hedging) orders at a preset interval (Coefficient of counter orders). Orders are closed when one of the two values ​​is reached - profit in percent or profit in points. The EA does not use lot increase. The EA wast tested
フィルタ:
レビューなし
レビューに返信