Probability Indicator
- インディケータ
- Steven Brown
- バージョン: 1.1
- アップデート済み: 5 9月 2018
- アクティベーション: 5
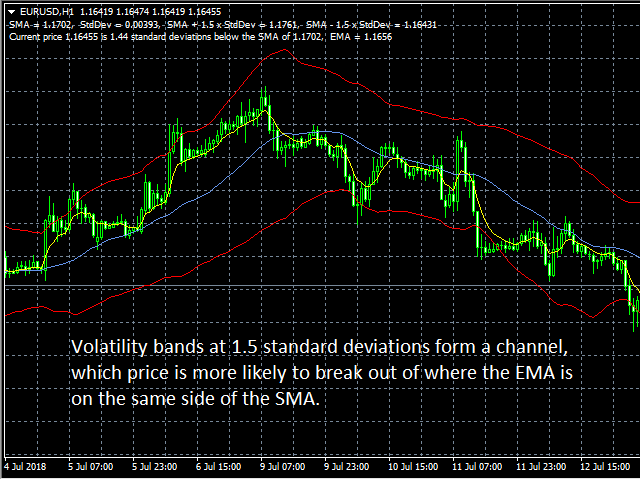
Probability Indicator displays volatility bands on the price chart and calculates probabilities of price exceeding specified levels for the next bar, taking trend into account. It does that by performing a statistical analysis of the completed bars in the chart's history, which may include years of data. The volatility bands differ from Bollinger bands in the calculation of standard deviation from the simple moving average, resulting in bands that envelop the range of price swings in a channel that is useful to the trader.
Advantages
- Plotted bands are more useful than Bollinger bands
- EMA in relation to SMA indicates trend
- Trend factors into probability calculations
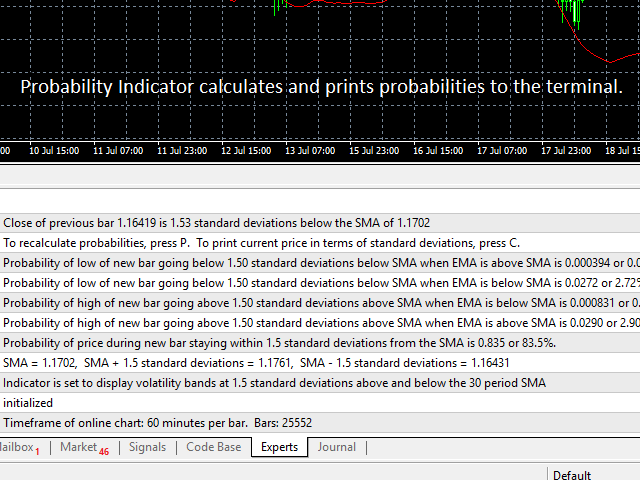
- Probability values are printed to the terminal
- Indicator uses all data in chart history
Features
- Applies to any time frame
- Calculate probabilities for high, low, or close of next bar
- Calculate probabilities for any selected price
- Reports current price in terms of standard deviation from SMA
Inputs
- "SMA Periods," bars in simple moving average
- "EMA Periods," bars in exponential moving average
- "Band standard deviations," distance of bands from SMA
- "Use bar highs and lows," calculate probabilities for maximum price swing or for closing price
- "Use Bollinger calculation," plot by Bollinger method or by improved method
- "Significant digits," set precision of numbers in terminal
- "Exclusion threshold," explained in User's Guide