• 概要
  • レビュー
  • コメント

Doma

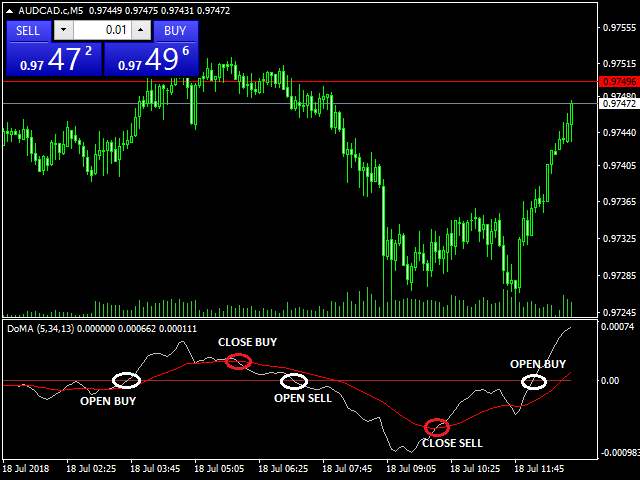
Differences of Moving Averages

This indicator plots short term trend with two moving averages difference and its signal line.

Best result at 5 min chart in default parameters.

There are 7 extern input parameters:

  • MaShortPeriod: period of the first MA.
  • MaLongPeriod: period of the second MA.
  • ModeDoMA: DoMA method.
  • ModePrc: MA price mode.
  • SignalMaPeriod: Period of Signal MA.
  • ModeSma: Signal MA mode.
  • LabelLevel: Horizontal line level on display.

Default parameters can be changed by user.

おすすめのプロダクト
Power Renko is an indicator which plots Renko bricks underneath the chart using a histogram. You can select the brick size and the timeframe of the Renko bricks as well as whether or not to use the close price or the high/low price of the candles. Renko bricks are based on price alone, not time, therefor the Renko bricks will not be aligned with the chart's time. They are extremely useful for trend trading and many different strategies can be formed from them. Buffers are provided allowing you t
The indicator detects and displays М. Gartley's Butterfly pattern. The pattern is plotted by the extreme values of the ZigZag indicator (included in the resources, no need to install). After detecting the pattern, the indicator notifies of that by the pop-up window, a mobile notification and an email. The pattern and wave parameters are displayed on the screenshots. The default parameters are used for demonstration purposes only in order to increase the amount of detected patterns. Parameters
This    Nice Trade Point     indicator is designed for signal trading. This indicator generates trend signals. It uses many algorithms and indicators to generate this signal. It tries to generate a signal from the points with the highest trend potential. This indicator is a complete trading product. This indicator does not need any additional indicators. The indicator certainly does not repaint. The point at which the signal is given does not change.     Features and Suggestions Time
Face smiling trend indicator is an oscillator designed to search for turning points. Face smiling trend indicator represents an oscillator that uses in his work an average price for a certain period and is designed to determine the price reversal points. Face smiling trend indicator oscillates between 0.00 (oversold) and 105 (overbought) values depending upon market conditions. Red bars suggest bearish pressure and blue bars bullish pressure. Typically, a reversal of the trend occurs when achiev
このコードは、もともとLuxAlgoによって他のプログラミング言語から公開されたものです。 このインジケータは、多くの取引目的に使用できる許容可能なトレンド予測能力を持っています: このインジケータは、以前に掲載したNadaraya-Watsonスムーザーをベースにしています。ここでは、価格とエンベロープの両極端間のクロスから統合されたアラートを持つ、カーネル・スムージングに基づくエンベロープ・インディケータを作成しました。ナダラヤ・ワトソン推定量とは異なり、このインディケータは逆張り の手法に従っています。 デフォルトでは、このインディケータは再描画される可能性がある ことに注意してください。ユーザーは、設定から再描画しないスムージング方法を使用で きます。三角形のラベルは、このインディケータがリアルタイムのアプリケーショ ンで有用であり続けるように設計されています。 テスターでのバックテストでは、最初のローソク足500本が経過するまでお待ちください。これは、パラメータを計算するために過去のヒストリカルデータを使用するインディケータのテスターからの制限です。
Bossy Price Alert PRO is an advanced price alert indicator. That allows you to set 10 different price alerts. Professional traders specify price levels and wait for them. This is intelligent trade system. You can also create a price barrier by setting UP and DOWN price levels. So, you can wait for a breakout wisely. This indicator makes all of your plans automated cheaply. NOTE: Each Price Alert becomes inactive after alert. Would you like to set same level again no hassle, change TimeFrame. For
Combined MT4
Ahmed Alaaeldin Abdulrahman Ahmed Elherzawi
Welcome to Investment Castle products   This product is exclusively available in the MQL5 market and is not available and will not be available anywehere else. The Combined indicator is a multi-time frame indicator and it is built using 3 indicators: Bands indicator which draws the support and resistance key levels   using up to 5 different time frames Patterns indicator which draws the chart patterns using up to 6 different time frames Spots indicator which shows the common candlestick pattern
The indicator detects and displays Shark harmonic pattern (see the screenshot). The pattern is plotted by the extreme values of the ZigZag indicator (included in the resources, no need to install). After detecting the pattern, the indicator notifies of that by a pop-up window, a mobile notification and an email. The indicator highlights the process of the pattern formation and not just the complete pattern. In the former case, it is displayed in the contour triangles. After the pattern is comple
The Level Moving Averages Message indicator ( see the description and video ) does not draw the Moving Average line in the chart window but marks the Moving Average level on all time frames in accordance with the specified parameters. The level move frequency corresponds to the TimeFrame parameter value specified. The advantage of this indicator lies in the fact that it offers the possibility of monitoring the interaction between the price and the MA of a higher time frame on a lower one (e.g.,
Power Real Trend es un indicador que no repinta y que muestra la dirección real que tiene el mercado, ofreciendo una clara manera de confirmar entradas.  Es un indicador que para su constitución se realizan múltiples operaciones para formar los distintos rangos que se utilizan para su creación. Tiene un manejo muy sencillo dando sólo tres posibles valores (1,0,-1) altamente visual y de muy sencilla comprensión. La parte superior del mismo es la zona más sensible y la inferior corresponde a la te
Oscillator The Trend Signal indicator is an indicator designed to generate trend signals. It uses its own set of algorithms and the moving average indicator to find signals. It has the feature of filtering the signals with the channel system. In this way, it tries to improve the quality of the signals. Features and Trade strategy There are two channels in the indicator. These channels are 70 and -70 channels. You will reach the signals without losing time thanks to the alarm features found on
Fishing
Yasha Firooz
1 (1)
注意:外国為替トレーダー   「市場で取引するときにあなたにもっとお金を稼ぐチャートインディケーターを取得してください ... 」 はい!私はより多くのお金を稼ぎ、取引をシンプルにし、市場がリアルタイムで何をしているのかを簡単に理解する準備ができています! それに直面しよう、外国為替取引所での取引は複雑でストレスが多く、当惑しているように見えるかもしれません!チャートは、適切なシステムとインジケーターのガイドがなければ、圧倒的で混乱する可能性があります。チャートを正しく分析していないために再び市場に焦げてしまうのではないかと思うので、胃の結び目の感触を取り除きます。 「トレーダーのブロック」はどうですか?すべてのトレーダーが簡単に陥る 1 つの落とし穴は、大きな勝利または大きな損失の後の恐ろしい「トレーダーのブロック」です。あなたは大きな勝利の後に同じ成功を再現することができますか、または大きな損失の後に別の財政的な落とし穴に落ちることができますか?優れた釣り指標ガイドは、この問題を回避し、ストレスと不安を和らげるのに役立ちます。 " 究極の外国為替直感的なテクニカル指標の提示 " 
Trend PA
Mikhail Nazarenko
5 (3)
The Trend PA indicator uses   Price Action   and its own filtering algorithm to determine the trend. This approach helps to accurately determine entry points and the current trend on any timeframe. The indicator uses its own algorithm for analyzing price changes and Price Action. Which gives you the advantage of recognizing, without delay, a new nascent trend with fewer false positives. Trend filtering conditions can be selected in the settings individually for your trading style. The indicator
"CrossMAn" is a table indicator that gives signals about the intersection of two moving averages, on selected instruments and time periods. The intersection of moving averages is one of the most popular signals on the stock exchange. The signal is displayed as colored rectangles in the table. Thus, you can assess at a glance which tool should be paid attention to. (Crossman does not add moving averages to the chart.) The indicator table can be dragged with the mouse. The size of the table
MT4 用 Forex インジケーター HTF 一目均衡表 一目均衡表は、最も強力なトレンド インジケーターの 1 つです。HTF は、Higher Time Frame を意味します。このインジケーターは、トレンド トレーダーや、プライス アクション エントリとの組み合わせに最適です。 HTF 一目均衡表を使用すると、Higher Time Frame の 一目均衡表を現在のチャートに添付できます。 上昇トレンド - 赤い線が青い線より上(両方の線が雲より上)/ 下降トレンド - 赤い線が青い線より下(両方の線が雲より下) 価格が一目均衡表の雲の上限を突破した場合にのみ買い注文をオープンします 価格が一目均衡表の雲の下限を突破した場合にのみ売り注文をオープンします HTF 一目均衡表インジケーターは大きなトレンドを捉える機会を提供します // より優れたエキスパートアドバイザーとインジケーターは、こちらで入手できます: https://www.mql5.com/en/users/def1380/seller これは、この MQL5 ウェブサイトでのみ提供されるオリジナル製品
The Four Moving Averages Message indicator ( please see the description and video ), a version of Four Moving Averages , concurrently displays four Moving Averages with default settings in the main chart window: Green and Red ones represent a short-term trend, Red and Blue ones - mid-term trend, while Blue and Yellow ones - long-term trend. You can change the moving average settings and colors. However, these parameters have been configured so that to allow trading on all time frames. The built-
The indicator detects and displays 3 Drives harmonic pattern (see the screenshot). The pattern is plotted by the extreme values of the ZigZag indicator (included in the resources, no need to install). After detecting the pattern, the indicator notifies of that by a pop-up window, a mobile notification and an email. The indicator highlights the process of the pattern formation and not just the complete pattern. In the former case, it is displayed in the contour triangles. After the pattern is com
KT Heiken Ashi Alert plots the buy and sell arrows and generate alerts based on the standard Heiken Ashi candles. Its a must use tool for the traders who want to incorporate Heiken Ashi in their trading strategy. A buy arrow plotted when Heiken Ashi change to a bullish state from bearish state. A sell arrow plotted when Heiken Ashi change to a bearish state from bullish state. Mobile notifications, Email, Sound and Pop-up alerts included. What exactly is Heiken Ashi? In Japanese, the term Hei
Teknolojide ki yüksek gelişim, üretim, e ticaret, lojistik vb tüm sektörlerde kullanıma başlandığı gibi artık finansal piyasalarda da “ yapay zeka ve algoritma” kullanılmaya başlandı. Smart Algoritma indikatörü; kaynak kodu içinde yer alan algoritma ve yapay zekası ile hiçbir analize ihtiyaç duyulmadan gün içi bütün forex enstrümanları için size buy ve sell sinyalleri yanında hedef kanal (gün içi en yüksek ve en düşük seviyeler) verir. İndikatör texti aşağıda ki bölümlerden oluşur ve herkesin a
StarSwing è un indicatore NO REPAINT che unisce in un unico strumento oscillatori e indicatori di forza.  I parametri esterni permettono di bilanciare il peso delle componenti e di regolare a proprio piacimento l'indicatore stesso. StarSwing, graficamente, è composto da segmenti di 2 colori: uno rappresentante il rialzo e uno il ribasso. Il colore non dipende dalla pura direzione del segmento ma dal trend di fondo calcolato dall'indicatore stesso. Sul grafico, si può far disegnare una media mobi
The indicator shows the potential trend direction by cyclical-wave dependence. Thus, all the rays of the intersection will be optimal rays, in the direction of which the price is expected to move, taking into account the indicator period. Rays can be used as a direction for potential market movement. But we must not forget that the approach must be comprehensive, the indicator signals require additional information to enter the market.
ZigZag Bullets
Natasha Diedericks
5 (1)
This indicator takes input from the ZigZag and ADX indicators, combined with a special trend algorithm. You also get a Moving Average on the chart to determine trend direction. Great for scalping. Perfect for channels. Features alert functions. BulletPeriod. Parameter TrendLinePeriod for the MA line. Change to your preference. Try 200. How to use: Simply attach to any chart. Sell on red bullets, with red MA line above price. Enter on bullets closest to this line. Buy on blue bullets, with blue
Owl smart levels
Sergey Ermolov
4.58 (55)
MT5版  |   FAQ Owl Smart Levels Indicator   は、 Bill Williams   の高度なフラクタル、市場の正しい波構造を構築する Valable ZigZag、エントリの正確なレベルをマークする Fibonacci レベルなどの一般的な市場分析ツールを含む 1 つのインジケーター内の完全な取引システムです。 利益を得るために市場と場所に。 戦略の詳細な説明 インジケータを操作するための指示 顧問-取引助手 プライベートユーザーチャット ->購入後に私に書いて、私はプライベートチャットにあなたを追加し、あなたはそこにすべてのボーナスをダウンロードすることができます 力はシンプルさにあります! Owl Smart Levels   取引システムは非常に使いやすいので、専門家にも、市場を勉強し始めて自分で取引戦略を選択し始めたばかりの人にも適しています。 戦略と指標に秘密の数式や計算方法が隠されているわけではなく、すべての戦略指標は公開されています。 Owl Smart Levels を使用すると、取引を開始するためのシグナルをすばやく確認し、
This indicator shows the gaps on the current chart with a rectangle shape and indicates when the gap is filled by closing the shape. Gaps are considered over the shadows. Allows sending alerts by e-mail or push notifications when a gap is found. Parameters SizeGAP - Size of the gap that you want to indicate; HGcolor1 - Color of the gap in an upward movement; HGcolor2 - Color of the gap in a downward movement; HGstyle - The style of rectangle to be drawn; StartCalculationFromBar - How many cand
FREE FOR A LIMITED TIME ONLY!!! The Ultimate Indicator For Trading Trend This indicator clearly shows you the strength of the market in one direction or the other, which means that you can trade knowing you are either with or against the market. When used in conjunction with the +3R principles you are sure to have some serious results. The +3R Principles Routine - This is when you trade and how often  Rules - This is the rule you follow  Risk:Reward - This is the percentage amount of your accoun
FREE
Indicator values are in the range 0-100. The greater is the indicator value, the greater is the market stability, so the more likely we have trend. The smaller is the indicator value - the less probable the trend is. Tips: Trading on unstable market:     Buy, when moving average (blue line) of the CMI indicator is below 40 and the histogram is red.     Sell when moving average (blue line) of the CMI indicator is below 40 and the histogram is green.     Close positions when CMI his
Download the free version   here. Divergence Divergence refers to when the price of a currency pair moves in one direction while the trend indicator is moving in the opposite direction. With divergence, there can be positive and negative signals. Divergences in Forex trading are quite common signals of technical analysis. These are basic early Forex signals indicating the trend reversal and filter false signals. Application of this indicator It is usually not easy to detect divergences by the t
Sto Signal AM
Andriy Matviyevs'kyy
5 (1)
This indicator displays Stochastic osc signals on the price chart and allows the user to receive notifications of such signals. The Stochastic indicator is a classic and proven indicator of the technical analysis of the markets. Despite its age, it is still relevant today. Depending on the settings, the indicator allows you to work effectively on various TFs and any markets. Signals are given on fully formed bars and are not redrawn. Custom Parameters: Stochastic_Price (0-1) - The applied pric
FREE
MT4 用 Forex インジケーター「RSI と 2 つの移動平均」 このインジケーターは、モメンタム トレーディング システムに最適です。 「RSI と 2 つの MA」インジケーターを使用すると、RSI 自体の高速移動平均と低速移動平均を確認できます インジケーターを使用すると、トレンドの変化を非常に早く確認できます 「RSI と 2 つの MA」を使用すると、トレンドの方向への勢いを捉えることができます このインジケーターは、パラメーターを使用して簡単に設定できます (画像を参照) インジケーターは、任意の時間枠で使用できます // より優れたエキスパート アドバイザーとインジケーターは、 https://www.mql5.com/en/users/def1380/seller で入手できます これは、この MQL5 Web サイトでのみ提供されるオリジナル製品です。
The MTF MA Trend indicator is an advanced model of the moving average indicator. With this indicator, you can follow the moving averge inductor in the multi time frame from a single graphical display. This indicator shows 7 different time zones on a single graphical display. This display is designed in oscillator style. It is also a new generation trend indicator. Features It can work in 7 different time zones. different color settings can be made for each time zone. each time zone has a level
このプロダクトを購入した人は以下も購入しています
Gann Made Easy は、ミスター・ギャンの理論を使用した取引の最良の原則に基づいた、プロフェッショナルで使いやすい外国為替取引システムです。 W・D・ガン。このインジケーターは、ストップロスとテイクプロフィットレベルを含む正確な買いと売りのシグナルを提供します。 PUSH通知を利用して外出先でも取引可能です。 購入後はご連絡ください!私の取引のヒントと素晴らしいボーナスインジケーターを無料で共有します! おそらく、ギャンの取引手法についてはすでに何度も聞いたことがあるでしょう。通常、ギャンの理論は初心者のトレーダーだけでなく、すでにある程度の取引経験がある人にとっても非常に複雑なものです。なぜなら、ギャンの取引手法は理論的にはそれほど簡単に適用できるものではないからです。私はその知識を磨き、最良の原則を私の外国為替インジケーターに組み込むために数年を費やしました。 このインジケーターは非常に簡単に適用できます。必要なのは、それをチャートに添付し、簡単な取引推奨事項に従うだけです。このインジケーターは常に市場分析の仕事を行い、取引の機会を探します。適切なエントリーポイントを検出
まず第一に、この取引インジケーターは再描画されず、再描画されず、遅延しないことを強調する価値があります。これにより、手動取引とロボット取引の両方に理想的なものになります。 ユーザーマニュアル:設定、入力、戦略。 アトミックアナリストは、価格の強さとモメンタムを利用して市場でより良いエッジを見つけるためのPA価格アクションインジケーターです。ノイズや誤ったシグナルを除去し、取引ポテンシャルを高めるための高度なフィルターを備えています。複雑なインジケーターの複数のレイヤーを使用して、アトミックアナリストはチャートをスキャンし、複雑な数学的計算をシンプルなシグナルと色に変換します。これにより、どのような初心者トレーダーでも理解して使用し、一貫した取引の決定を行うことができます。 「アトミックアナリスト」は、新規および経験豊富なトレーダー向けにカスタマイズされた包括的な取引ソリューションです。プレミアムインジケーターとトップノッチの機能を1つの取引戦略に組み合わせ、すべてのタイプのトレーダーにとって汎用性のある選択肢にします。 デイリートレーディングとスキャルピング戦略:高
Please contact me after purchase to immediately get your PDF strategy + documentation for Trend Pulse !  Official release price of $89  ( 3 /50 copies left). Next price is $199 . Introducing Trend Pulse , a unique and robust indicator capable of detecting bullish, bearish, and even ranging trends! Trend Pulse uses a special algorithm to filter out market noise with real precision. If the current symbol is moving sideways, Trend Pulse will send you a ranging signal, letting you know that it
An exclusive indicator that utilizes an innovative algorithm to swiftly and accurately determine the market trend. The indicator automatically calculates opening, closing, and profit levels, providing detailed trading statistics. With these features, you can choose the most appropriate trading instrument for the current market conditions. Additionally, you can easily integrate your own arrow indicators into Scalper Inside Pro to quickly evaluate their statistics and profitability. Scalper Inside
Trend Punch
Mohamed Hassan
4.91 (22)
This indicator is unstoppable when combined with our other indicator called  Support & Resistance . After purchase, send us a message and you will get it   for  FREE as a BONUS! Introducing Trend Punch , the revolutionary forex trend indicator that will transform the way you trade! Trend Punch is uniquely designed to provide precise buy and sell arrows during strong market trends, making your trading decisions clearer and more confident. Whether you're trading major currency pairs or exotic sym
Gold Stuff
Vasiliy Strukov
4.9 (269)
Gold Stuff は、金専用に設計されたトレンド指標であり、あらゆる金融商品にも使用できます。 インジケーターは再描画せず、遅れません。 推奨時間枠 H1. それインディケータでフルオートExpert Advisor EA Gold Stuffが動作します。 あなたは私のプロフィールでそれを見つけることができます. 設定と個人的なボーナスを得るために、購入後すぐに私に連絡してください! トレンド スキャナーの強力なサポートを利用して、無料のインジケーターを入手し、プライバシーを守ります。あーみー!   設定 矢印を描く - オンオフ。 チャートに矢印を描く。 アラート - 可聴アラートのオンオフ。 メール通知 - オンオフ。 電子メール通知。 プチ通知 - オンオフ。 プッシュ通知。 次に、色域を調整します。 Gold Stuff は、金専用に設計されたトレンド指標であり、あらゆる金融商品にも使用できます。 インジケーターは再描画せず、遅れません。 推奨時間枠 H1. それインディケータでフルオートExpert Advisor EA Gold Stuff
現在26%オフ 初心者やエキスパートトレーダーに最適なソリューション! このインジケーターは、独自の機能と新しい計算式を取り入れた、ユニークで高品質、かつ手頃な価格のトレーディングツールです。たった1枚のチャートで28の為替ペアの通貨強度を読み取ることができます。新しいトレンドやスキャルピングチャンスの引き金となるポイントを正確に特定することができるので、あなたのトレードがどのように改善されるか想像してみてください。 ユーザーマニュアルはこちら  https://www.mql5.com/en/blogs/post/697384 これが最初の1本、オリジナルだ! 価値のないクローンを買わないでください。 特別な サブウィンドウの矢印で強い通貨の勢いを表示 GAPがあなたのトレードを導く! 基準通貨や気配値が売られすぎ・買われすぎのゾーン(外相フィボナッチレベル)にあるとき、個別チャートのメインウィンドウに警告表示。 通貨がレンジの外側から反落した場合、プルバック/リバーサルのアラート。 クロスパターンの特別なアラート 複数の時間枠を選択可能で、トレンドを素早く
通貨強さウィザードは、取引を成功させるためのオールインワン ソリューションを提供する非常に強力な指標です。このインジケーターは、複数の時間枠のすべての通貨のデータを使用して、このまたはその外国為替ペアのパワーを計算します。このデータは、使いやすい通貨インデックスと通貨パワーラインの形式で表され、特定の通貨のパワーを確認するために使用できます。 必要なのは、取引したいチャートにインジケーターを接続することだけです。インジケーターは、取引する通貨の実際の強さを示します。このインジケーターは、トレンドに合わせて取引するときに有利に利用できる売買高の圧力の極値も示します。このインジケーターには、フィボナッチに基づく可能なターゲットも表示されます。 このインジケーターは、PUSH 通知を含むあらゆるタイプのアラートを提供します。 購入後ご連絡下さい。私の取引のヒントをあなたと共有し、素晴らしいボーナスインジケーターを無料で提供します! 幸せで有益な取引をお祈りします。
mql5と Telegramの モーニング・ブリーフィングで、詳細とスクリーンショットを含む毎日のマーケット・アップデートをご覧 ください! FX Power MT4 NGは 、長年の人気を誇る通貨強度計FX Powerの次世代モデルです。 この次世代ストレングスメーターは何を提供するのでしょうか?初代FXパワーの魅力すべて プラス GOLD/XAUの強さ分析 より正確な計算結果 個別に設定可能な分析期間 カスタマイズ可能な計算上限値により、さらに優れたパフォーマンスを実現 もっと見たい人のための特別なマルチインスタンス設定 すべてのチャートでお好みの色を無限に設定可能 数え切れないほどの通知オプションにより、重要なことを見逃すことはありません。 Windows 11とmacOSのスタイルで角を丸くした新しいデザイン 魔法のように動くインジケーターパネル FXパワーの主な機能 すべての主要通貨の強さの完全な履歴 すべての時間枠における通貨の強さの履歴 すべてのブローカーとチャートで同一の計算結果 100%信頼できるリアルタイム計算 -> リペイントなし ドロップダウン・リストから
現在31%オフ! 初心者やエキスパートトレーダーに最適なソリューション! このインジケータは、独自の機能と秘密の数式を組み込んだ、ユニークで高品質かつ手頃な価格のトレーディングツールです。たった1枚のチャートで28の通貨ペアのアラートを表示します。新しいトレンドやスキャルピングチャンスの引き金となるポイントを正確に把握することができるので、あなたのトレードがどのように改善されるか想像してみてください! 新しい基本的なアルゴリズムに基づいて構築されているため、潜在的な取引の特定と確認がより簡単になります。これは、通貨の強さや弱さが加速しているかどうかをグラフィカルに表示し、その加速のスピードを測定するためです。加速すると物事は明らかに速く進みますが、これはFX市場でも同じです。つまり、反対方向に加速している通貨をペアにすれば、利益を生む可能性のある取引を特定することができるのです。 通貨の勢いを示す縦の線と矢印は、あなたの取引の指針となるでしょう。 ダイナミックマーケットフィボナッチ23レベルはアラートトリガーとして使用され、市場の動きに適応します。もしインパルスが黄色
Order Block Hunter
Noha Mohamed Fathy Younes Badr
5 (1)
Order block hunter indicator is the best indicator for  hunt the order blocks that area where there has been a large concentration of limit orders waiting to be executed Order blocks are identified on a chart by observing previous price action and looking for areas where the price experienced significant movement or sudden changes in direction .This indicator does that for you by using very complicated codes and helps you to take the best areas To buy and sell because it make marks at the best a
現在20%OFF! 初心者やエキスパートトレーダーのためのベストソリューション! このダッシュボードソフトウェアは、28の通貨ペアで動作しています。それは私達の主要な指標(高度な通貨の強さ28と高度な通貨インパルス)の2に基づいています。それは全体の外国為替市場の大きい概観を与えます。それは、すべての(9)時間枠で28の外国為替ペアのための高度な通貨の強さの値、通貨の動きの速度と信号を示しています。チャート上で1つのインディケータを使用して市場全体を観察し、トレンドやスキャルピングの機会をピンポイントで見つけることができたら、あなたのトレードがどのように改善されるか想像してみてください。 このインディケータには、強い通貨と弱い通貨の識別、潜在的な取引の識別と確認がより簡単になるような機能が搭載されています。このインディケータは、通貨の強さや弱さが増加しているか減少しているか、また、すべての時間枠でどのように機能しているかをグラフィカルに表示します。 新機能として、現在の市場環境の変化に適応するダイナミックなマーケットフィボナッチレベルが追加され、すでに当社のAdvan
まず第一に、この取引ツールはノンリペイント、ノンリドロー、ノンラグの指標であり、プロの取引に理想的ですことを強調する価値があります。 オンラインコース、ユーザーマニュアル、デモ。 スマートプライスアクションコンセプトインジケーターは、新米から経験豊富なトレーダーまで、非常 に強力なツールです。Inner Circle Trader AnalysisやSmart Money Concepts Trading Strategiesなど、20以上の有用な指標を1つに組み合わせています。このインジケーターはスマートマネーコンセプトに焦点を当て、大手機関の取引方法を提供し、彼らの動きを予測するのに役立ちます。 特に、流動性分析に優れており、機関がどのように取引しているかを理解しやすくしています。市場のトレンドを予測し、価格の動きを慎重に分析するのに優れています。機関の戦略とトレードを合わせることで、市場の動向についてより正確な予測ができます。このインジケーターは多目的であり、市場構造を分析し、重要な注文ブロックを特定し、さまざまなパターンを認識するのに優れています。 このインジケー
Enigmera
Ivan Stefanov
5 (4)
エニグメラ:市場の中核 https://www.enigmera.com はじめに このインディケータと取引システムは、金融市場に対する驚くべきアプローチです。ENIGMERAは、フラクタルサイクルを使用して、サポートとレジスタンスレベルを正確に計算します。本格的な蓄積局面を示し、方向性と目標を示します。 トレンド中でも調整中でも機能するシステムです。 どのように作動するのか? ENIGMERAは、支持線・抵抗線、目標線、乖離線の3つのラインで構成されています。このシステムは、過去のデータを現在と未来に外挿する典型的な市場指標とは異なり、現在の完全な画像を提供します。支持線上にある場合、それは本当の支持を意味し、抵抗線上にある場合、それは本当の抵抗を意味する。ある水準が破られた場合、それはトレンドの変化を意味する。再描画はしない。 市場は常に進化しているため、ENIGMERAはその評価ツールを適応させ、定期的に戦略を修正しています。  これにより、すべてのシナリオが徹底的に評価されることが保証されます。この市場指標の独自性は、その能力を見れば明らかです。  ENIGM
Scalper Vault は、スキャルピングを成功させるために必要なすべてを提供するプロフェッショナルなスキャルピング システムです。このインジケーターは、外国為替およびバイナリー オプションのトレーダーが使用できる完全な取引システムです。推奨される時間枠は M5 です。 システムは、トレンドの方向に正確な矢印シグナルを提供します。また、トップとボトムのシグナルとギャン マーケット レベルも提供します。 インジケーターは、プッシュ通知を含むすべてのタイプのアラートを提供します。 インジケータの購入後にご連絡ください。私の個人的な取引の推奨事項と素晴らしいボーナス指標を無料で共有します! 幸せで有益な取引をお祈りします!
PZ Day Trading
PZ TRADING SLU
3.67 (3)
このインディケータは、価格アクション分析とドンチャンチャネルのみを使用して、ジグザグ方式で価格の反転を検出します。再描画やバックペインティングを一切行わずに、短期取引向けに特別に設計されています。それは彼らの操作のタイミングを増やすことを目指している賢明なトレーダーにとって素晴らしいツールです。 [ インストールガイド | 更新ガイド | トラブルシューティング | よくある質問 | すべての製品 ] 驚くほど簡単に取引できます すべての時間枠で価値を提供します 自己分析統計を実装します 電子メール/音声/視覚アラートを実装します 可変長のブレイクアウトと混雑ゾーンに基づいて、インディケータは価格アクションのみを使用して取引を選択し、市場が非常に高速に行っていることに反応します。 過去のシグナルの潜在的な利益が表示されます この指標は、独自の品質とパフォーマンスを分析します 負けブレイクアウトは強調表示され、説明されます インジケータは、非バックペインティングおよび非再ペイントです この指標は、日中のトレーダーが単一の価格反転を見逃さないようにするのに役立ちます。ただし、す
Gold Channel is a volatility-based indicator, developed with a specific timing algorithm for the XAUUSD pair, which consists of finding possible corrections in the market. This indicator shows two outer lines, an inner line (retracement line) and an arrow sign, where the theory of the channel is to help identify overbought and oversold conditions in the market. The market price will generally fall between the boundaries of the channel. If prices touch or move outside the channel it is a tra
製品を購入する前に、以下の情報をお読みください。 Apollo Pips PLUS SP はユニークな製品です。これは、私の新しい「アポロ ピップス」インジケーターと、私のすべての取引インジケーターにアクセスできる「スーパー パック」ボーナスを手に入れたい人のためのものです。 Apollo Pips PLUS SP 製品を購入すると、実際には私の Apollo Pips インジケーターのまったく新しいバージョンを購入することになります。このバージョンのインジケーターには改良されたアルゴリズムと使いやすいパラメーターがあり、あらゆる市場およびあらゆる取引スタイルでインジケーターを使用する機会が得られます。 この製品の購入者は、私のスーパーボーナスとして、他のすべてのインジケーターにも無料でアクセスできます!私のすべての取引ツールにアクセスしたい場合は、この製品が最適です!:) しかし、これがすべてではありません!:) この製品のすべての購入者は、私の新しいインジケーターを無料で入手する資格もあります!:)新しい取引インジケーターを利用できるようになりました。私の特権のある「スーパー パッ
今、147ドル(いくつかの更新後に499ドルに増加します) - 無制限のアカウント(PCSまたはMac) RelicusRoad ユーザー マニュアル + トレーニング ビデオ + プライベート Discord グループへのアクセス + VIP ステータス 市場の新しい見方 RelicusRoad は、外国為替、先物、暗号通貨、株式、および指数の世界で最も強力な取引インジケーターであり、トレーダーに収益を維持するために必要なすべての情報とツールを提供します。初心者から上級者まで、すべてのトレーダーが成功するためのテクニカル分析と取引計画を提供します。これは、将来の市場を予測するのに十分な情報を提供する重要な取引指標です。意味をなさないチャート上のいくつかの異なる指標ではなく、完全な解決策を信じています.これは、信号、矢印 + 価格アクション情報を表示するオールインワンのインジケーターで、他に類を見ない非常に正確です。 強力な AI に基づいて、RelicusRoad は不足している情報とツールを提供して、あなたを教育し、トレーディングのプロ、成功したトレーダーにします。
Advanced Supply Demand
Bernhard Schweigert
4.9 (314)
現在33%オフ 初心者にもエキスパートトレーダーにも最適なソリューション このインジケーターは独自の機能と新しい公式を多数内蔵しており、ユニークで高品質かつ手頃な取引ツールです。このアップデートでは、2つの時間枠ゾーンを表示できるようになります。より長いTFだけでなく、チャートTFとより長いTF(ネストゾーンを表示)の両方を表示できます。すべてのSupply Demandトレーダーの皆さんのお気に召すはずです。:) 重要情報の公開 Advanced Supply Demandの可能性を最大化するには、 https://www.mql5.com/ja/blogs/post/720245 にアクセスしてください。   エントリーまたはターゲットの正確なトリガーポイントを正確に特定できれば取引がどのように改善されるか想像してみてください。新しい基盤となるアルゴリズムに基づいて構築されているため、買い手と売り手の間の潜在的な不均衡をさらに簡単に特定できます。これは、最も強い需要と供給のゾーンと、過去のパフォーマンス(古いゾーンを表示)がグラフィカルに表現されるためです。これらの機能は、最適
カスタムMT4インジケーターで外国為替取引を成功させるための秘密を発見してください! 外国為替市場で成功を達成し、リスクを最小限に抑えながら一貫して利益を得る方法を疑問に思ったことはありますか? これがあなたが探している答えです! 取引へのアプローチに革命をもたらす独自のMT4インジケーターを導入できるようにします。 ユニークな汎用性 私たちのインジケータは、RenkoとRangeBarのろうそくのフォーメーションを好むユーザー向けに特別に設計されています。 これらのチャートタイプは多くの経験豊富なトレーダーに好まれていることを理解しています。そのため、私たちのインジケーターはそれらとシームレスに統合され、比類のない市場分析を提供します。 クリアトレンドシグナル 複雑な分析を忘れてください! 私たちのインジケーターは、鮮やかな色と明確なドット構造を利用して、市場の動向を明確に示しています。 赤と青の点は、価格の動きの方向性について疑いの余地がなく、取引の迅速な意思決定を可能にします。 HH/HL HL/LL戦略とのアライメント HH/HLおよびHL/LL構
Step into the realm of Forex trading with confidence and precision using XQ, a cutting-edge Forex indicator designed to elevate your trading game to unprecedented heights. Whether you're a seasoned trader or just stepping into the world of currency exchange,   XQ Forex Indicator   empowers you with the insights and signals needed to make informed trading decisions. The signal conditions are a combination of three indicators, and XQ Forex Indicator only display  medium and long-term trends . The
M1 Arrow
Oleg Rodin
4.73 (15)
市場の2つの基本原則に基づく日中戦略。 このアルゴリズムは、追加のフィルターを使用したボリュームと価格の波の分析に基づいています。インディケータのインテリジェントアルゴリズムは、2つの市場要因が1つに結合した場合にのみシグナルを出します。インディケータは、より高い時間枠のデータを使用して、M1チャート上の特定の範囲の波を計算します。そして波を確認するために、インジケーターはボリュームによる分析を使用します。 このインディケータはレディトレーディングシステムです。トレーダーが必要とするのは、信号に従うことだけです。また、インジケーターはあなた自身の取引システムの基礎になることができます。取引はミニッツチャートでのみ行われます。 インジケーターがMTFの原則を使用しているという事実にもかかわらず、インジケーターのアルゴリズムは可能な限り安定しています。 購入後、必ず私に書いてください!私の取引設定と推奨事項をあなたと共有します!
Automated Trendlines
Georgios Kalomoiropoulos
5 (17)
トレンドラインは、外国為替取引におけるテクニカル分析の最も重要なツールです。残念ながら、ほとんどのトレーダーはそれらを正しく描画していません。自動トレンドラインインジケーターは、市場のトレンドの動きを視覚化するのに役立つ本格的なトレーダー向けのプロフェッショナルツールです。 トレンドラインには、強気トレンドラインと弱気トレンドラインの2種類があります。 上昇トレンドでは、外国為替トレンドラインは価格変動の最低スイングポイントを介して描画されます。 少なくとも2つの「最低安値」を接続すると、トレンドラインが作成されます。 下降トレンドでは、トレンドラインは価格変動の最も高いスイングポイントを介して描画されます。 少なくとも2つの「最高値」を接続すると、トレンドラインが作成されます。 トレンドラインが壊れたとき? 弱気のろうそくが強気のトレンドラインの下で閉じ、ろうそくの高さがトレンドラインの上にあるとき、強気のトレンドラインは壊れます。 強気のろうそくが弱気のトレンドラインの上で閉じ、ろうそくの安値がトレンドラインの下にあるとき、弱気のトレ
Break and Retest
Mohamed Hassan
4.12 (17)
This Indicator only places quality trades when the market is really in your favor with a clear break and retest. Patience is key with this price action strategy! If you want more alert signals per day, you increase the number next to the parameter called: Support & Resistance Sensitivity.  After many months of hard work and dedication, we are extremely proud to present you our  Break and Retest price action indicator created from scratch. One of the most complex indicators that we made with ove
Reversal First Impulse levels (RFI)    INSTRUCTIONS        RUS       -       ENG              R ecommended to use with an indicator   -   TPSpro  TREND PRO -  Version MT5 A key element in trading is zones or levels from which decisions to buy or sell a trading instrument are made. Despite attempts by major players to conceal their presence in the market, they inevitably leave traces. Our task was to learn how to identify these traces and interpret them correctly. Main functions: Displaying activ
Advanced Currency Strength Indicator The Advanced Divergence Currency Strength Indicator. Not only it breaks down all 28 forex currency pairs and calculates the strength of individual currencies across all timeframes , but, You'll be analyzing the WHOLE forex market in 1 window (In just 1 minute) . This indicator is very powerful because it reveals the true movements of the market.  It is highly recommended to  analyze charts knowing the performance of individual currencies or the countries ec
Italo Trend Indicator
Italo Santana Gomes
4.79 (38)
BUY INDICATOR AND GET EA FOR FREE AS A BONUS + SOME OTHER GIFTS! ITALO TREND INDICATOR  is the best trend indicator on the market, the Indicator works on all time-frames and assets, indicator built after 7 years of experience on forex and many other markets. You know many trend indicators around the internet are not complete, does not help, and it's difficult to trade, but the Italo Trend Indicator is different , the Italo Trend Indicator shows the signal to buy or sell, to confirm the signal t
ICT, SMC, SMART MONEY CONCEPTS, SMART MONEY, Smart Money Concept, Support and Resistance, Trend Analysis, Price Action, Market Structure, Order Blocks, BOS/CHoCH,   Breaker Blocks ,  Momentum Shift,   Supply&Demand Zone/Order Blocks , Strong Imbalance, HH/LL/HL/LH,    Fair Value Gap, FVG,  Premium  &   Discount   Zones, Fibonacci Retracement, OTE, Buy Side Liquidity, Sell Side Liquidity, BSL/SSL Taken, Equal Highs & Lows, MTF Dashboard, Multiple Time Frame, BigBar, HTF OB, HTF Market Structure, 
TakePropips Donchian Trend Pro
Eric John Pajarillaga Aldana
4.61 (18)
TakePropips Donchian Trend Pro   (MT4) は、ドンチャン チャネルを使用してトレンドの方向を自動的に検出し、エントリーとエグジットの取引シグナルを提供する強力で効果的なツールです! この多機能インジケーターには、トレンド スキャナー、取引シグナル、統計パネル、スクリーナー、取引セッション、およびアラート履歴ダッシュボードが含まれます。取引シグナルを提供し、チャートを分析する時間を節約するように設計されています! ユーザー マニュアルとインストール ガイドは、ブログ投稿 (   https://www.mql5.com/en/blogs/post/751368   ) からダウンロードできます。 今日は 50% オフ! 98ドルから49ドルに値下げ! このインジケーターは、ストラテジー テスターでテストできます (ビジュアル モードを有効にします)。 詳細については、説明の下にあるビデオ チュートリアルも利用できます。 ご不明な点やサポートが必要な場合は、私に連絡してください。 TakePropips Donchian Trend Pro イン
作者のその他のプロダクト
XLineBreak
Ahmet Metin Yilmaz
5 (1)
このインジケーターは、入力パラメーター バー検出戦略を使用してブレイクアウトを除外します。 WaitForBarClosed 関数を使用してシグナル (true) を確認できますが、false よりも少し遅れてアクティブになることがあります。 インジケーターが別のウィンドウで開きます。 すべての時間枠とペアに適しています。 青い線はトレンドの方向を示しています。 任意のチャートにインジケーターを添付 ポップアップ表示されるインジケーター ダイアログ ボックスから、入力タブで目的の入力を選択します。 [OK] を選択して確認し、続行します。 パラメーター Lines_Break: 周期、推奨値は 3 ~ 21 です。周期が大きいほど、インジケーターが滑らかになります。 WaitForBarClosed: "true" または "false"。 よりタイトなストップ ロスと小さなテイク プロフィット レベルによって、より早いシグナルに「false」を使用できます。 確認済みシグナルには「true」を使用できます。 true と false の両方のオプションが一緒に使用されて
TripleS
Ahmet Metin Yilmaz
5 (1)
3S indicator  designed for trend detection without the effect of accidental price leaps. It uses Price Series and a few moving averages for noise reduction. It works on multiple timeframes, even M1. To increase effectiveness, it is recommended to use default parameters for M1 graphic (see screenshots). You can change settings for other time frames. Example of using this indicator : If  Gold  cross to  Blue  down and both gold and blue under the  Gray ,  it could be a promising sell signal . To
EwoMov
Ahmet Metin Yilmaz
EwoMov indicator is useful for determining a trend with higher period of price Moving Averages (it should be higher than 200). I am using this indicator for swing trade on M5-M30 charts. This indicator uses several bars for calculation. They are all saved in external parameters. The proper values are 5 - 13 - 34, but you can change them. It is ready for all timeframes, but does its best for M5-H1. It is designed to be optimized for other timeframes. You can find some explanations on screenshots.
Mighty Scalper LightEA A Trend Friendly EA There are different and complex logic mixed in it It begins to work, simply with a BreakOut strategy and Works in PARTIAL CLOSE and CLOSE TIME LIMIT you had never seen before in the market expert... It opens an order and use partial close in a specific levels and close order within a specific time ( if order still live ) No Martingale and hedging It works any kind of broker, but lower spread gets more gain Fast optimization for strategy tester ( for
This EA uses  Non-Repaint Hull Moving Averages calculation. You can find positive results with the correct optimization. Optimization should be adjusted according to the properties of the broker you are using and your trading institution. Default settings are optimized for AUDUSD in an ECN broker for M30 time frame. (Remember, it is necessary to re-optimize your brokers for the settings.) Test it before buying for your broker settings if it is ok, It is recommended use rental option to be sure
The Great Gig In The Sky is an expert advisor and also a song from My favorite Rock Band's. Pink Floyd.  There is only one input parameter. Lots amount. You know what do you do in there. Try in a demo account from your real broker to test. Expert logic also includes stop loss and take profit transactions. Do not worry about them. The one-month rental period is only for you to try the experiment and is valid for limited copy. Tested and Preferred pairs are GBPJPY, CHFJPY,CADJPY. I am still contin
HMA Nrp
Ahmet Metin Yilmaz
Alan Hull's moving average, more sensitive to the current price activity than the normal MA. Reacts to the trend changes faster, displays the price movement more clearly. No Repaint Version on separate Windows shows the trend 1 and -1 . Improvement of the original version of the indicator by WizardSerg <wizardserg@mail.ru>. Suitable for all timeframes. Parameters Period - period, recommended values are from 9 to 64. The greater the period, the smoother the indicator. Method - method, suitable
OneWayTicket indicator is based on CCI indicator. In fact, it analyzes multiple CCIs from several timeframes. There are four Ways of OneWayTicket, read from left to right - 15 min, 30 min, 1 hour and 4 hours. The idea is to enter the market when all four CCIs agree on a trend. A trader chooses which timeframes to monitor. When all four ways of the OneWayTicket are green - Buy . When all four ways of the OneWayTicket are bright red - Sell . Original idea from the author: tageiger, revised for the
This Script Shows your Account & Symbol information which you use on your graphics. These are: Account Information Number Name Currency Server Leverage Stop Out Level Balance Information Balance Equity Margin Free Margin Symbol Information Symbol Lot Size Min.Lot Lot Step Max.Lot Tick Value Tick Size Spread Stop Loss Level Swap Long Swap Short Initial Margin Maint.Margin Required Margin Trade Allowed
Virtue
Ahmet Metin Yilmaz
"Virtue" is a fully automated Long term Expert Advisor. It calculates market condition itself and decides to enter a position. "Virtue" needs patience that is the why its name Virtue. Patience is a virtue. You must be patient to make some Money. You have to wait for it to find optimal conditions to open an order. It will be enough to just install it on the platform. No need to optimize many parameters. Expert is optimized for EURUSD H1 timeframe. First download demo and test it for your broker.
Virtue Multi Lot   "Virtue" is a fully automated Long term Expert Advisor. It calculates market condition itself and decides to enter a position. This is the main position. After that position, it adds some small lots for scalping. You can select how many orders will be open extra. It depends on your account margin and risk managment. "Virtue" needs patience that is the why its name Virtue. Patience is a virtue. You must be patient to make some Money. You have to be wait it find optimal condit
Instructions Attach the indicator to any chart (advised H4) Use input tabs (defaults are 5 and false ) Press ok and continue trading. Description The indicator uses a kind of pattern breakout strategy to help your trading strategy. I am using this strategy on H4 charts for many of pairs with a trailing stop and default indicator settings. Better results are shown on USDJPY, EURJPY, CADJPY, EURGBP, EURUSD, USDCAD, USDCHF, NZDUSD and GBPUSD. Trailing stops should be different for each pair. The
PivotSupportResistance This indicator plots horizontal lines at daily pivot levels R3, R2, R1, Pivot, S1, S2, S3, where R means Resistance and S means Support. This indicator can be applied to any chart period, although daily pivots on charts with long periods are meaningless (if you switch your chart timeframe greater than daily chart, you will get alert and indicator will not work). Labels are shown for the most recent day's levels. There are no external inputs, so it is easy to use. Please re
PriceChannel is designed for trend detection without the effect of accidental price leaps. It uses Price Series and a few moving averages for noise reduction. It works on multiple timeframes, even M1. To increase effectiveness, it is recommended to use 3 instances of PriceChannel with different parameters on one chart (see screenshots). You can use the following settings (for M1 charts): PriceChannel(10,2,30) Gold colour. PriceChannel(10,5,30) Blue colour. PriceChannel(21,8,13) Gray colour. Exa
VoMa
Ahmet Metin Yilmaz
Variation of Moving Averages indicator is calculated as the difference between different periods of moving averages. Obtained result filtered by another MA. It displays more precise signals of divergences between prices and the value of the indicator. It emphasizes price extremums more precisely, it moves faster. There are three inputs FastMA: Default is 13, shows MA period. SlowMA: Default is 21, shows MA period. SignalMA: Default is 8, shows MA period. It basically detects the trend, advised
This indicator calculates price movement with the Volume. The Volume indicates the number of deals in the desired period, but does not show number of contracts per deal. From this point of view, the tick does not reflect the true volume. However it is a valuable demand indicator. Volume and price are calculated with a special formula. There are 3 input parameters EMAPeriod: Price and volume data are calculated using this period of Moving Average first. DEMAPeriod: Results of first EMA, recalcu
HLOC Trend Indicator This indicator helps you to determine trend direction on your trade. Default parameters for H1 time frame. You can use this indicator both bigger time frame and smaller time frame to open a trade. The calculation is based on high, low, opening and closing price values of each bar in the selected time period. When the values found in the Indicator custom formula are exceeded, the buy or sell signal falls on the screen. There are two extern inputs; RiskFactor: Early but risky
This indicator shows Linear Regression Line and it's channels which calculated with fibo numbers. You can use this indicator in different timeframes on your chosen timeframe chart. You only need to attach this indicator on the chart twice or more with a different colors to do this.  There are 6 input parameters; period      : you can choose regression timeframe independent of chart timeframe. linewidth : width of line on the chart. bars back regression begin : calculated regression bar count. LR
This indicator examines the relative strengths of the currencies of 8 different countries and displays the one that has the potential to gain profit in the short term as a suggestion. The relative strength of each country's currency over the selected time period is shown on the graph as a percentage. The recommended currency according to BuyLevel and SellLevel determined by the user is shown in the bottom right section. The indicator also automatically brings up the 30-minute graph of the sugge
Price Action Signals generates buy and sell signals with price close and complex logic. You can use it different timeframes and pairs.  Best results are on M30 and H1 charts with default parameter. You can change this parameter ( nFrequency ) for other timeframes. ( except M1 timeframe ) There is only one extern input: nFrequency: It determines signal frequency. Default is 0.004. You can use this arrow for Expert Advisors. Upsignal: iCustom(......"PriceActionSignals", buffer nr:0 ) Downsignal :
ATR Channel is an indicator. It shows us ATR ( depends on selected period ) Line on main chart. It also draw 3 up ATR channels (ATRu) and 3 down ATR channels (ATRd) on the same window. All they helps you to trade with a ATR indicator. There are 6 extern inputs; PeriodsATR   : You can change ATR Period default is 13. MA_Periods   : Use for draw ATR channels MA periods. Default is 34. MA_Type       : You can change MA_method here. Default is Linear weighted. Mult_Factor1 : It is for first up and d
PriceRunner
Ahmet Metin Yilmaz
5 (1)
偶発的な価格急騰の影響を受けずにトレンドを検出するように設計された PriceRunner インジケーター。 ノイズ削減のために、Price Series といくつかの移動平均を使用します。 M1 を含め、複数の時間枠で動作します。 効果を高めるには、M1 グラフィックにデフォルトのパラメーターを使用することをお勧めします (スクリーンショットを参照)。 他の時間枠の設定を変更できます。 このインジケーターの使用例: ゴールドがブルーにクロスし、ゴールドとブルーの両方がグレーの下にある場合、有望な売りシグナルである可能性があります。 このインジケーターからシグナルを取得するには (プロのエキスパート ユーザー向け): ゴールド: バッファー番号。 0、青: バッファ番号。 1、灰色: バッファ番号。 2 このインジケーターは同じロジックを使用し、「TripleS インジケーター」を計算しますが、チャート ウィンドウではなく別のウィンドウに描画します。以前に「TripleS インジケーター」を販売した場合、これも販売することをお勧めしません。スクリーンショットを見て、最初にデモをテ
BuySellEA
Ahmet Metin Yilmaz
SrEwo Expert adviser designed and optimized for EURUSD. You may Optimize all other instruments. It is easy to use.  *** It uses only M5 chart graphic and you need to use M5. ( Both test and live ) Input Parameters: Lots: Base lot amount.Expert use this amount as referance.  crossfactorlimit: expert will open new order with this limit modifylimit & TP limit : order modify and another TP limit. targetprofit : expert calculates this number in its logic. crossfactor : next order lots multiply with t
Expert works H1 timeframe only There are two main criteria. Daily pivots and moving averages. To open a buy order, today's daily pivot must greather than the day before's daily pivots.  Moving averages for EURUSD pair as default. They can be changed for other pairs and also for EURUSD too. You can also change takeprofit and stoploss level. expert doesnt trade on mondays and before 2 hour on other trade days. You can test and optimize for all pairs with extern parameters. Do not purchase without
Psr1EA
Ahmet Metin Yilmaz
Psr1 EA is the one of Psr series EAs. It works on 5 minutes chart only. You can use this EA any currencies but you should optimize first. Default parameters belongs to my broker databases EURUSD M5 . It uses pivot  and 2 main moving averages.  Moving averages can be adjustable by user. ( for optimizing ) Input Parameters:  MagicNum: Expert will use this number to determine experts orders. Lots: Lots amount which you want to use. Default is 0.01 ( it can be cahnged by expert due to your broker's
Psr3EA
Ahmet Metin Yilmaz
Psr3 EA is the one of Psr series EAs. It works on 5 minutes chart only. You can use this EA any currencies but you should optimize first. Default parameters belongs to my broker databases EURUSD M5 . It uses pivot  and Support/Resistance Levels.  Stoploss and Takeprofit can be adjustable by user. ( for optimizing ) Input Parameters:  MagicNum: Expert will use this number to determine experts orders. Lots: Lots amount which you want to use. Default is 0.01 ( it can be cahnged by expert due to you
Indicator values are in the range 0-100. The greater is the indicator value, the greater is the market stability, so the more likely we have trend. The smaller is the indicator value - the less probable the trend is. Tips: Trading on unstable market:     Buy, when moving average (blue line) of the CMI indicator is below 40 and the histogram is red.     Sell when moving average (blue line) of the CMI indicator is below 40 and the histogram is green.     Close positions when CMI his
SIGNALINE INDICATOR This indicator for all pairs and all timeframes I have just completed the M5 timeframe for deep optimization EURJPY yet. EURJPY M5 Optimization ( TP=150 , SL=130 , IndicatorPeriod=6 , Mov1=22 , Mov2=48 ) (*)Added 20.05.2019 You can find this signal page below https://www.mql5.com/en/signals/583477 Other optimizasyon results will be added on this signalpage. Input Parameters: IndicatorPeriod: Default is 8. Mov1               : Default is 21. Mov2               : Default is 48.
Expert's signal link has been working on 25 different instruments since 09.07.2019. It will be stopped after a while. https://www.mql5.com/en/signals/605823 This expert advisor works well on daily charts. Opens a pending order based on daily price movements and may revise this pending order based on price movements during the day.  It can keep the current order by following the price movements and can open two different types of additional orders as soon as it sees the opportunity. If he sees t
フィルタ:
レビューなし
レビューに返信