Historical Month Levels
- インディケータ
- Evgeniy Aksenov
- バージョン: 1.2
- アクティベーション: 5
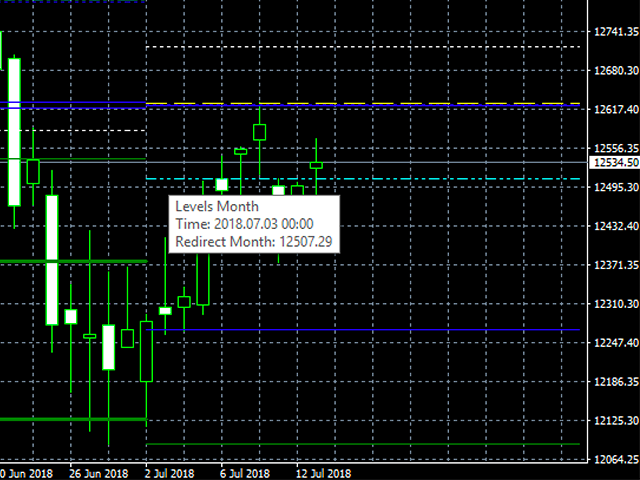
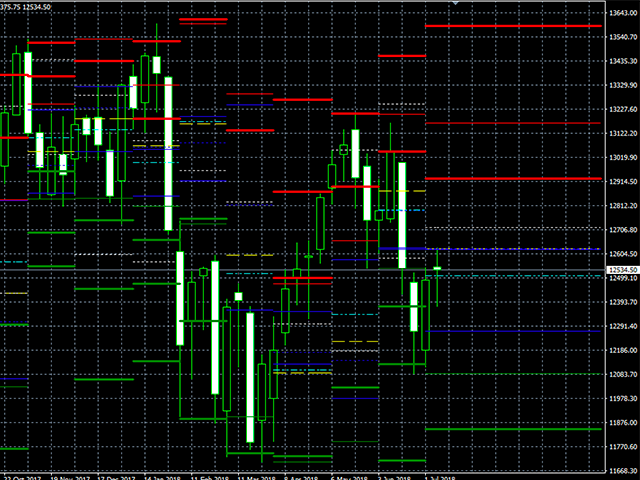
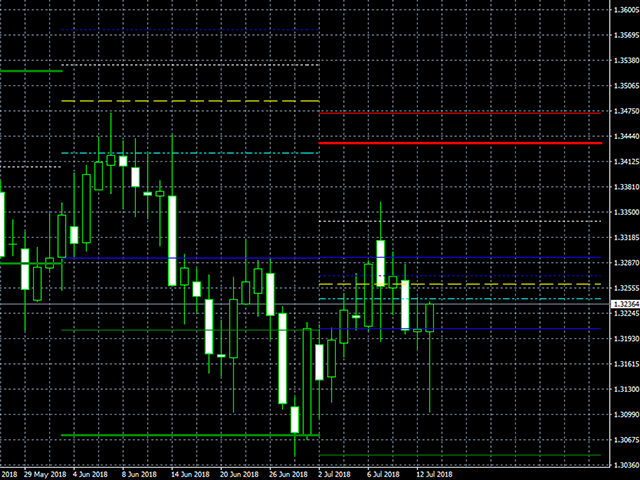
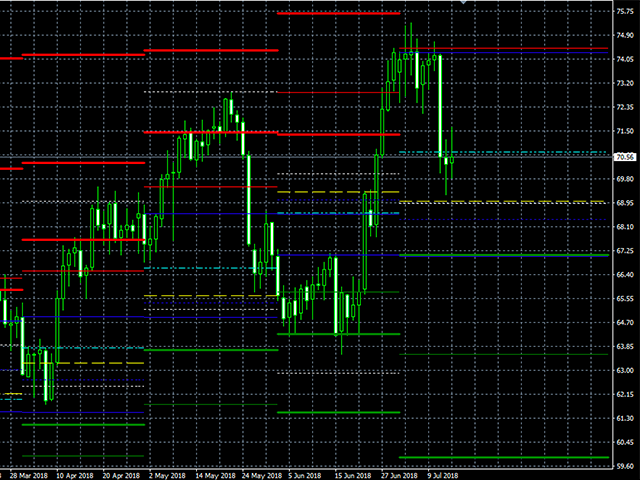
Indicator builds the following historical month levels:
- Resistance Levels — a price level above which it is supposedly difficult for a security or market to rise:
- R3 Month — monthly resistance price #3;
- R2 Month — monthly resistance price #2;
- R1 Month — monthly resistance price #1;
- Support Levels — a price level below which it is supposedly difficult for a security or market to fall.
- S1 Month — monthly support line price #1;
- S2 Month — monthly support line price #2;
- S3 Month — monthly support line price #3;
- Extremes Levels — a maximum and minimum price of a month:
- High Month — maximum month price;
- Low Month — minimum month price;
- Forecast Extremes Levels — a maximum and minimum forecast price of a month:
- Project High Month — maximum forecast month price;
- Project Low Month — minimum forecast month price;
- Middle Month — middle month price;
- Period levels — an open and close price of the month:
- Open Month — opened month price;
- Close Month — closed month price;
- Direct Month — forecast direction of month price;
- Redirect Month — monthly price, where the direction of price movement has changed.
Indicator parameters:
- History month limit:
- 0 — no limits (default);
- N — display N months;
- OpenColor — color for open month level (default: Blue);
- OpenLineStyle — line style for open month level (default: Solid);
- CloseColor — line style for close month level (default: Blue);
- count:
- 0 — display levels based on calculation current month;
- 1 — display levels based on calculation previous month (default);
- N — display levels based on calculation previous N month;
- MiddleColor — color for middle month level (default: Yellow);
- RedirectColor — color for redirect month level (default: Aqua);
- HighColor — color for high month level (default: Red);
- LowColor — color for low month level (default: Green).
