Stepping Trend
- インディケータ
- Mpendulo Chiliza
- バージョン: 1.0
- アクティベーション: 5
The Stepping Trend Indicator
The Stepping Trend indicator uses the average true range (ATR indicator) in its calculation. This gives you control to set your own average true range period, I set the Default as 10.
Indicator Details.
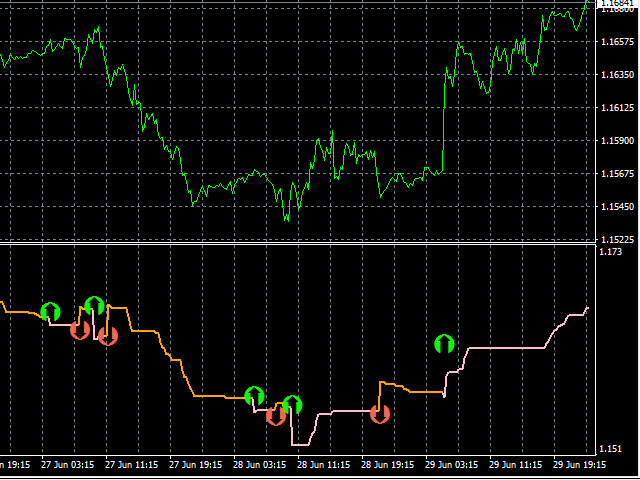
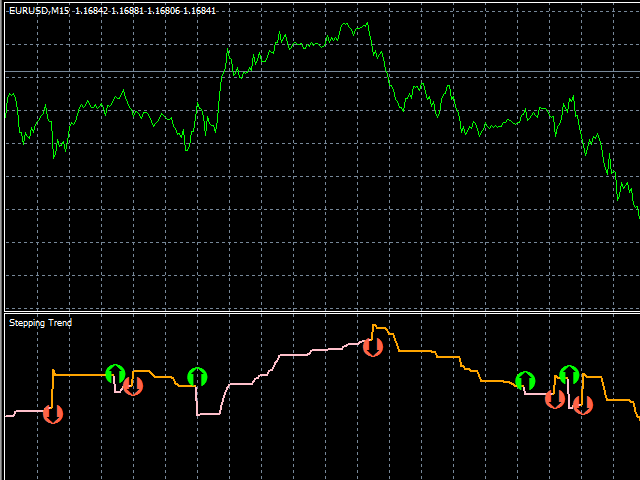
Green Arrow Up: This means you are at the starting point of a new bullish trend, it’s time to buy.
Red Arrow Down: This means you are at the starting point of a new bearish trend, it’s time to sell.
What if you miss the Arrow Signal?
No problem, I have a solution for you, that’s why its called the stepping trend, As the trend gets strong, so do more steps appear, here is how you should read the Pink and yellow line AKA Steps .
Pink Steps (Line): This means you currently in a bullish trend, so its means it’s still safe to buy, but we do not know when will this trend end, so be careful.
Yellow Steps (Line): This mean you are currently in a bearing trend. Again we cannot be sure when will it end, so it’s safe to look out for the signal arrow.
It’s so easy to use the Stepping Trend indicator, you know exactly when to buy and sell.
NO STOP LOSS: To get the maximum profit, do not put a stop loss, But Exit the trade only when the Stepping indicator signals a change in trend.
Continuous Trading: The Stepping Trend makes it easy for you to profit from an upwards and downwards trend, you can do this by:
- Green Arrow Up: open a Buy
- Red Arrow Down: Close buy trade and open a Sell
- Green Arrow Up: Close sell trade and open a Buy
- Red Arrow Down: Close buy trade and open a Sell
Repeat...
You can use any timeframe.


ユーザーは評価に対して何もコメントを残しませんでした