Culmination candle x2 free
- インディケータ
- Andrii Malakhov
- バージョン: 1.11
- アップデート済み: 24 7月 2018
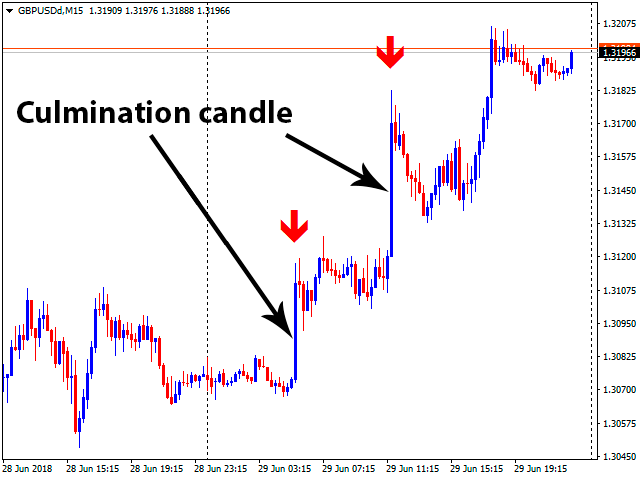
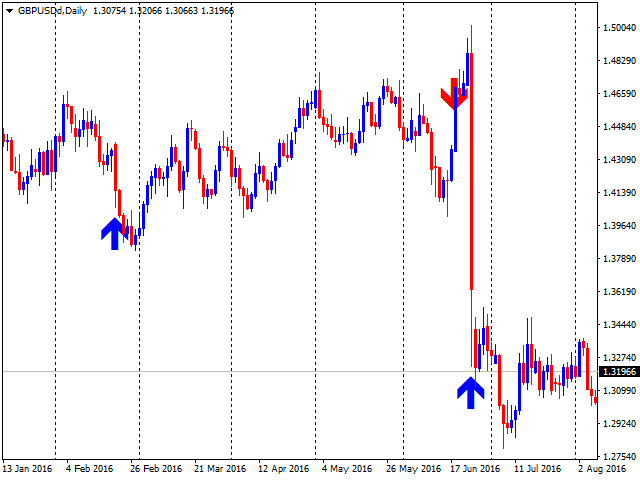
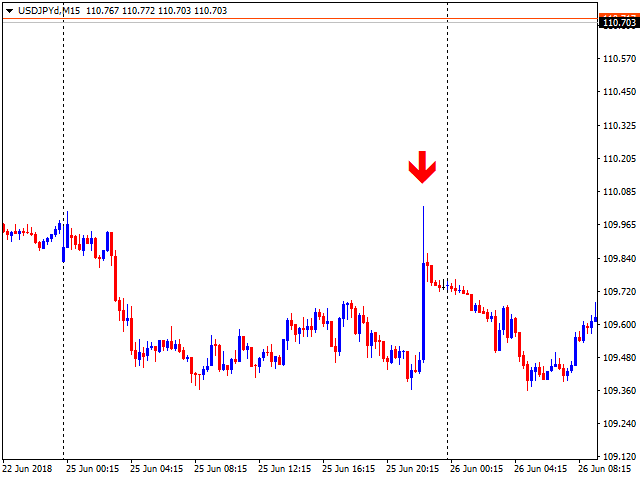
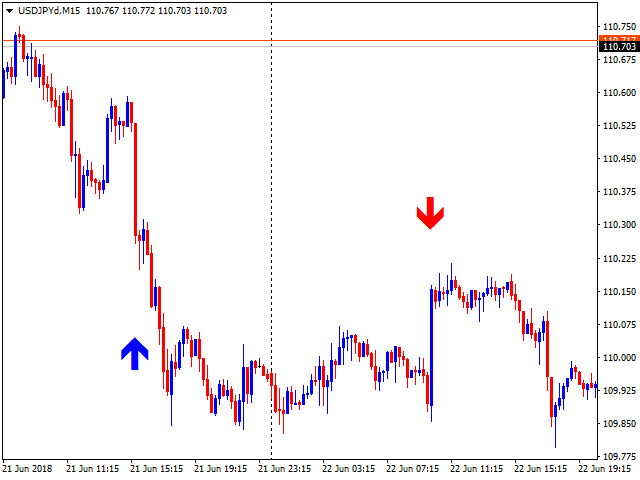
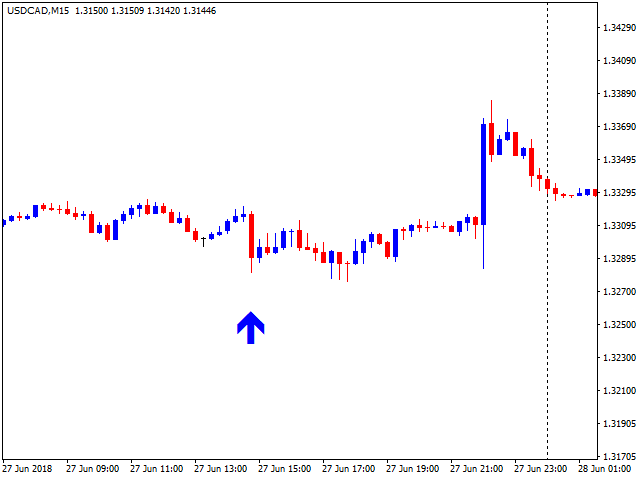
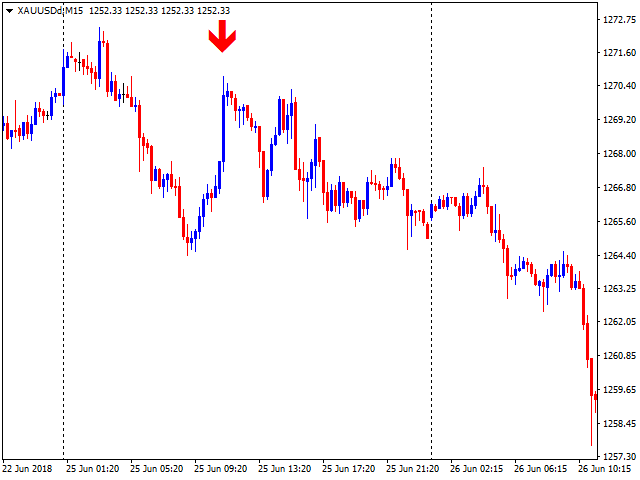
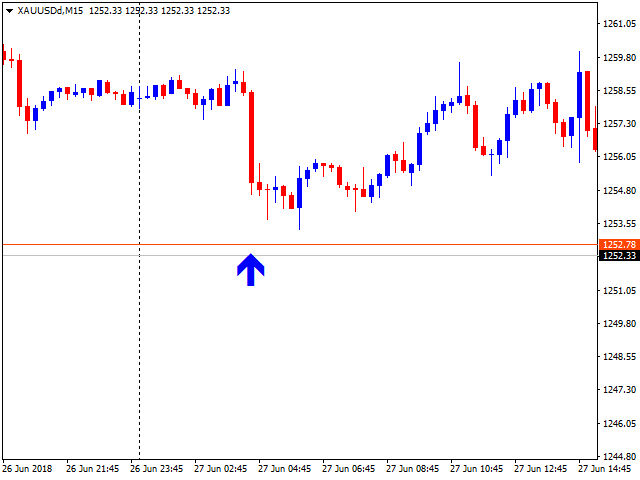
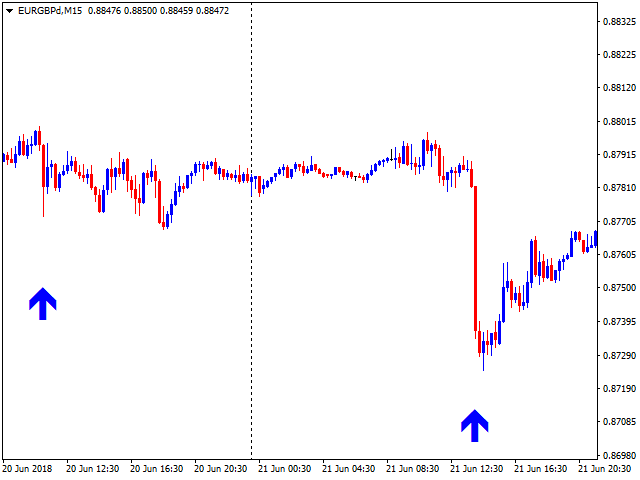
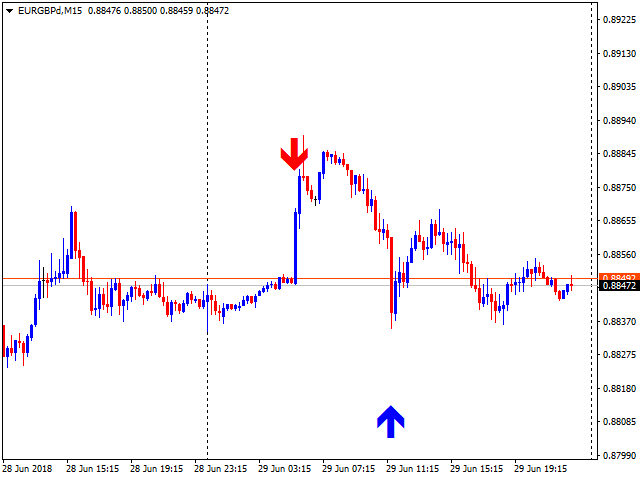
The indicator searches for the largest candles with minimum wicks for the last X candles. Sometimes, such candles mark the presence of a strong buyer, who quickly and strongly pushes the price in the right direction. However, most often, these are culmination candles, especially at the end of a prolonged trend when a single large candle knocks out stop losses of the most persistent traders and the price reverses instantly.
The indicator allows you to open a position on the very edge of the market, in counter-trend, behind the culmination candle, with a minimal stop loss.
Stop losses and trailing stop are mandatory. This allows you to get maximum profit during a correction.
This version works only on USDCAD! The full version of the indicator can be purchased here - https://www.mql5.com/en/market/product/30272
Advantages
- When you open a trade on the indicator signal, the stop is minimal.
- The indicator has signal buffers - it can be connected to EAs as a signal indicator.
- No repainting.
- The EA works on any timeframe. It is best to search for signals on M15-H1.
Options
- History_for_analise - number of candles to analyze when searching for a signal.
- PercentBigCandles - percentage of the largest candles. The optimal values are 1-2%. This means, the indicator will show only signals only on 1-2% of the longest candles in history.
- Alert_Culmination_candle - signal alert.
- Filter_by_MA20 - only search for culmination candlesticks with the base near MA20.
- Value_near_MA20 - optimal 50 pips - the maximum distance for the base of the culmination candlesticks, with which the candlestick is considered a culmination.
- Distance - distance from a candle where the arrow is displayed, in pips.
- SendToEmailAndPush - send emails and push messages when a new signal appears.
If you have any questions about the operation of the indicator, feel free to ask them in the Comments or in private messages.

ユーザーは評価に対して何もコメントを残しませんでした