Lines for MT4
- インディケータ
- Radim Kucera
- バージョン: 1.1
- アップデート済み: 29 6月 2018
- アクティベーション: 5
Do you need to check support and resistance lines?
Do you need to find them really fast and automatically?
Do you want to set your own settings how to find them?
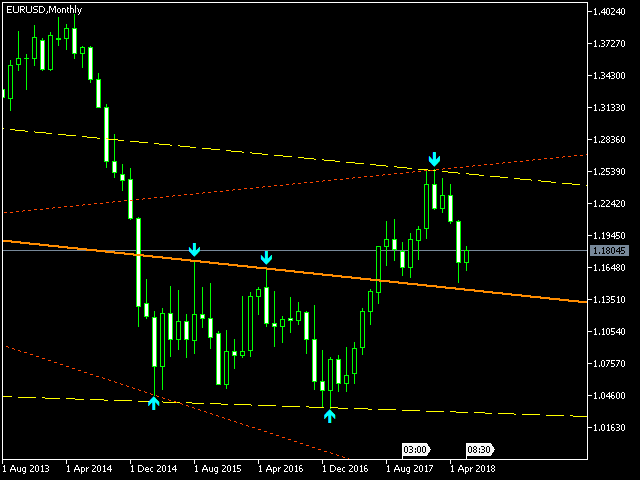
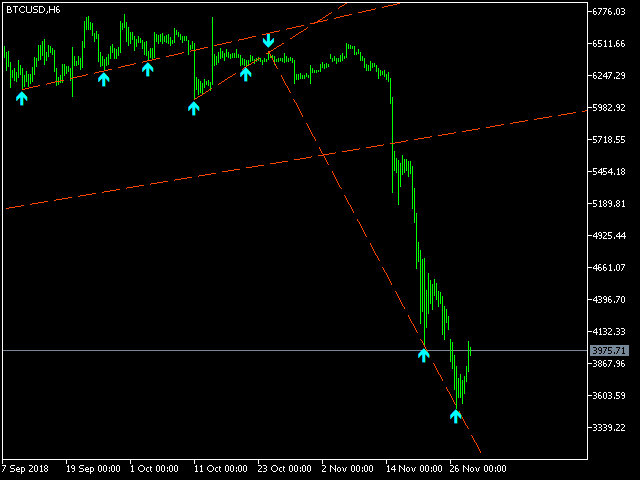
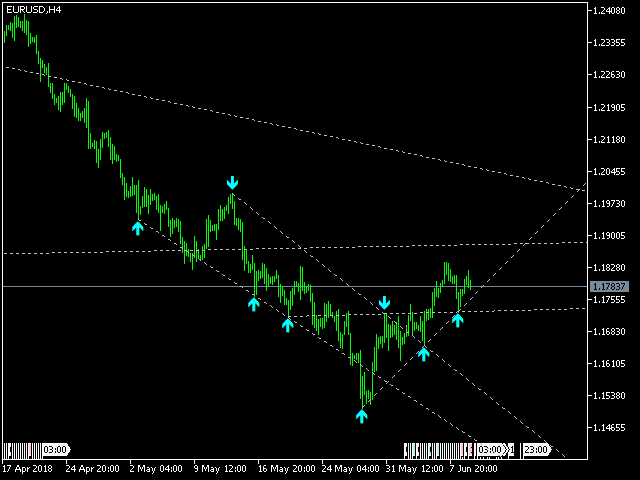
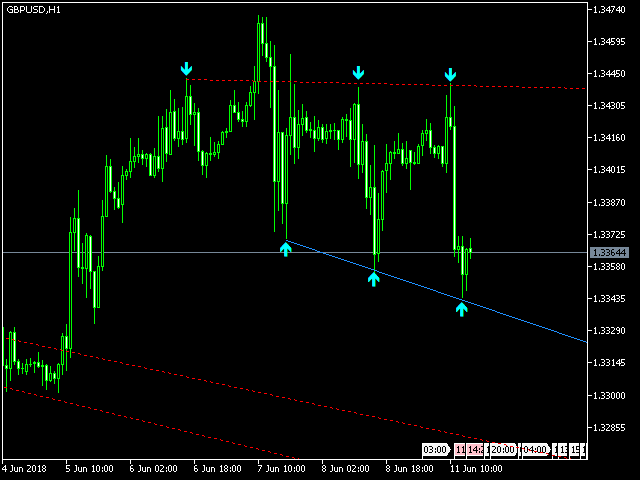
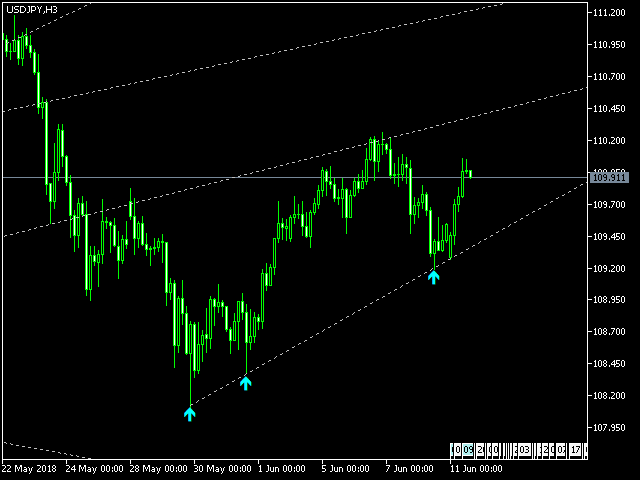
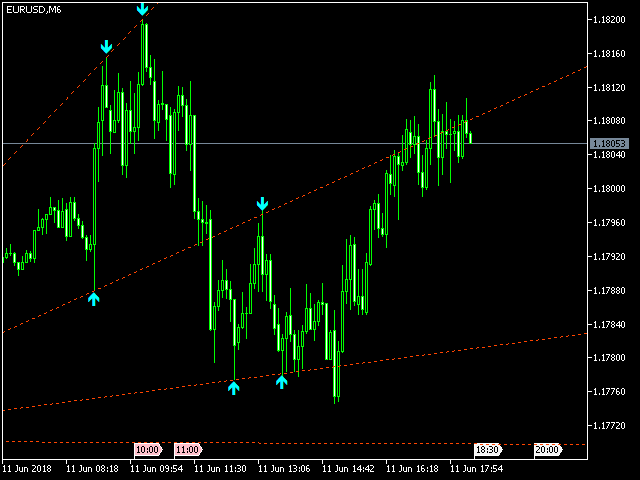
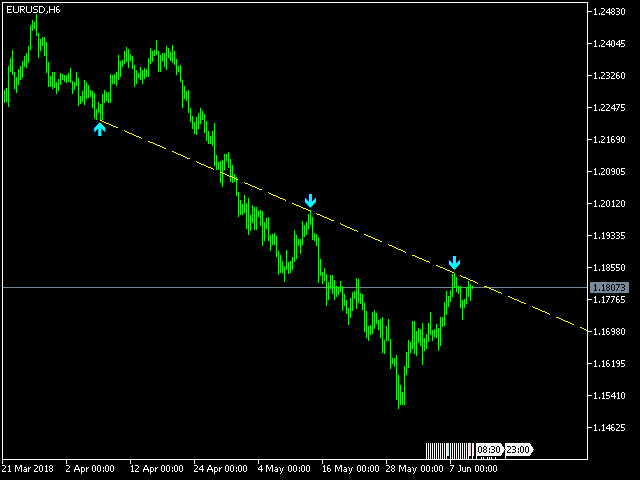
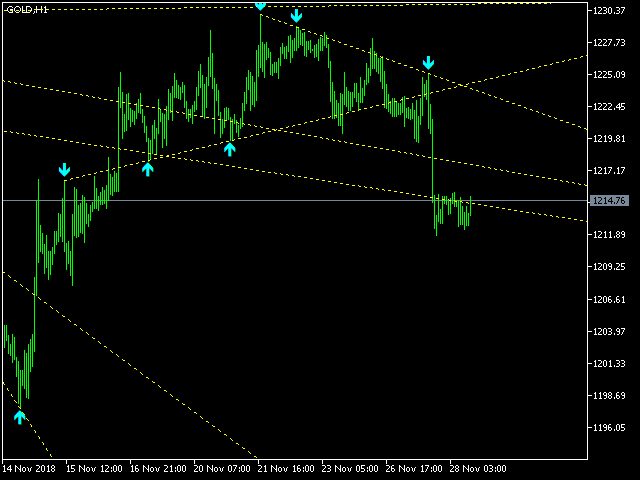
Indicator Lines is developed for finding support and resistance lines on chart. It does its job quickly and fully automatically.
Main principle of algorithm is to get all extremes on chart (according to "Density" parameter). Then indicator tries to find minimally 3 points (according to "Minimal count of points" parameter) which can be used for calculation of support or resistance line. Finally there is applied linear regression for construction of lines.
Parameters
- Density - how much in details to search in extremes. Bigger number means less details, smaller number means more details. Base unit is 1 bar on the chart.
- History - how far to go in history while searching. When you set -1, the indicator processes all bars from history. Base unit is 1 bar on the chart.
- Range - how far search support and resistance lines from given extreme. Base unit is 1 bar on the chart.
- Minimal count of points - how many extremes is used for construction of lines.
- Maximal deviation - Difference between perfect line and real line. Base unit is %.
- Color, width, style of lines
- Prolong lines to future - great feature for checking breaking lines in future
- Show points of lines - if you want to see how the lines are constructed
- Color of points
- Your own prefix for object - in case you want to attach more Lines on same chart
Final line is constructed as linear regression from all found points.