Velox
- インディケータ
- Marco Aurelio Almeida
- バージョン: 1.0
- アクティベーション: 8
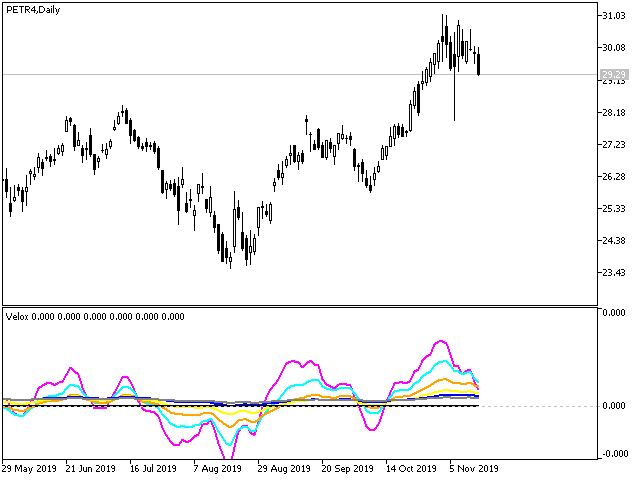
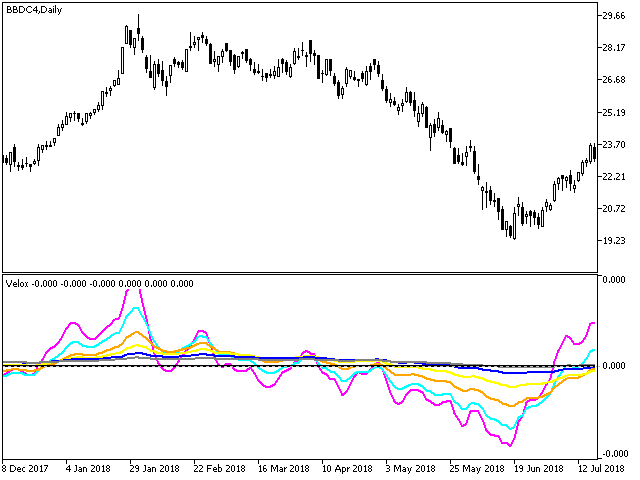
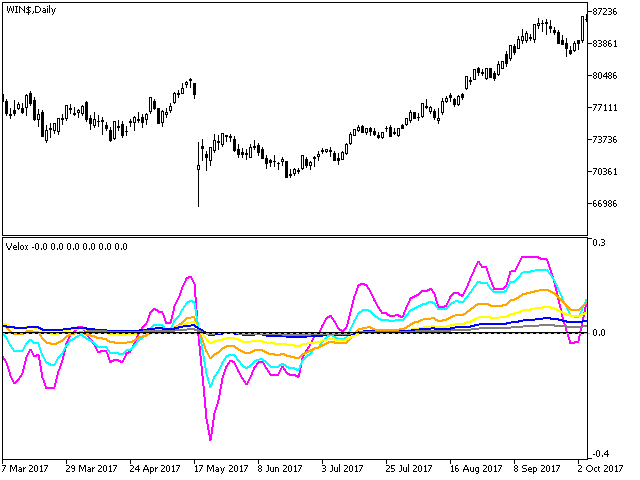
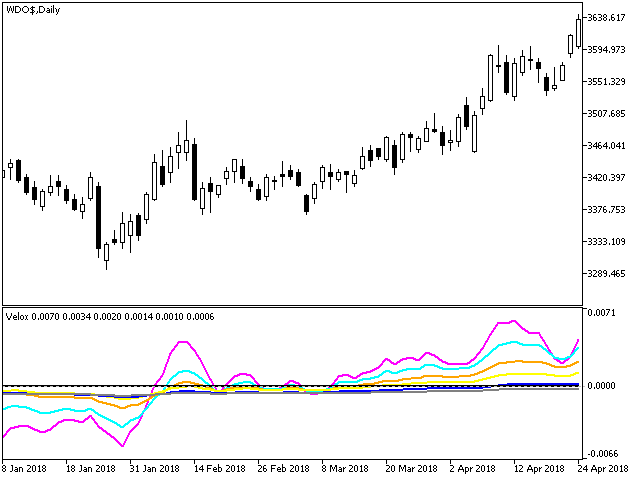
Velox indicator
Velox is a indicator that shows the tendency, force and direction of price based on the fractal 5-3.
Negotiation strategy
Composed of 6 lines that oscillate above and below axis 0. Each line represents a fractal that is calibrated by Phi³.
To identify a bullish trend, all rows must be above zero. Already a downtrend, all rows should be below zero.
Indicator Parameters:
- Period - Number of bars for indicator calculations. The user can select the shortest, medium and longest period.
Examples:
See examples on the images and videos.