RedYGreem
- InpRSIshort=13; // RSI short
- InpRSIPeriod=34; // RSI long
- PeriodRs=0; //Price 0C 4HL/2 5HLC/3
- mafast=13;//mafast
- maslow=65;//MAslow
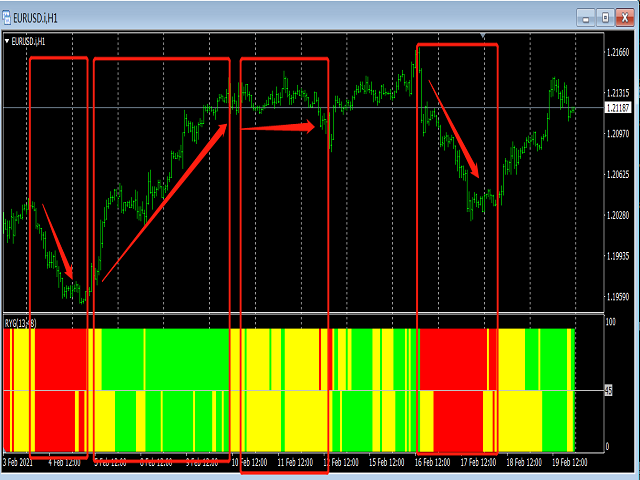
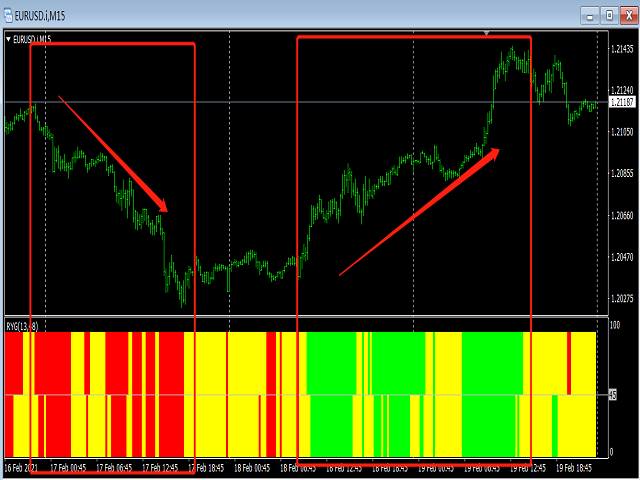
Double line RSI sub graph index.The parameters are adjustable.The RSI lines with two different cycles can be used to observe the trend strength effectively.Meanwhile, a short period cross long period color column image is displayed below.When the cycle (Jin Cha) is on the short cycle, the color of the column map changes from the light green to the purple red. When the short period is long period (dead fork), the color of the column map changes from the purple red to the light green. The short periodic line shows the purple red when it is above the long periodic line. The short periodic line shows the light green at the bottom of the long period line.It means that the current gap is strong.At the same time, the column diagram of MACD was integrated and displayed in the lowest position in color column diagram.When the color of the column is yellow from green, it means DIF rising to indicate that the trend is back to the bottom; when the color of the column map is red from yellow, the trend is stronger for the 0 axis on the MACD DIF.When the color of the column is yellow from red to DIF, the trend slows down; when the color of the column is changed from yellow to green, the 0 axis is worn down for DIF, and the trend is turned from multi head to empty head.If the color changes frequently in recent columns, it shows that the market is in the concussion zone.The parameters are adjustable.













middel