Multi TimeFrames Stochastic Signals
- インディケータ
- Valter Pegoraro
- バージョン: 1.0
- アクティベーション: 5
This indicator is based on the Stochastic on one or more timeframes and on any Currency Cross Pair.
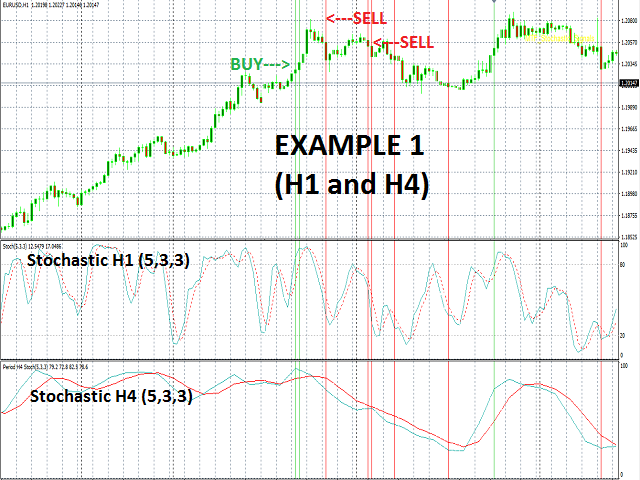
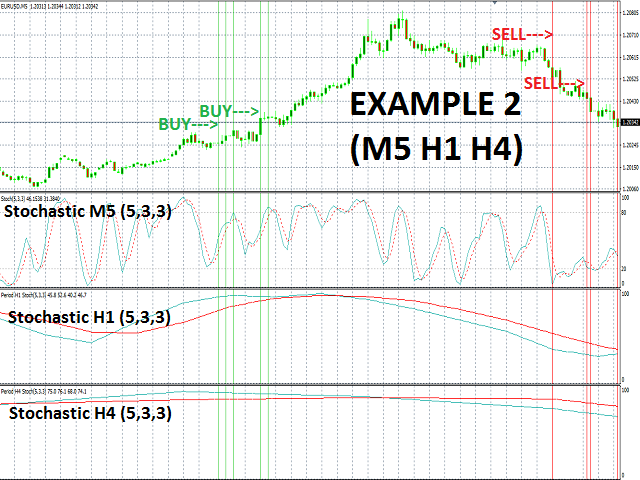
The indicator generates an alert message when it detects a buy or sell signal. It also draws a vertical bar on the price chart: green for buy or red for sell, yellow if flat.
Alert messages and Vertical bars for BUY or SELL, are generated when the Stochastic is consistent for all chosen timeframes else a FLAT signal is generated.
Features
Easy flexible settings:
- Detection of the Stochastic signal for one or more timeframes
- Setting levels of Stochastic
Good results are obtained with default parameters.
For example: you attach the indicator to a chart with H1, set the Active_Stochastic_for_H1 to "true" and the Active_Stochastic_for_H4 to "true" (standard setting).
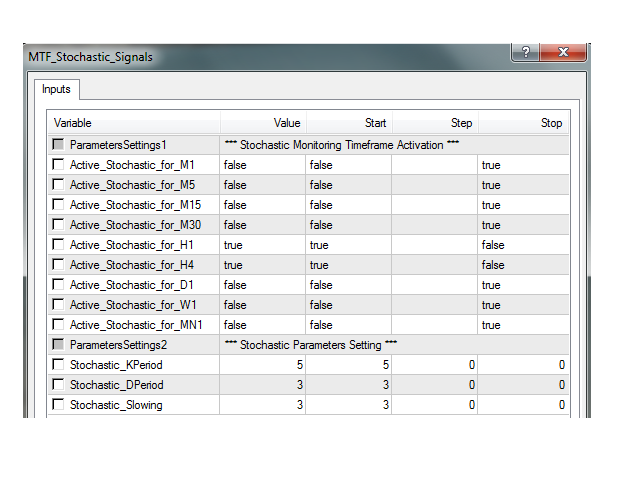
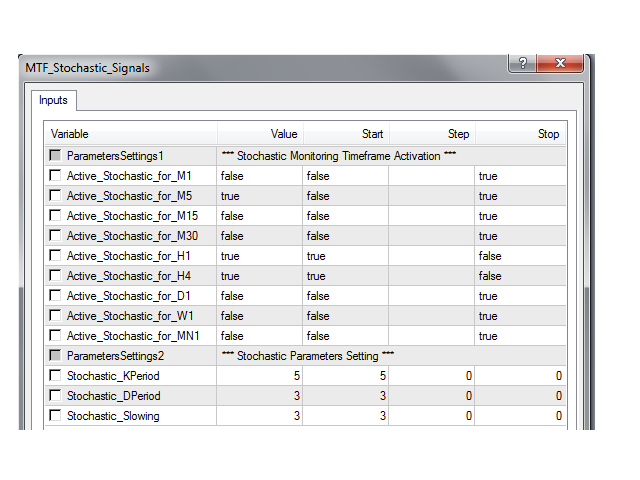
The standard settings of the Stochastic parameters are:
- KPeriod=5
- DPeriod=3
- Slowing=3
However you can set the “Active_Stochastic “ parameters as you want (example: only H1, or M5 and H1, etc.). And so also for the Stochastic parameters.
Parameters
Stochastic Monitoring Timeframe Activation
- Active_Stochastic_for_M1 - true/false.
- Active_Stochastic_for_M5 - true/false.
- Active_Stochastic_for_M15 - true/false.
- Active_Stochastic_for_M30 - true/false.
- Active_Stochastic_for_H1 - true/false.
- Active_Stochastic_for_H4 - true/false.
- Active_Stochastic_for_D1 - true/false.
- Active_Stochastic_for_W1 - true/false.
- Active_Stochastic_for_MN1 - true/false.
Stochastic Parameters Setting
- Stochastic_KPeriod - period for calculating Stochastic %K line.
- Stochastic_DPeriod - period of averaging for calculating the %D line.
- Stochastic_Slowing - value of slowing.
Note
In the Screenshots of examples, the Stochastic oscillator that appears in separate windows is not the work of "MTF_Stochastic_Signals".
You can see it if you use the standard MT4 oscillator or other free program (example #MTF Stochastic 2.0).