Standard deviation with levels
- インディケータ
- Yaroslav Barabanov
- バージョン: 1.0
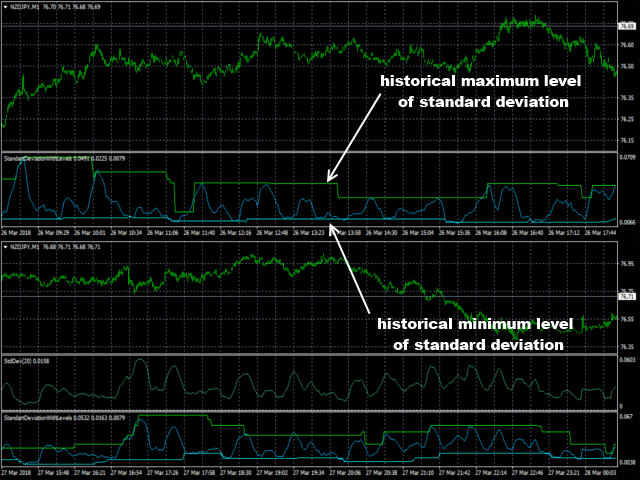
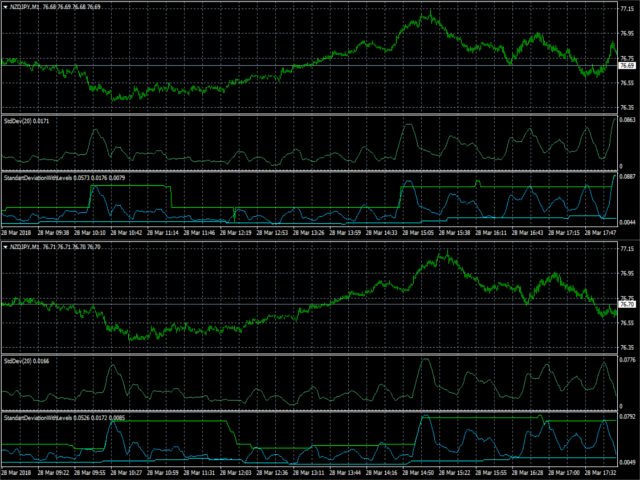
Standard deviation with levels is a modification of the Standard deviation indicator, supplemented by the levels of expected Highs and Lows. The levels are plotted using the Support and resistance bands indicator, which determines the High and Low levels nearest to the current indicator value based on the historical values of the extremes.
Parameters
- standard deviation period - period of the standard deviation indicator.
- extremum detector period - period of extremum detection. This parameter affects the sensitivity to peak values of the standard deviation. The higher the parameter value, the higher peak values of the standard deviation will be used as historical minimums and maximums of the indicator.
- number of extrema - the number of peak values of the standard deviation minimums and maximums. The higher the parameter value, the more High and Low levels close to the current value are displayed by the indicator. The minimum value of this parameter is 1.
How to use the indicator
It is necessary to select the suitable values for extremum detector period and number of extrema. The extremum detector period parameter should be greater than or equal to standard deviation period. The number of extrema parameter can take values above 1. However, there is no point in making it too large, since false levels may appear. The High and Low levels should help in predicting the maximum standard deviation value in the future.
