• 概要
  • レビュー
  • コメント (2)

Harmonic Master scanner

Harmonic Master Scanner is a dynamic tool that helps harmonic traders to identify and draw harmonic patterns on the chart.

Harmonic Master Scanner is a software designed to work in MetaTrader 4.

Harmonic Master Scanner works based on original MetaTrader 4 Zigzag indicator and the standard harmonic patterns elements.

This software can send alert and email to you when a Harmonic pattern is detected on any charts.

The entry point is the "D" point.

The scanner only shows the present pattern one by one no historical patterns (you can use the backtest to build your own strategy).

Because the full dependence on Zigzag indicator the scanner may redraw the "D" point (only the "D" point) or give fake alerts in case of pattern failure, so I strongly recommended you to use additional strategy to open trades like price action or divergence or as your own.

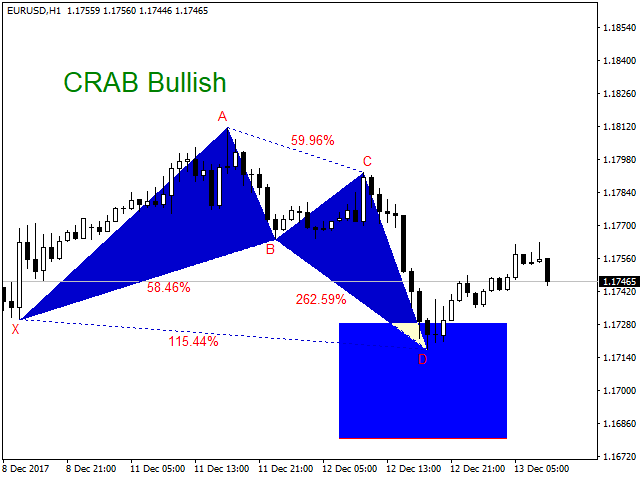
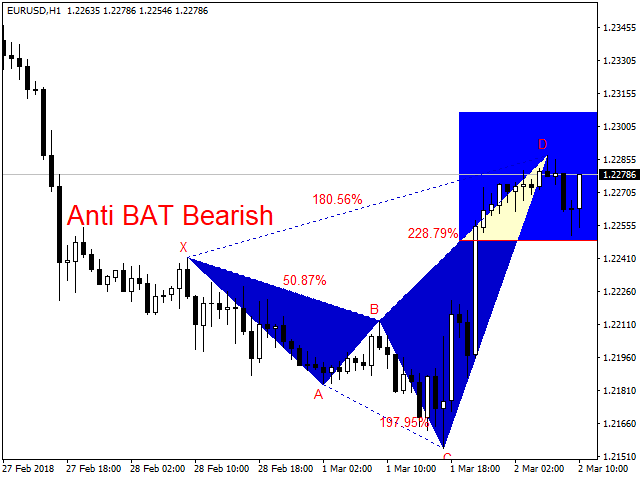
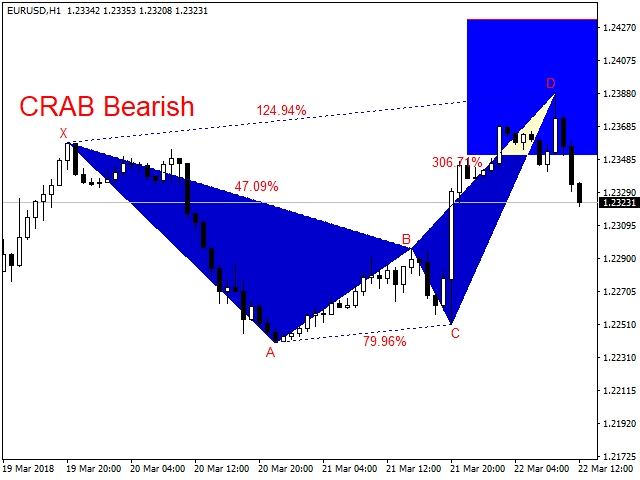
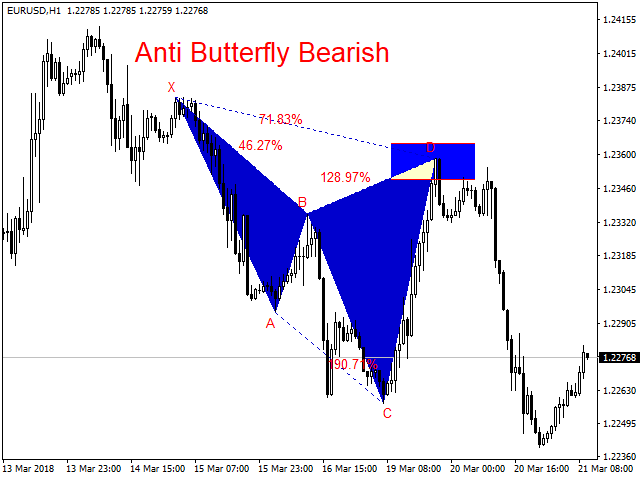
The scanner represents the PRZ zone by a rectangle and the significant Fibonacci retracements from XA by red Lines.

I have added the Fibonacci Time Zones tool to validate the time correction of the patterns, recommended correction is between 0.382% and 1.618% and the equivalent one at 100% is the best.

The scanner includes 17 harmonic patterns (AB=CD – Gartley – Bat – Butterfly – Crab – Shark – Alternate Bat – Deep Crab – Cypher – Nen Star – Anti Gartley – Anti Bat – Anti Butterfly – Anti Crab – Anti Shark – Anti Cypher – Anti Nen Star).


Indicator Inputs

  • "ZigzagDepth", "ZigzagDeviation", "ZigzagBackstep" - Zigzag indicator inputs.
  • "PercentAfter", "PercentBefor" - to give the scanner some flexibility you can add a percentage range before and after the individual elements like "B" point in the Gartley pattern. The percent is from the original Fibonacci retracements (means 0.5% from 0.618 before and 5% from 0.618 after as example).
This flexibility percentage only applied to:
  • "C" and "B" points in AB=CD pattern.
  • "B" point in Gartley, Butterfly, Alternate Bat and Deep Crab patterns.
  • "D" point in Anti Gartley pattern.
  • "UseABCD", "UseGartley", etc - Pause or stop scan for one or more patterns.
  • "BearishWave", "BearishLabels", "BearishPRZ", "BullishWave", "BullishLabels", "BullishPRZ" - management for color visualizations.
  • "SendAlert", "SendEmail" - Notification management.
  • "ShowFiboTimes", "FiboTimesColor" - Fibonacci Time Zones tool management.
おすすめのプロダクト
Was: $249  Now: $149   Market Profile defines a number of day types that can help the trader to determine market behaviour. A key feature is the Value Area, representing the range of price action where 70% of trading took place. Understanding the Value Area can give traders valuable insight into market direction and establish the higher odds trade. It is an excellent addition to any system you may be using. Blahtech Limited presents their Market Profile indicator for the MetaTrader community. In
これは、キャンドルの終値を予測する指標です。 このインジケータは、主にD1チャートでの使用を目的としていますが. この指標は、従来の外国為替取引とバイナリオプション取引の両方に適しています。 インジケーターは、スタンドアロンのトレーディングシステムとして使用することも、既存のトレーディングシステムへの追加として機能させることもできます。 このインジケーターは、現在のキャンドルを分析し、キャンドル自体の内部の特定の強度係数と、前のキャンドルのパラメーターを計算します。 したがって、この指標は、市場の動きのさらなる方向性と現在のキャンドルの終値を予測します。 この方法のおかげで、この指標は、短期の日中取引だけでなく、中期および長期の取引にも適しています。 インジケーターを使用すると、市場の状況の分析中にインジケーターが生成する潜在的な信号の数を設定できます。 インジケーターの設定には、このための特別なパラメーターがあります。 また、インジケーターは、チャート上のメッセージの形式で、電子メールで、およびPUSH通知の形式で、新しい信号について通知することができます。 購入後は必ず私に書いて
EARLY REMINDER: The Starting price is 65 price will rise soon up to 365$ and then 750$ after first 10 copies of sales. Grab this offer now! Introduction Hello, traders! Welcome to the demonstration of the Forex Beast Indicator , a comprehensive tool designed to assist aspiring traders in navigating the complexities of the forex market. This indicator incorporates seven essential components to provide a well-rounded trading experience: Moving Averages Colored Zones Support and Resistance Levels
これはほぼ間違いなく、MetaTraderプラットフォームで見つけることができる最も完全な調和価格形成自動認識インジケーターです。 19種類のパターンを検出し、フィボナッチプロジェクションをあなたと同じように真剣に受け止め、潜在的逆転ゾーン(PRZ)を表示し、適切なストップロスとテイクプロフィットレベルを見つけます。 [ インストールガイド | 更新ガイド | トラブルシューティング | よくある質問 | すべての製品 ] 19の異なる調和価格形成を検出します プライマリ、派生および補完フィボナッチ投影(PRZ)をプロットします 過去の価格行動を評価し、過去のすべてのパターンを表示します この指標は、独自の品質とパフォーマンスを分析します 適切なストップロスとテイクプロフィットのレベルを表示します ブレイクアウトを使用して適切な取引を通知します すべてのパターン比をグラフにプロットします 電子メール/音声/視覚アラートを実装します スコット・M・カーニーの本に着想を得て、この指標は最も純粋で急を要するトレーダーのニーズを満たすように設計されています。ただし、トレードを容易にする
The Penta-O is a 6-point retracement harmonacci pattern which usually precedes big market movements. Penta-O patterns can expand and repaint quite a bit. To make things easier this indicator implements a twist: it waits for a donchian breakout in the right direction before signaling the trade. The end result is an otherwise repainting indicator with a very reliable trading signal. The donchian breakout period is entered as an input. [ Installation Guide | Update Guide | Troubleshooting | FAQ | A
Introduction to Chart Pattern MT Chart Pattern MT is a chart pattern scanner to detect the triangle pattern, falling wedge pattern, rising wedge pattern, channel pattern and so on. Chart Pattern MT uses highly sophisticated chart pattern detection algorithm. However, we have designed it in the easy to use with intuitive user interface. Chart Pattern MT will show all the patterns in your chart in the most efficient format for your trading. You do not have to do tedious manual pattern detection an
ナイト ゴースト - バイナリ オプションの矢印インジケーター。 これからのあなたの頼もしいアシスタントです! 11 - チャートの再描画なし - すべての通貨ペアで大活躍! -インジケータの精度は最大 90% (特に夜間) ・長時間の設定不要(バイナリーオプションに最適な設定) - 信号が遅れない - 現在のローソク足でのシグナルの出現 ・M1期にピッタリ(No More!) ・目に優しいキャンドルカラー(赤・青) -インストールされたアラート それを扱う: - 青い矢印は信号アップを示します -赤い下向き矢印 M1 以上のインジケーターをチャートに配置しないでください. シグナルの精度が低下します! インジケーターのスクリーンショットとビデオを見る
This unique multi-currency strategy simultaneously determines the strength of trends and market entry points, visualizing this using histograms on the chart. The indicator is optimally adapted for trading on the timeframes М5, М15, М30, Н1. For the convenience of users, the indicator renders the entry point (in the form of an arrow), recommended take profit levels (TP1, TP2 with text labels) and the recommended Stop Loss level. The take profit levels (TP1, TP2) are automatically calculated for
It will be the best tool for you to make a profit! Through unique algorithms You're going to see an amazing amount of right trading signals Make huge profits every day and realize more possibilities!   Like the car no money to buy it, the love of the girls dare not to pursue?Or the credit card bill is not paid, the rent does not have the extra money to settle?Or are you fed up with being bossed around by your boss and Hope to get more people's respect?Can't afford to buy the things you want ? wa
Crypto_Forex MT4 用インジケーター「3 Black Crows パターン」 - インジケーター「3 Black Crows パターン」は、プライスアクション取引に非常に効果的です。再描画なし、遅延なし。 - インジケーターは、チャート上の弱気な「3 Black Crows」パターンを検出します。チャート上の赤い矢印信号 (画像を参照)。 - PC、モバイル、および電子メールアラート付き。 - また、その兄弟である強気な「3 White Soldiers パターン」インジケーターも利用できます (以下のリンクに従ってください)。 - インジケーター「3 Black Crows パターン」は、サポート/レジスタンスレベルと組み合わせるのに最適です。 // より優れたエキスパートアドバイザーとインジケーターは、こちらで入手できます: https://www.mql5.com/en/users/def1380/seller これは、この MQL5 ウェブサイトでのみ提供されるオリジナル製品です。
This is a new strategy for SUPPLY DEMAND areas It is based on a calculation using the tick volume to detect the big price action in market for both bear /bull actions this smart volume action candles are used to determine the supply and demand areas prices in between main supply and demand lines indicate sideway market  up arrows will be shown when prices moves above the main supply and the secondary supply lines Down arrows will be shown when prices moves below the main demand and the secondary
BoxChart MT4
Evgeny Shevtsov
4.5 (6)
The market is unfair if only because 10% of participants manage 90% of funds. An ordinary trader has slim changes to stand against these "vultures". This problem can be solved. You just need to be among these 10%, learn to predict their intentions and move with them. Volume is the only preemptive factor that faultlessly works on any timeframe and symbol. First, the volume appears and is accumulated, and only then the price moves. The price moves from one volume to another. Areas of volume accumu
The Chaikin Oscillator is a technical indicator developed by Marc Chaikin that combines price and volume data to measure the accumulation and distribution of a financial instrument. It aims to identify potential buying and selling opportunities in the market. The Chaikin Oscillator is calculated by subtracting a 10-day exponential moving average of the Accumulation Distribution Line (ADL) from a 3-day exponential moving average of the ADL. Here's how to use the Chaikin Oscillator indicator in tr
トレンドトレーディング は、タイミングのプルバックとブレイクアウトにより、市場で起こっているトレンドから可能な限り利益を得るように設計された指標です。確立されたトレンドの中で価格が何をしているかを分析することにより、取引の機会を見つけます。 [ インストールガイド | 更新ガイド | トラブルシューティング | よくある質問 | すべての製品 ] 自信を持って効率的に金融市場を取引する むち打ちにならずに確立されたトレンドから利益を得る 収益性の高いプルバック、ブレイクアウト、早期の逆転を認識する この指標は、独自の品質とパフォーマンスを分析します 複数時間枠のダッシュボードを実装します インジケーターは再描画されていません 電子メール/音声/視覚アラートを実装します 確立されたトレンドは多くの取引機会を提供しますが、ほとんどのトレンド指標はそれらを完全に無視しています。インジケーターの解釈はかなり簡単です: (1) トレンドの変化 (2) トレンドの方向への後退 (3) トレンドの方向へのブレイクアウト 赤いダッシュ は下降トレンド中の修正です 青いダッシュ は上昇トレンド中
This is an indicator with real-time reminder function, which can realize real-time monitoring of four harmonic patterns of multiple cycles (30 minute chart, 1 hour chart, 4 hour chart, 1 day chart), and help traders to have insight into market reversal opportunities. Gartly Bat Butterfly Cypher Before loading into the chart, you need to manually input the switch parameters, which are the harmonic patterns   and time period you want to monitor: M30 / H1 / H4 / D1. It is on  when the corresponding
ADX Shark Scalper – The Ultimate Hybrid Indicator for Precision Scalping Dive into the markets with the ADX Shark Scalper , a powerful and versatile tool designed for traders who seek precision in every trade. This cutting-edge indicator seamlessly combines multiple advanced technical signals into one streamlined system, allowing you to spot good buy and sell opportunities with ease. At its core, the ADX Shark Scalper leverages the power of trend and momentum detection through the integration of
This indicator is, without a doubt, the best variation of the Gann Angles among others. It allows traders using Gann methods to automatically calculate the Gann angles for the traded instrument. The scale is automatically calculated when the indicator is attached to the chart. When switching timeframes, the indicator recalculates the scale for the current timeframe. Additionally, you can enter your own scales for the Gann angles. You can enter your own scales either for both vectors or for each
Crypto_Forex インジケーター「ダイナミックな売られ過ぎ/買われ過ぎゾーンを備えたフォース インデックス」MT4 用、リペイントなし。 - フォース インデックスは、価格とボリュームのデータを 1 つの値に組み合わせるトップ インジケーターの 1 つです。 - ダイナミックな買われ過ぎゾーンから売り取引を行い、ダイナミックな売られ過ぎゾーンから買い取引を行うのに最適です。 - このインジケーターは、トレンド方向へのモメンタム取引に最適です。 - ダイナミックな買われ過ぎゾーン - 黄色の線より上。 - ダイナミックな売られ過ぎゾーン - 青い線より下。 - フォース インデックス自体は、価格を動かすために使用される電力の量を測定する強力なオシレーターです。 - PC およびモバイル アラート付き。 // 優れたトレーディング ロボットとインジケーターは、こちらで入手できます: https://www.mql5.com/en/users/def1380/seller これは、この MQL5 Web サイトでのみ提供されるオリジナル製品です。
Was: $299  Now: $149   Supply Demand uses previous price action to identify potential imbalances between buyers and sellers. The key is to identify the better odds zones, not just the untouched ones. Blahtech Supply Demand indicator delivers functionality previously unavailable on any trading platform. This 4-in-1 indicator not only highlights the higher probability zones using a multi-criteria strength engine, but also combines it with multi-timeframe trend analysis, previously confirmed swings
Super Reversal Pattern Indicator Unlock the power of advanced pattern recognition with our Super Reversal Pattern Indicator. Designed for traders seeking precision and reliability, this indicator identifies one of the most effective reversal patterns in technical analysis, offering a significant edge in your trading strategy. Key Features: Non-Repainting Accuracy: Enjoy the confidence of non-repainting technology. Once a Super Reversal Pattern is detected, it remains static, providing consiste
123パターン は、最も人気のある強力で柔軟なチャートパターンの1つです。このパターンは、3つの価格ポイントで構成されています。ボトム、ピークまたはバレー、および38.2%〜71.8%のフィボナッチリトレースメントです。パターンは、価格が最後のピークまたは谷、インディケーターが矢印をプロットし、アラートを上昇させ、取引を行うことができる瞬間を超えたときに有効と見なされます。 [ インストールガイド | 更新ガイド | トラブルシューティング | よくある質問 | すべての製品 ] クリアな取引シグナル カスタマイズ可能な色とサイズ パフォーマンス統計を実装します カスタマイズ可能なフィボナッチリトレースメントレベル 適切なストップロスおよび利益レベルを表示します インジケーターを使用して、継続パターンまたは反転パターンを見つけることができます 再描画および非再描画ではありません 電子メール/音声/視覚アラートを実装します 123パターン は、継続パターンまたは反転パターンとして現れます。物事を簡単にするために、このインジケーターを使用して、検索するパターンのタイプを選択できるため
This is the FXTraderariel-TakeProfit - Stop Loss Indicator . It provides you 3 potential Take Profits and 1 Stop Loss. These potential targets are computed based on several methods . The indicator can be used on every time frame, but we advise to use it on H1, H4 and D1. Especially if you are a novice trader. Pro Traders can also you use it for scalping in smaller time frames (M1, M5 and M15). This indicator is not a complete trading system. It doesn't provide you a Signal nor can predict the m
フィボナッチリトレースと拡張ラインツール DiNapoliポイント取引方法とゴールデンセクション取引を使用するトレーダーにとって理想的なMT4プラットフォームのフィボナッチリトレースと拡張ラインツール 主な特長: あなたはフィボナッチリトレースメントの複数のセットを直接描くことができ、重要なリターンポイント間の関係は一目瞭然です。 2.フィボナッチ拡張を描画することができます。 3.フィボナッチフォールドバックとラインの延長は、簡単な観察と数値表示のために左右に動かすことができます。 4.チャートは非常に爽やかな 5.数字キーでサイクルを切り替えることができます。 ファンクションキー: 1。 [戻るを押す、要求に応じて描画する、最大8つのグループにする 2。拡張]を描くには[押す] 3。 \を押すと、現在のサイクルの下にあるすべての拡張機能と折り畳みが削除されます 4。フォールドバックを移動して削除して展開する (1)最初のフォールドバックセットのF5行をクリックします。 一度クリックすると(黄色に変わります)、キーボードのDeleteキーを押すと、フォーカ
Time Bubble ***Specialized for GBPJPY 1H time frame*** (tested for two years with success rates about 82%) Time Circle's smart algorithm detects the price circles with time . give strong signals at the right time as result of combine the price and time. our team spent months to develop this indicator specially for GBPJPY ..with high success rates about 82% win trades over two years .tested from December 2016 to November 2018. *** in last two years total signals 1012 with 829 Wins and 183 Lo
Volume Profile Indicator for MT4 Gain a trading edge with the "Volume Profile" indicator for MetaTrader 4 (MT4). This advanced technical analysis tool allows you to precisely identify key support and resistance levels based on transaction volume. Easily visualize market areas of high interest, where trading volumes are highest, and use this information to make more informed trading decisions. Key Features: Clear and detailed visualization : The indicator displays volume histograms directly on th
A tall upper shadow occurs when the price moves during the period, but goes back down, which is a bearish signal. A tall lower shadow forms when bears push the price down, but bulls pull it back up, which leaves a long line or shadow. This is considered a bullish signal. Some technical analysts believe a tall or long shadow means the stock will turn or reverse. Some believe a short or lower shadow means a price rise is coming. In other words, a tall upper shadow means a downturn is coming, while
The perfect tool for Scalng in the Forex markets You can trade both from signal to signal and using take profit  The algorithm does not use Zigzag!  No redrawing!  This is a channel instrument that uses a moving average as a filter. Moving Average  There are 2 parameters for the settings Ma Period = 5 period Moving Average  Channel 1.0 distance of channel lines from the chart Price Signal Filter - calculation of signal opening and filter There is a complete set of Alert There is a multi-timefram
Strong Retracement Points Pro demo edition! SRP (Strong Retracement/Reversal Points) is a powerful and unique support and resistance indicator. It displays the closest important levels which we expect the price retracement/reversal! If all level are broken from one side, it recalculates and draws new support and resistance levels, so the levels might be valid for several days depending on the market! If you are still hesitating to start using this wonderful tool, you can check this link to see h
How to use Pair Trading Station Pair Trading Station is recommended for H1 time frame and you can use it for any currency pairs. To generate buy and sell signal, follow few steps below to apply Pair Trading Station to your MetaTrader terminal. When you load Pair Trading Station on your chart, Pair Trading station will assess available historical data in your MetaTrader platforms for each currency pair. On your chart, the amount of historical data available will be displayed for each currency pai
このプロダクトを購入した人は以下も購入しています
Gann Made Easy は、ミスター・ギャンの理論を使用した取引の最良の原則に基づいた、プロフェッショナルで使いやすい外国為替取引システムです。 W・D・ガン。このインジケーターは、ストップロスとテイクプロフィットレベルを含む正確な買いと売りのシグナルを提供します。 PUSH通知を利用して外出先でも取引可能です。 購入後はご連絡ください!私の取引のヒントと素晴らしいボーナスインジケーターを無料で共有します! おそらく、ギャンの取引手法についてはすでに何度も聞いたことがあるでしょう。通常、ギャンの理論は初心者のトレーダーだけでなく、すでにある程度の取引経験がある人にとっても非常に複雑なものです。なぜなら、ギャンの取引手法は理論的にはそれほど簡単に適用できるものではないからです。私はその知識を磨き、最良の原則を私の外国為替インジケーターに組み込むために数年を費やしました。 このインジケーターは非常に簡単に適用できます。必要なのは、それをチャートに添付し、簡単な取引推奨事項に従うだけです。このインジケーターは常に市場分析の仕事を行い、取引の機会を探します。適切なエントリーポイントを検出
現在20%OFF! 初心者やエキスパートトレーダーのためのベストソリューション! このダッシュボードソフトウェアは、28の通貨ペアで動作しています。それは私達の主要な指標(高度な通貨の強さ28と高度な通貨インパルス)の2に基づいています。それは全体の外国為替市場の大きい概観を与えます。それは、すべての(9)時間枠で28の外国為替ペアのための高度な通貨の強さの値、通貨の動きの速度と信号を示しています。チャート上で1つのインディケータを使用して市場全体を観察し、トレンドやスキャルピングの機会をピンポイントで見つけることができたら、あなたのトレードがどのように改善されるか想像してみてください。 このインディケータには、強い通貨と弱い通貨の識別、潜在的な取引の識別と確認がより簡単になるような機能が搭載されています。このインディケータは、通貨の強さや弱さが増加しているか減少しているか、また、すべての時間枠でどのように機能しているかをグラフィカルに表示します。 新機能として、現在の市場環境の変化に適応するダイナミックなマーケットフィボナッチレベルが追加され、すでに当社のAdvanced
!SPECIAL SALE! An exclusive indicator that utilizes an innovative algorithm to swiftly and accurately determine the market trend. The indicator automatically calculates opening, closing, and profit levels, providing detailed trading statistics. With these features, you can choose the most appropriate trading instrument for the current market conditions. Additionally, you can easily integrate your own arrow indicators into Scalper Inside Pro to quickly evaluate their statistics and profitability
Golden Trend Indicator
Noha Mohamed Fathy Younes Badr
4.9 (10)
Golden Trend indicator  is The best indicator for predicting trend movement this indicator never lags and never repaints and never back paints    and give  arrow buy and sell    before the candle appear  and it will help you and  will make your trading decisions clearer its work on all currencies and  gold and crypto and all time frame This unique  indicator uses very secret algorithms to catch the  trends, so you can trade using this indicator and see the trend clear on charts  manual guide and
Dynamic Forex28 Navigator - 次世代の Forex 取引ツール。 現在 49% オフ。 Dynamic Forex28 Navigator は、長年人気のインジケーターを進化させたもので、3 つの機能を 1 つにまとめています。 Advanced Currency Strength28 インジケーター (レビュー 695 件)  + Advanced Currency IMPULSE with ALERT (レビュー 520 件) + CS28 コンボ シグナル (ボーナス)。 インジケーターの詳細 https://www.mql5.com/en/blogs/post/758844 次世代の Strength インジケーターが提供するもの  オリジナルで気に入っていたすべての機能が、新機能と精度の向上によって強化されました。 主な機能: 独自の通貨強度計算式。 すべての時間枠でスムーズかつ正確な強度ライン。 トレンドの特定と正確なエントリーに最適です。 ダイナミックマーケットフィボナッチレベル (マーケットフィボナッチ)。 このインジケーターに固有
Scalper Vault は、スキャルピングを成功させるために必要なすべてを提供するプロフェッショナルなスキャルピング システムです。このインジケーターは、外国為替およびバイナリー オプションのトレーダーが使用できる完全な取引システムです。推奨される時間枠は M5 です。 システムは、トレンドの方向に正確な矢印シグナルを提供します。また、トップとボトムのシグナルとギャン マーケット レベルも提供します。 インジケーターは、プッシュ通知を含むすべてのタイプのアラートを提供します。 インジケータの購入後にご連絡ください。私の個人的な取引の推奨事項と素晴らしいボーナス指標を無料で共有します! 幸せで有益な取引をお祈りします!
After your purchase, feel free to contact me for more details on how to receive a bonus indicator called VFI, which pairs perfectly with Easy Breakout for enhanced confluence!   Easy Breakout is a powerful price action trading system built on one of the most popular and widely trusted strategies among traders: the Breakout strategy ! This indicator delivers crystal-clear Buy and Sell signals based on breakouts from key support and resistance zones. Unlike typical breakout indicators, it levera
Enigmera
Ivan Stefanov
5 (7)
ENIGMERA: 市場の中心 重要:MQL5.comのデモはStrategy Testerで実行されており、Enigmeraの機能を完全には反映していない場合があります。詳細については、説明、スクリーンショット、ビデオをご確認ください。質問があれば、遠慮なくメッセージを送ってください! インジケーターのコードは完全に書き直されました。バージョン3.0は新機能を追加し、インジケーターの開始以来蓄積されたバグを修正しました。 紹介 このインジケーターとトレーディングシステムは、金融市場への注目すべきアプローチです。ENIGMERAはフラクタルサイクルを使用して、サポートとレジスタンスのレベルを正確に計算します。真の蓄積フェーズを示し、方向と目標を提供します。トレンドでも修正でも機能するシステムです。 動作方法 インジケーターのほとんどの機能は、チャートの左側にあるボタンで制御され、市場の状況に迅速に対応できるようになっています。 ボタン ON/OFF – インジケーター全体を表示または非表示にします。 Channel – サポートチャネルを有効にし、許容範囲の偏差を示します。 Dev
Linear Trend Predictor ー - エントリ ポイントと方向サポート ラインを組み合わせたトレンド インジケーター。高値/安値チャネルを突破するという原理に基づいて機能します。 インジケーターのアルゴリズムは市場のノイズをフィルタリングし、ボラティリティと市場の動向を考慮します。 インジケーターの機能  平滑化手法を使用して、市場のトレンドと、買い注文または売り注文を開くためのエントリー ポイントを表示します。  任意の時間枠のチャートを分析して、短期および長期の市場の動きを判断するのに適しています。  あらゆる市場や時間枠に適応可能な入力パラメータにより、トレーダーはインジケーターを独自にカスタマイズできます。  設定されたインジケーター信号は消えず、再描画もされません。ローソク足の終値で決定されます。  いくつかの種類の通知が矢印と組み合わされています。  このインジケーターは、独立した取引システムとして使用することも、他の取引システムへの追加として使用することもできます。  あらゆるレベルの経験を持つトレーダーが使用できます。 主なパラメータ Vol
このインディケータは、当社の2つの製品 Advanced Currency IMPULSE with ALERT  +   Currency Strength Exotics . のスーパーコンビネーションです。 このインジケーターは全ての時間枠で作動し、8つの主要通貨と1つのシンボルの強弱のインパルスをグラフで表示します。 このインジケータは、金、エキゾチックペア、商品、インデックス、先物など、あらゆるシンボルの通貨強度の加速度を表示することに特化されています。金、銀、原油、DAX、US30、MXN、TRY、CNHなどの通貨強度の加速度(インパルスまたは速度)を表示するために、任意のシンボルを9行目に追加できる、この種の最初のものです。 新しいアルゴリズムに基づいて構築され、潜在的な取引の特定と確認がさらに容易になりました。これは、通貨の強さや弱さが加速しているかどうかをグラフィカルに表示し、その加速の速度を測定するためです。加速すると物事は明らかに速く進みますが、これはFX市場でも同じです。つまり、反対方向に加速している通貨をペアリングすれば、潜在的に利益を生む取引を特定
PUMPING STATION – あなた専用の「オールインワン」戦略 PUMPING STATIONは、あなたのトレードをより楽しく、そして効果的に変えてくれる革新的なFXインジケーターです。ただの補助ツールではなく、強力なアルゴリズムを備えた本格的なトレーディングシステムで、より安定したトレードのスタートをサポートします。 この商品をご購入いただくと、以下の特典を無料でお付けします: 専用セットファイル:自動設定による最大パフォーマンスを実現。 ステップバイステップのビデオマニュアル:PUMPING STATION戦略の使い方を学べます。 Pumping Utility:PUMPING STATION専用の半自動トレードボットで、より快適かつシンプルな運用を可能にします。 ※ご購入後すぐにご連絡ください。追加リソースへのアクセスを提供いたします。 PUMPING STATIONの仕組み: トレンド管理:市場のトレンド方向を即座に判断。トレンドはあなたの最高の味方です。 エントリーサイン:チャート上の矢印で、取引のタイミングと方向を明確に示します。 明確な目標設定:インジケーターが自
FX Volume
Daniel Stein
4.6 (35)
FX Volume:ブローカー視点で捉える本物の市場センチメント クイック概要 トレード手法をさらに高めたいとお考えですか? FX Volume は、リテールトレーダーやブローカーのポジション状況をリアルタイムで提供します。これは、COTのような遅延レポートよりもはるかに早く知ることができます。安定した利益を目指す方も、さらなる優位性を求める方も、 FX Volume は大きな不均衡を見極め、ブレイクアウトを確認し、リスク管理を洗練させるのに役立ちます。今すぐ始めて、実際の出来高データがどのように意思決定を変革するかを体感してください! 1. FX Volume がトレーダーにとって非常に有益な理由 高精度の早期警戒シグナル • 各通貨ペアを売買しているトレーダー数を、他者よりも早く、ほぼリアルタイムで把握できます。 • FX Volume は、複数のリテールブローカーから得られる本物の出来高データを収集し、分かりやすい形式で提供する 唯一 のツールです。 強力なリスク管理 • ロングやショートの大きな偏り(インバランス)を特定し、潜在的なトレンド転換を見逃しません。ストップ
Volatility Trend System - a trading system that gives signals for entries. The volatility system gives linear and point signals in the direction of the trend, as well as signals to exit it, without redrawing and delays. The trend indicator monitors the direction of the medium-term trend, shows the direction and its change. The signal indicator is based on changes in volatility and shows market entries. The indicator is equipped with several types of alerts. Can be applied to various trading ins
Chart Patterns All in One」をデモモードでお試しいただき、ボーナスを獲得してください。デモモードで試した後、メッセージを送っていただければボーナスをお渡しします。 購入後にコメントを残すと、高品質なインジケーター8つをボーナスとして受け取れます。 Chart Patterns All-in-One インジケーターは、トレーダーがテクニカル分析で一般的に使用されるさまざまなチャートパターンを視覚化するのに役立ちます。このインジケーターは市場の潜在的な動きを特定するのに役立ちますが、収益性を保証するものではありません。購入前にデモモードでテストすることをお勧めします。 現在のオファー : 「Chart Patterns All in One」インジケーターが50%割引。 含まれるパターン : 1-2-3 パターン : 3つの主要なポイント(高値または安値)を使用して市場の反転を検出します。 買い : 2つの連続する安値の後に、前の高値よりも低い高値が出現。 売り : 2つの連続する高値の後に、前の安値よりも高い安値が出現。 可視化 : 特定されたポイントを線と矢印
Cyclical indicator for trading and predicting the direction of the market. Shows the cyclical behavior of the price in the form of an oscillator. Gives signals for opening deals when rebounding from the upper and lower boundaries of the oscillator. In the form of a histogram, it shows the smoothed strength of the trend. Will complement any trading strategy, from scalping to intraday. The indicator does not redraw. Suitable for use on all symbols/instruments. Suitable time frames for short-term t
Advanced Supply Demand
Bernhard Schweigert
4.91 (294)
現在33%オフ 初心者にもエキスパートトレーダーにも最適なソリューション このインジケーターは独自の機能と新しい公式を多数内蔵しており、ユニークで高品質かつ手頃な取引ツールです。このアップデートでは、2つの時間枠ゾーンを表示できるようになります。より長いTFだけでなく、チャートTFとより長いTF(ネストゾーンを表示)の両方を表示できます。すべてのSupply Demandトレーダーの皆さんのお気に召すはずです。:) 重要情報の公開 Advanced Supply Demandの可能性を最大化するには、 https://www.mql5.com/ja/blogs/post/720245 にアクセスしてください。   エントリーまたはターゲットの正確なトリガーポイントを正確に特定できれば取引がどのように改善されるか想像してみてください。新しい基盤となるアルゴリズムに基づいて構築されているため、買い手と売り手の間の潜在的な不均衡をさらに簡単に特定できます。これは、最も強い需要と供給のゾーンと、過去のパフォーマンス(古いゾーンを表示)がグラフィカルに表現されるためです。これらの機能は、最適な
現在26%オフ 初心者やエキスパートトレーダーに最適なソリューション! このインジケーターは、独自の機能と新しい計算式を取り入れた、ユニークで高品質、かつ手頃な価格のトレーディングツールです。たった1枚のチャートで28の為替ペアの通貨強度を読み取ることができます。新しいトレンドやスキャルピングチャンスの引き金となるポイントを正確に特定することができるので、あなたのトレードがどのように改善されるか想像してみてください。 ユーザーマニュアルはこちら  https://www.mql5.com/en/blogs/post/697384 これが最初の1本、オリジナルだ! 価値のないクローンを買わないでください。 特別な サブウィンドウの矢印で強い通貨の勢いを表示 GAPがあなたのトレードを導く! 基準通貨や気配値が売られすぎ・買われすぎのゾーン(外相フィボナッチレベル)にあるとき、個別チャートのメインウィンドウに警告表示。 通貨がレンジの外側から反落した場合、プルバック/リバーサルのアラート。 クロスパターンの特別なアラート 複数の時間枠を選択可能で、トレンドを素早く確認できます
購入後に包括的なユーザーガイドを入手するには、お問い合わせください。  MQL5のシルバー賞を受賞した開発者が精密に設計したHydra Trend Riderインジケーターで、あなたのトレーディング体験を向上させましょう。比類なき市場の洞察を提供し、意思決定プロセスを強化するこの高度なツールは、トレーダーがトレーディング戦略において精度と効率を追求するための完璧な選択肢です。 MQL5チャンネル に参加する 当社の製品をご購入いただくと、 PDF形式の包括的なユーザーガイドをお送りします。ご購入後にお問い合わせいただければ、 迅速にユーザーガイドをお送りします。 インジケーターの特徴: マルチタイムフレームダッシュボード:  当社の洗練されたダッシュボードで、異なるタイムフレームにわたる市場の全体像を把握しましょう。短期的な変動や長期的なトレンドを分析する際にも、Hydraインジケーターは一瞬も見逃さないようにします。 強力なトレンドシグナル:  強力なトレンドシグナル機能で市場に先んじましょう。このツールは市場のトレンドを特定し、それを活用するのに役立ち、タイムリーで情報に基づい
ボリューム ブレイク オシレーターは、オシレーターの形で価格変動とボリューム トレンドを一致させるインジケーターです。 私はボリューム分析を戦略に統合したいと思っていましたが、OBV、マネー フロー インデックス、A/D、ボリューム加重 Macd など、ほとんどのボリューム インジケーターにいつもがっかりしていました。 そのため、このインジケーターを自分で作成し、その有用性に満足したので、市場に公開することにしました。 主な機能: ボリュームの増加 (ブレイク) によってサポートされる方向に価格が動くフェーズを強調します。 ボリュームの増加が止まり、市場が縮小するフェーズを強調します。 特に時間枠 (<=15 分) のデイトレードでは、価格もボリュームも動かないため、市場が将来の動きに備えられるフェーズを強調します。 ボリュームの増加によってサポートされていない場合、他のエキスパート アドバイザーからの誤ったシグナルをフィルターします。 トレンドとレンジ フェーズを非常に簡単に視覚化できます 入力パラメーター: 計算設定: 計算タイプ: FAST、NORMAL、SLOW。同じ
Wave Synchronizer は、波動分析の視覚的なインジケーターです。ローソク足の動きのシーケンスを組み合わせて方向性のある波を構築し、市場と同期した動きを生み出します。 各波の始まりはシグナル矢印で始まり、アラートもあります。 インジケーターは、以前の履歴の矢印を再描画したり移動したりすることはありません。 シグナル矢印は、ローソク足の終値に表示されます。 あらゆる取引商品や時間枠で動作するように適応します。 使いやすく設定も簡単で、入力パラメーターは 2 つだけです。選択したパラメーターで使用する時間枠の選択と、MA ラインの計算方法です。 推奨パラメーターは 1 ~ 2 期間シフトできます。 取引資産を購入する場合は矢印の方向が赤になります。 取引資産を売却する場合は矢印の方向が青になります。
IQ Gold Gann Levels a non-repainting, precision tool designed exclusively for XAUUSD/Gold intraday trading. It uses W.D. Gann’s square root method to plot real-time support and resistance levels, helping traders spot high-probability entries with confidence and clarity. William Delbert Gann (W.D. Gann) was an exceptional market analyst, whose trading technique was based on a complex blend of mathematics, geometry, astrology, and ancient mathematics which proved to be extremely accurate. Download
Legacy of Gann
Pavel Zamoshnikov
4.83 (12)
The indicator very accurately determines the levels of the possible end of the trend and profit fixing. The method of determining levels is based on the ideas of W.D.Gann, using an algorithm developed by his follower Kirill Borovsky. Extremely high reliability of reaching levels (according to K. Borovsky  - 80-90%) Indispensable for any trading strategy – every trader needs to determine the exit point from the market! Precisely determines targets on any timeframes and any instruments (forex, met
Gold Venamax   - これは最高の株式テクニカル指標です。 指標アルゴリズムは資産の価格変動を分析し、ボラティリティと潜在的なエントリーゾーンを反映します。 インジケーターの機能: これは、快適で収益性の高い取引のためのマジックとトレンド矢印の 2 つのブロックを備えたスーパー インジケーターです。 チャート上にブロックを切り替えるための赤いボタンが表示されます。 マジックはインジケーター設定で設定されているため、異なるブロックを表示する 2 つのチャートにインジケーターをインストールできます。 Gold Venamax は、異なる矢印バッファー (GV と SD) を備えた 2 つのチャートに配置できます。 これを行うには、設定で異なる Magic を選択する必要があります。たとえば、あるマジック = 999、別のマジック = 666 を選択します。次に、チャート上の赤いボタンで矢印バッファを選択できます。 インジケーター設定の各矢印バッファー (GV および SD) には、快適で収益性の高い取引のための個別の矢印フィルターがあります (UseFiltrGV = tru
IQ FX Gann Levels a precision trading indicator based on W.D. Gann’s square root methods. It plots real-time, non-repainting support and resistance levels to help traders confidently spot intraday and scalping opportunities with high accuracy. William Delbert Gann (W.D. Gann) was an exceptional market analyst, whose trading technique was based on a complex blend of mathematics, geometry, astrology, and ancient mathematics which proved to be extremely accurate. Download the Metatrader 5 Version M
Volume Profile, Footprint and Market Profile TPO (Time Price Opportunity). Volume and TPO histogram bar and line charts. Volume Footprint charts. TPO letter and block marker collapsed and split structure charts. Static, dynamic and flexible range segmentation and compositing methods with relative and absolute visualizations. Session hours filtering and segment concatenation with Market Watch and custom user specifications. Graphical layering, positioning and styling options to suit the user's a
優れたテクニカルインジケーター「Grabber」をご紹介します。これは、すぐに使える「オールインワン」トレーディング戦略として機能します。 ひとつのコードに、市場のテクニカル分析ツール、取引シグナル(矢印)、アラート機能、プッシュ通知が強力に統合されています。 このインジケーターを購入された方には、以下の特典を無料で提供します: Grabberユーティリティ:オープンポジションを自動で管理するツール ステップバイステップのビデオマニュアル:インジケーターのインストール、設定、取引方法を解説 カスタムセットファイル:インジケーターをすばやく自動設定し、最大限の成果を出すための設定ファイル 他の戦略はもう忘れてください!Grabberだけが、あなたを新たなトレードの高みへと導いてくれるのです。 Grabber戦略の主な特徴: 推奨タイムフレーム:M5〜H4 対応通貨ペア・資産:どれでも使用可能ですが、私が実際に検証した以下を推奨します(GBPUSD、GBPCAD、GBPCHF、AUDCAD、AUDUSD、AUDSGD、AUDCHF、NZDUSD、NZDCAD、EURCAD、EURUSD、E
KT Asian Breakout インジケーターは、アジア市場の重要な時間帯を分析し、価格のブレイクアウト方向に基づいた双方向の売買シグナルを生成します。価格がセッション高値を超えると買いシグナルが発生し、セッション安値を下回ると売りシグナルが発生します。 注意事項 セッションボックスが縦に広すぎる場合、新たな取引は避けるべきです。すでにセッション内で価格の動きが完了している可能性が高いためです。 ブレイクアウトのローソク足が大きすぎる場合、価格は一時的に反転した後に、シグナルの方向へ進むことがよくあります。 機能 買い/売りシグナルには、ストップロスと利益目標が含まれています。 KT Asian Breakout インジケーターは、第一、第二、第三の利益目標を成功基準として継続的にパフォーマンスをチェックします。 勝敗シグナル数、成功率、1シグナルあたりの平均ピップスなど、3つの主要なパフォーマンス指標を表示します。 ブレイクアウトのローソク足が大きすぎる場合、チャート上に警告メッセージを表示します。 推奨設定 時間足: 15分。 通貨ペア: すべての JPY ペア。 入力
The AT Forex Indicator MT4 is a sophisticated trading tool designed to provide traders with a comprehensive analysis of multiple currency pairs. This   powerful indicator   simplifies the complex nature of the forex market, making it accessible for both novice and experienced traders. AT Forex Indicator uses   advanced algorithms   to detect trends, patterns and is an essential tool for traders aiming to enhance their forex trading performance. With its robust features, ease of use, and reliabl
Smart Set up leve l is a very powerful indicator based on the concept of order blocks and set up entries with proper fvg and breakouts to make a very nice level to enter like a pro trader. Very easy to use interface and friendly to enter on buy and sell signals. Works Best on M15 Time frame on Gold, Bitcoin and Fx pairs. Daily 4-5 trades on each pair  Works great on gold like a pro on M15 It is non repainting nor lagging It is very powerful indicator giving precise entries and prop acts can be c
NAM Order Blocks
NAM TECH GROUP, CORP.
3 (2)
MT4マルチタイムフレームオーダーブロック検出インジケーター。 特徴 -チャートコントロールパネルで完全にカスタマイズ可能で、完全な相互作用を提供します。 -必要な場所でコントロールパネルを表示および非表示にします。 -複数の時間枠でOBを検出します。 -表示するOBの数量を選択します。 -さまざまなOBユーザーインターフェイス。 -OBのさまざまなフィルター。 -OB近接アラート。 -ADRの高線と低線。 -通知サービス(画面アラート|プッシュ通知)。 概要 注文ブロックは、金融機関や銀行からの注文収集を示す市場行動です。著名な金融機関と中央銀行が外国為替市場を牽引しています。したがって、トレーダーは市場で何をしているのかを知る必要があります。市場が注文ブロックを構築するとき、それは投資決定のほとんどが行われる範囲のように動きます。 注文の構築が完了すると、市場は上向きと下向きの両方に向かって急激に動きます。注文ブロック取引戦略の重要な用語は、機関投資家が行っていることを含むことです。それらは主要な価格ドライバーであるため、機関投資家の取引を含むあらゆる戦
作者のその他のプロダクト
Harmonic Trading is now much easy than ever before with Harmonic Master Scanner Pro you can now scan time frames from 5m to 1w for 17 harmonic patterns on all bares at the same time. Harmonic Master Scanner Pro works based on original MetaTrader4 Zigzag indicator and the standard harmonic patterns elements. This software send alert and email to you when a harmonic pattern is detected on any charts. If you want the scanner to draw the pattern just switch the time frame to the alert time frame. Th
フィルタ:
レビューなし
レビューに返信