Divergence Scanner Macd Rsi 30 Pairs 8 Tf FREE
- インディケータ
- FXsolutions
- バージョン: 1.2
- アップデート済み: 24 5月 2018
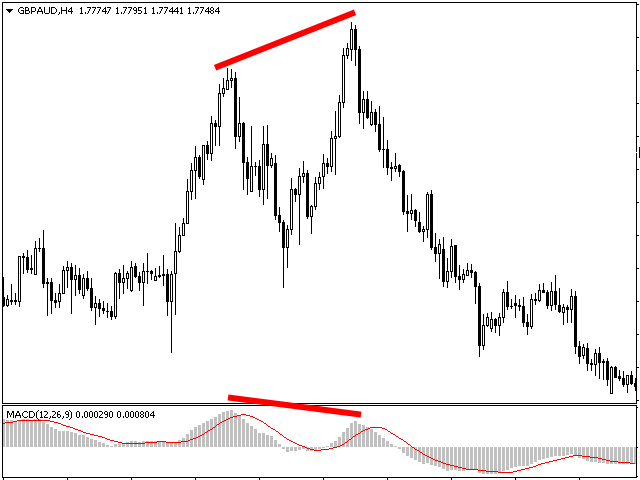
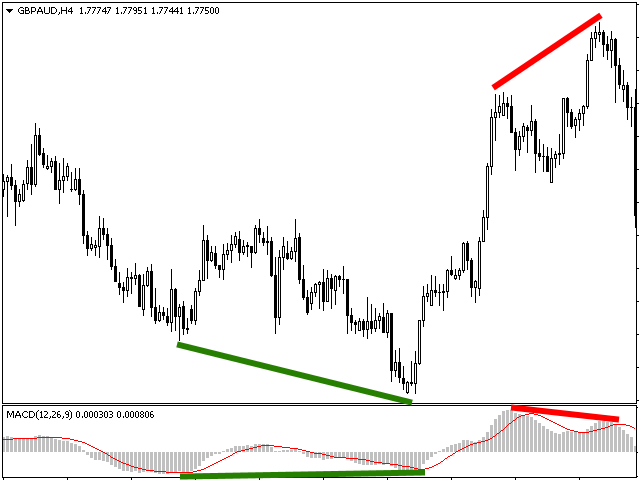
This indicator is designed to detect the best divergences between price/MACD and price/RSI. MACD and RSI produce by far the best divergence signals therefore this indicator focus on those two divergences.
This is the FREE version of the indicator: https://www.mql5.com/en/market/product/28375
Important Information
How you can maximize the potential of the scanner, please read here: www.mql5.com/en/blogs/post/718074
The free version works only on EURUSD and GBPUSD!
This indicator scans for you up to 2 instruments and up to 8 timeframes for bullish and bearish divergences.
You need to add the indicator only to one single chart! The indicator will then automatically scan all configured instruments and timeframes.
The indicator checks both divergences at the same time (MACD / RSI) unless you deactivate one of the divergence checks.
Parameters
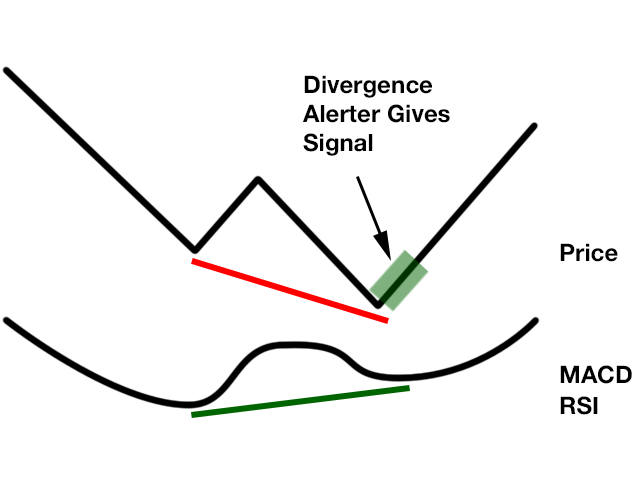
- alertsLong: True = Yes, False = No - if true, then the indicator alerts occurrences of "Bullish Divergence" signals for long entries
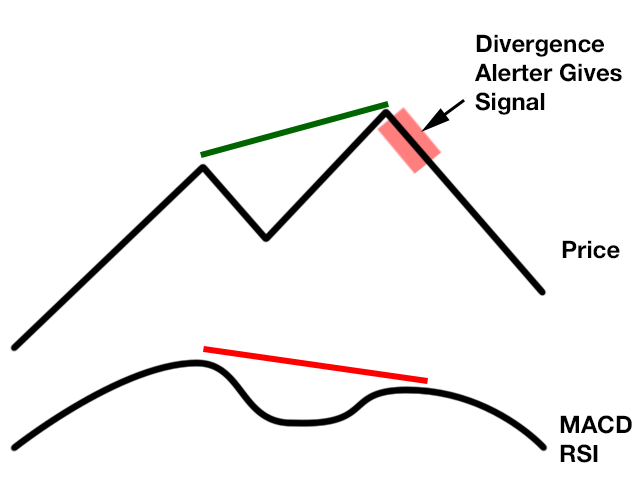
- alertsShort: True = Yes, False = No - if true, then the indicator alerts occurrences of "Bearish Divergence" signals for short entries
- alertsViaMT4: True = Yes, False = No - if true, then the indicator gives alerts via MetaTrader 4 popup
- alertsViaEmail: True = Yes, False = No - if true, then the indicator gives alerts via email
- alertsViaPush: True = Yes, False = No - if true, then the indicator gives alerts direct to your mobile phone
- alertsM1: True = Yes, False = No - if true, then the indicator searches for "Divergence" signals on M1
- alertsM5: True = Yes, False = No - if true, then the indicator searches for "Divergence" signals on M5
- alertsM15: True = Yes, False = No - if true, then the indicator searches for "Divergence" signals on M15
- alertsM30: True = Yes, False = No - if true, then the indicator searches for "Divergence" signals on M30
- alertsH1: True = Yes, False = No - if true, then the indicator searches for "Divergence" signals on H1
- alertsH4: True = Yes, False = No - if true, then the indicator searches for "Divergence" signals on H4
- alertsD1: True = Yes, False = No - if true, then the indicator searches for "Divergence" signals on D1
- alertsW1: True = Yes, False = No - if true, then the indicator searches for "Divergence" signals on W1
- alertMACD: True = Yes, False = No - if true, then the indicator searches for "Divergence" between price an the MACD indicator
- alertRSI: True = Yes, False = No - if true, then the indicator searches for "Divergence" between price an the RSI indicator
- macd_fastEMA: the period setting of the fast EMA for the MACD
- macd_slowEMA: the period setting of the slow EMA for the MACD
- macd_signalSMA: the period setting of the signal SMA for the MACD
- period: the period setting of the RSI
- templateName: - if you press a button on the chart (which contains the name of an instrument), then the appropriate chart will open and a template with the specified name will be attached
- checkEveryXSeconds - every X seconds, the indicator checks the next instrument/timeframe for the occurrence of a "Divergence" signal
- i1-i2 - define up to 2 instruments (EURUSD / GBPUSD), which will be monitored/checked for the occurrence of a "Divergence" signal


Good tool