• 概要
  • レビュー (4)
  • コメント (18)
  • 最新情報

TraderHelp

5

The main goal of the indicator is to determine the most optimal points of entry and exit from a trade. The indicator consists of three parts.

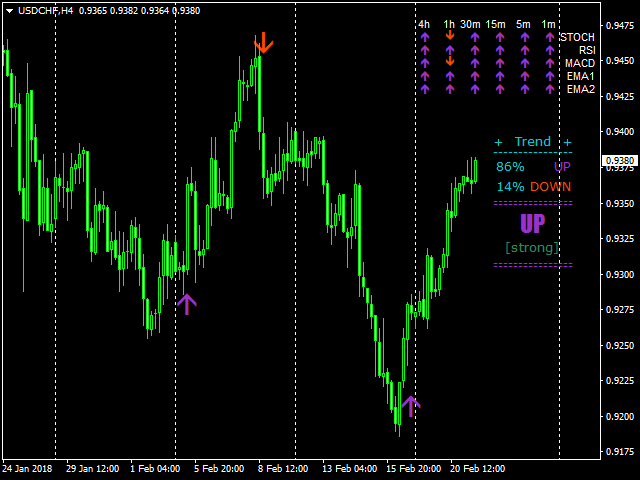
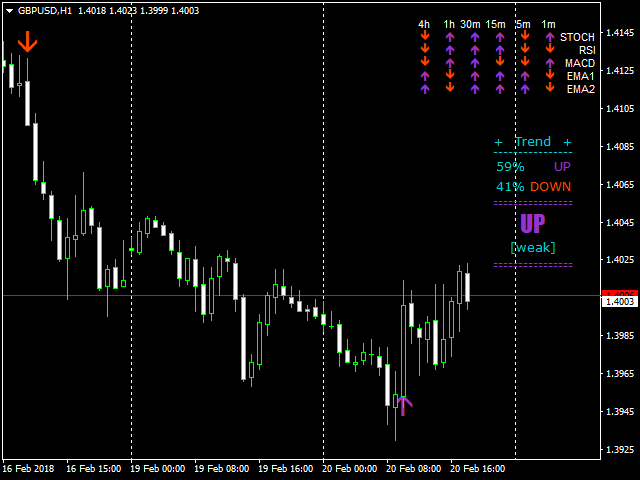
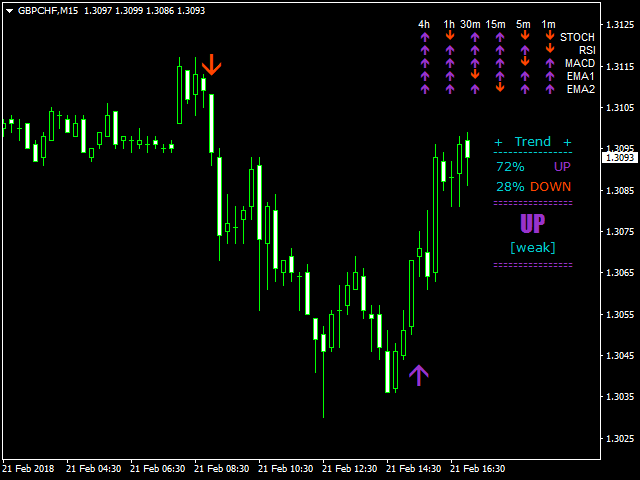
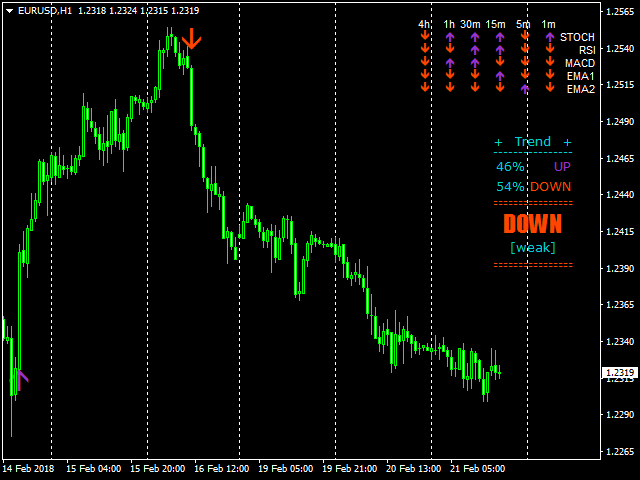
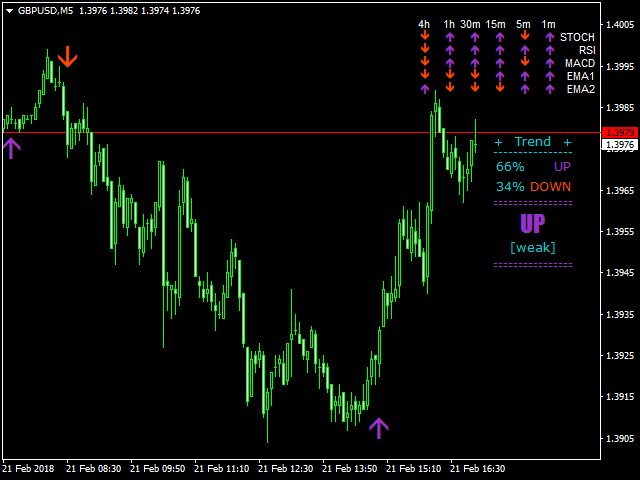
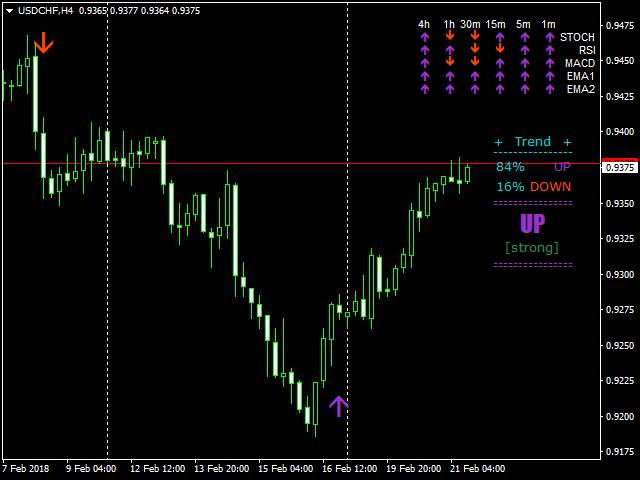
The first one is arrows displaying the most efficient market entry/exit points. The up arrow is a buy signal, the down arrow is a sell one. The indicator contains an analytical analysis algorithm that includes a set of standard indicator readings, as well as a custom algorithm.

The second part is data in the upper right corner (works on М1-D1 timeframes) on multiple indicators (Stohastic, RSI, MACD, MA) on six periods (M1, M5, M15, M30, H1, H4) of the currency pair. This block provides information about the currency pair on all timeframes based on the values of several indicators.

The third part shows the current arrow direction and a trend power.

The indicator does not redraw its values.


Program Parameters

  • Power - indicator period
  • Alerts - audio alert when a signal appears
  • Show_info - show/hide data
  • EmailAlerts - send notifications by email when a signal emerges
  • MobileAlerts - send notifications to a mobile terminal when a signal emerges
レビュー 4
Farooq Majoka
1817
Farooq Majoka 2019.04.06 10:39 
 

Thanx for the support Pavel and for a good indicator. Cheers!

Jonathan Vodini
583
Jonathan Vodini 2019.04.02 17:09 
 

great and very accurate signals, i don't get how this dude has so few reviews on his products... 5 stars!

iamgold
1996
iamgold 2018.03.17 15:26 
 

This is a great indikator, make good profit to me, because it is good to make entry, and it Works for all pair, thanks to the creator, 5 star from me

おすすめのプロダクト
Owl smart levels
Sergey Ermolov
4.58 (55)
MT5版  |   FAQ Owl Smart Levels Indicator   は、 Bill Williams   の高度なフラクタル、市場の正しい波構造を構築する Valable ZigZag、エントリの正確なレベルをマークする Fibonacci レベルなどの一般的な市場分析ツールを含む 1 つのインジケーター内の完全な取引システムです。 利益を得るために市場と場所に。 戦略の詳細な説明 インジケータを操作するための指示 顧問-取引助手 プライベートユーザーチャット ->購入後に私に書いて、私はプライベートチャットにあなたを追加し、あなたはそこにすべてのボーナスをダウンロードすることができます 力はシンプルさにあります! Owl Smart Levels   取引システムは非常に使いやすいので、専門家にも、市場を勉強し始めて自分で取引戦略を選択し始めたばかりの人にも適しています。 戦略と指標に秘密の数式や計算方法が隠されているわけではなく、すべての戦略指標は公開されています。 Owl Smart Levels を使用すると、取引を開始するためのシグナルをすばやく確認し、
VR Cub
Vladimir Pastushak
VR Cub は、質の高いエントリーポイントを獲得するためのインジケーターです。このインジケーターは、数学的計算を容易にし、ポジションへのエントリーポイントの検索を簡素化するために開発されました。このインジケーターが作成されたトレーディング戦略は、長年にわたってその有効性が証明されてきました。取引戦略のシンプルさはその大きな利点であり、初心者のトレーダーでもうまく取引することができます。 VR Cub はポジション開始ポイントとテイクプロフィットとストップロスのターゲットレベルを計算し、効率と使いやすさを大幅に向上させます。取引の簡単なルールを理解するには、以下の戦略を使用した取引のスクリーンショットを見てください。 設定、設定ファイル、デモ版、説明書、問題解決方法は、以下から入手できます。 [ブログ] レビューを読んだり書いたりすることができます。 [リンク] のバージョン [MetaTrader 5] エントリーポイントの計算ルール ポジションをオープンする エントリーポイントを計算するには、VR Cub ツールを最後の高値から最後の安値までストレッチする必要があります。
"The trend is your friend" is one of the best known sayings in investing, because capturing large trendy price movements can be extremely profitable. However, trading with the trend is often easier said than done, because many indicators are based on price reversals not trends. These aren't very effective at identifying trendy periods, or predicting whether trends will continue. We developed the Trendiness Index to help address this problem by indicating the strength and direction of price trend
MT4 用 Forex インジケーター「RSI と 2 つの移動平均」 このインジケーターは、モメンタム トレーディング システムに最適です。 「RSI と 2 つの MA」インジケーターを使用すると、RSI 自体の高速移動平均と低速移動平均を確認できます インジケーターを使用すると、トレンドの変化を非常に早く確認できます 「RSI と 2 つの MA」を使用すると、トレンドの方向への勢いを捉えることができます このインジケーターは、パラメーターを使用して簡単に設定できます (画像を参照) インジケーターは、任意の時間枠で使用できます // より優れたエキスパート アドバイザーとインジケーターは、 https://www.mql5.com/en/users/def1380/seller で入手できます これは、この MQL5 Web サイトでのみ提供されるオリジナル製品です。
The indicator displays the data of the Stochastic oscillator from a higher timeframe on the chart. The main and signal lines are displayed in a separate window. The stepped response is not smoothed. The indicator is useful for practicing "manual" forex trading strategies, which use the data from several screens with different timeframes of a single symbol. The indicator uses the settings that are identical to the standard ones, and a drop-down list for selecting the timeframe. Indicator Parame
The trend is your friend! This is what this indicator is all about. Follow this famous saying and be safe. Characteristics: Buy/Sell signals fixed on the close of a bar. Works on all symbols and all timeframes. Clear visual market trend laser line, Buy/Sell signal arrows, market strength meter, TP1 & TP2 boxes. Visual signals when to enter, when to exit the market. No repainting. Compatible with Flexible EA for trading automation. (Ask for a free set file optimized to perform 2010-2018) Para
This    Nice Trade Point     indicator is designed for signal trading. This indicator generates trend signals. It uses many algorithms and indicators to generate this signal. It tries to generate a signal from the points with the highest trend potential. This indicator is a complete trading product. This indicator does not need any additional indicators. The indicator certainly does not repaint. The point at which the signal is given does not change.     Features and Suggestions Time
Wave WOLD MT4外国為替インジケータは、Wolf waveを検索し、取引端末の現在のウィンドウに表示するように設計されています。 取引でオオカミの波を使用するトレーダーのための優れた指標。 取引戦略への適用は、効率と収益性を大幅に向上させます。 指標に関する情報 他のWolf wave指標とは異なり、Wave WOLD MT4外国為替指標は、その有効性を大幅に高める多くの機能を備えています: 最初のものは開いているWindows5Pointパラメータ(真の値)情報サポートを提供します。つまり、Wolf waveが登場したチャートのウィンドウを展開します。 たとえば、EURUSD、AUDUSD、GBPUSDチャートが開いていて、それぞれにWave WOLD MT4インジケーターがインストールされている場合、ユーロモデルが検出されると、対応するチャートが自動的に他のチャートの上に前景に表示され、多数の商品を取引するときに非常に便利になります。  2番目の機能は、ユーザーが自分で選択できるパラメータ(デフォルト設定(12,26,9))であるmacd上の組み込みの発散分析で
[ZhiBiCCI]インディケータは全てのサイクル使用に適しており、そして全ての市場品種にも適しています。 [ZhiBiCCI]緑色の実線は強気の発散の逆転です。緑色の点線は古典的な強気の発散です。 [ZhiBiCCI]赤への実線は逆弱気の発散である。赤い点線は古典的な弱気の発散です。 [ZhiBiCCI]はパラメータ(アラート、メール送信、通知送信)で設定でき、(true)に設定するとインスタント信号をアラームウィンドウに送信し、Eメール、インスタントメッセージを送信できます。 パラメータ設定の説明 [displayAlert]:これはアラームスイッチで、trueに設定され、矢印が表示されればプロンプトに自動的に警告され、falseに設定されれば警告されません。 [sendmail_NO_OFF]:これはメールを送信するためのスイッチで、trueに設定します。矢印が表示されていればMT4で設定したメールボックスにメールを送信し、falseに設定されていればメールを送信しません。 [sendnotification_NO_OFF]:これはインスタントメッセー
PipFinite Trend PRO
Karlo Wilson Vendiola
4.9 (2780)
Breakthrough Solution For Trend Trading And Filtering With All Important Features Built Inside One Tool! Trend PRO's smart algorithm detects the trend, filters out market noise and gives entry signals with exit levels. The new features with enhanced rules for statistical calculation improved the overall performance of this indicator. Important Information Revealed Maximize the potential of Trend Pro, please visit www.mql5.com/en/blogs/post/713938 The Powerful Expert Advisor Version Automa
Colored trend indicator advanced is a trend indicator that is based on Fast Moving Average and Slow Moving Average and also uses RSI and Momentum to give a trend strength in percent. It is aimed to find more healthy trends with this indicator. This indicator can be used alone as a trend indicator. Colors (Default) Green = Uptrend (Default) Red = Downtrend No color = No trend, no good trend Indicator Parameters WarnPosTrendchange: Warns you when the trend may change. FullColor: See screenshot
MT4 用 Forex インジケーター HTF 一目均衡表 一目均衡表は、最も強力なトレンド インジケーターの 1 つです。HTF は、Higher Time Frame を意味します。このインジケーターは、トレンド トレーダーや、プライス アクション エントリとの組み合わせに最適です。 HTF 一目均衡表を使用すると、Higher Time Frame の 一目均衡表を現在のチャートに添付できます。 上昇トレンド - 赤い線が青い線より上(両方の線が雲より上)/ 下降トレンド - 赤い線が青い線より下(両方の線が雲より下) 価格が一目均衡表の雲の上限を突破した場合にのみ買い注文をオープンします 価格が一目均衡表の雲の下限を突破した場合にのみ売り注文をオープンします HTF 一目均衡表インジケーターは大きなトレンドを捉える機会を提供します // より優れたエキスパートアドバイザーとインジケーターは、こちらで入手できます: https://www.mql5.com/en/users/def1380/seller これは、この MQL5 ウェブサイトでのみ提供されるオリジナル製品
PullbackMatrix provides the key information of the trading transactions when it finds the right market moment based on its built-in logic algorithm. The high accuracy signals including Trading Symbol, Entry Price, Entry Time, TakeProfit, Stoploss, and more. And that's all will be available instantly in your chart panel, drawing the position lines and also sending signal notification to email, mobile phone, and screen popup. More important is that also saves signals into a .csv file which is usef
Power Renko is an indicator which plots Renko bricks underneath the chart using a histogram. You can select the brick size and the timeframe of the Renko bricks as well as whether or not to use the close price or the high/low price of the candles. Renko bricks are based on price alone, not time, therefor the Renko bricks will not be aligned with the chart's time. They are extremely useful for trend trading and many different strategies can be formed from them. Buffers are provided allowing you t
Trade with Gann on your side!! MASTER CIRCLE 360 CIRCLE CHART, originally created by Gann admitted that this is “The Mother of all charts”. It is one of the last studies that this great trader left for us. The numeric tab le is apparently quite simple like all the tables and is based on square numbers, the SQUARE OF 12 and is by evolution, one of the most important square numbers. Here we can find CYCLE, PRICE AND TIME thanks to angles and grades, to show past and future support and resistance.
MetaTrader 4(MT4)用「Two Moving Average Crossover」インディケータは、2本の移動平均線を表示し、移動平均線が交差した際に通知するテクニカル分析ツールです。 このインディケータは、2本の移動平均を計算し、一方が速く、もう一方が遅い移動平均をプロットします。速い方の移動平均が遅い方の移動平均を上回った場合、強気シグナルと見なされ、トレンドの反転や新しい上昇トレンドの開始を示唆します。逆に、速い方の移動平均が遅い方の移動平均を下回ると、弱気 のシグナルとなり、トレンドの反転や新たな下降トレンドの開始を示唆し ます。 このインディケータは、単純移動平均(SMA)、指数移動平均(EMA)、平滑化 移動平均(SMMA)、線形加重移動平均(LWMA)など、異なるタイプの移動 平均を使用するようにカスタマイズすることが可能です。また、トレーダーの取引スタイルや好みに合わせて、各移動平均の期間を調整することができます。 移動平均のプロットだけでなく、クロスオーバーが発生した際にアラートを発 生させます。トレーダーは、クロスオーバーが発生したときに、音声または
Are you tired of the uncertainty that arises when your orders fail to stop at a specific line due to the spread? Look no further! Introducing our  indicator that plots candlesticks based on the Ask price instead of the traditional bid-based chart commonly used in MQL4. With this indicator, you can say goodbye to the frustrations caused by the bid-based chart, as it provides you with a more accurate representation of market movements. By utilizing the Ask price, which represents the price at whic
The Funicular is a functional indicator knowing all the rules of the market and performing constructions more accurate and faster than any professional analyst.  The Funicular helps you see the exact points of the "entrance", and it draws trends with great accuracy determinig their strength and fluctuation time. The main difference from the others is that it builds lines that are independent of timeframe allowing you to perceive the chart as a whole. Simply put, you need The Funicular, because i
The Stepping Trend Indicator     The Steppi ng Trend indicator uses the  average true range  (ATR indicator) in its calculation. This gives you control to set your own average true range period, I set the Default as 10.   Indicator Details. Green Arrow Up: This means you are at the starting point of a new bullish trend, it’s time to buy.   Red  Arrow  Down : This means you are at the starting point of a new  bearish  trend, it’ s time to sell .   What if you miss the Arrow Signal?   No
MT4用外国為替インジケーター「サポートレジスタンスレベル」 インジケーター「サポートレジスタンスレベル」はトレードに非常に役立つ補助インジケーターです 「サポート」と「レジスタンス」は価格によって考慮されるチャート上の重要なゾーンです サポートレベルとは、価格が定期的に下落を止めて反発するレベルです。 レジスタンスレベルとは、通常、価格の上昇が止まり、再び下落する場所です。 インジケーター「サポート抵抗レベル」は、最近のレベルを示します。 抵抗レベル - 赤い線。 サポートレベル - 青い線 計算に使用するバーの数、線の種類、色は設定で調整できます インジケーター「サポートレジスタンスレベル」は、価格アクションパターンによるテイクプロフィットターゲット、価格反転、再テストを計画するのに最適です。 // さらに優れたエキスパートアドバイザーとインジケーターはここから入手できます: https://www.mql5.com/en/users/def1380/seller 当MQL5サイトのみでご提供しているオリジナル商品です。
This is a trend indicator without redrawing Developed instead of the binary options strategy (by the color of the Martingale candlestick) Also works well in forex trading When to open trades (binary options) A signal will appear in the place with a candle signaling the current candle It is recommended to open a deal for one candle of the current timeframe M1 and M5 When a blue dot appears, open a deal up When a red dot appears, open a trade down. How to open trades on Forex. When a signal is rec
Looking for an indicator that identifies high-probability price action patterns? Love counter-trend trading? The Kangaroo Tailz indicator might be just for you. This indicator is meant to be used as a reversal detector. I personally would rather enter a position at the beginning of a trend rather than catch the last couple of moves. This indicator does a good job of alerting when price may reverse by identifying price action patterns that occur frequently in markets. Even though this indicator i
Gobbo è un indicatore professionale che evidenzia il trend del mercato con un aspetto grafico chiaro e comprensibile, è basato sulla Moving Average e può essere impostato su qualsiasi periodo di intervallo, di default impostato sul periodo 14, scegliendo un periodo più alto evidenzierà meno cambi di tendenza per un approccio sul medio o lungo periodo, con un periodo più basso più cambi di tendenza per un approccio sul breve termine L'aggiornamento e l'adattamento al time frame scelto avviene in
BreakEven Line is a very useful and easy to use indicator. In case of multiple positions opened on the same instrument, the indicator shows the breakeven point where it is possible to close the positions. Its graphic simplicity makes it an unobtrusive and customizable tool. You can enable/disable a line on a chart, so you can make the indicator invisible. Inputs Show cumulative BE (line on/off) Breakeven line color (to change the line color) Breakeven line style Breakeven line width Show short B
Trend Scanner
Vladimir Kalendzhyan
4.38 (8)
By purchasing this indicator, you have the right to receive a free copy of one of   my other indicator's or advisor’s!  (All future updates are included. No limits) . To get it , please contact me by  mql5 message ! The Trend Scanner trend line indicator displays the trend direction and its changes. The indicator works on all currency pairs and  timeframes. The indicator simultaneously displays multiple readings on the price chart: the support and resistance lines of the currency pair, the exist
The Four Moving Averages Message indicator ( please see the description and video ), a version of Four Moving Averages , concurrently displays four Moving Averages with default settings in the main chart window: Green and Red ones represent a short-term trend, Red and Blue ones - mid-term trend, while Blue and Yellow ones - long-term trend. You can change the moving average settings and colors. However, these parameters have been configured so that to allow trading on all time frames. The built-
Trend PA
Mikhail Nazarenko
5 (3)
The Trend PA indicator uses   Price Action   and its own filtering algorithm to determine the trend. This approach helps to accurately determine entry points and the current trend on any timeframe. The indicator uses its own algorithm for analyzing price changes and Price Action. Which gives you the advantage of recognizing, without delay, a new nascent trend with fewer false positives. Trend filtering conditions can be selected in the settings individually for your trading style. The indicator
What are Heiken Ashi Candles? Heiken Ashi, derived from the Japanese term 'Heikin Ashi,' translates to average price bars. It's an indicator depicting price bars on a chart. Formula for Heiken Ashi candles: - Heiken Ashi opening price: (previous candle's opening + closing price) / 2 - Closing price Heiken Ashi: (opening + high + low + closing) / 4 - Heiken Ashi peak: Max of high, opening, or closing price - Heiken Ashi bottom price: Min of low, opening, or closing price How to Read Heik
The indicator displays renko bars on a chart, uses them to plot the fast and slow moving average and Stochastic, as well as it provides buy/sell signals: a buy signal is generated when the fast moving is above the slow one, and the signal line of Stochastic crosses the lower level from bottom up; a sell signal is generated when the fast moving is below the slow one, and the signal line of Stochastic crosses the upper level from top to bottom; Renko is a non-trivial price display method. Instead
Distinctive is a forex trending arrow indicator for identifying potential entry points. I like it, first of all, because it has a simple mechanism of work, adaptation to all time periods and trading tactics. Created on the basis of a regression channel with filters. Plotting the Lawrence indicator signals on a price function chart using a mathematical approach. How it works - when the price breaks out in the overbought / oversold zone (channel levels), a buy or sell signal is generated. Every
このプロダクトを購入した人は以下も購入しています
Gann Made Easy は、ミスター・ギャンの理論を使用した取引の最良の原則に基づいた、プロフェッショナルで使いやすい外国為替取引システムです。 W・D・ガン。このインジケーターは、ストップロスとテイクプロフィットレベルを含む正確な買いと売りのシグナルを提供します。 PUSH通知を利用して外出先でも取引可能です。 購入後はご連絡ください!私の取引のヒントと素晴らしいボーナスインジケーターを無料で共有します! おそらく、ギャンの取引手法についてはすでに何度も聞いたことがあるでしょう。通常、ギャンの理論は初心者のトレーダーだけでなく、すでにある程度の取引経験がある人にとっても非常に複雑なものです。なぜなら、ギャンの取引手法は理論的にはそれほど簡単に適用できるものではないからです。私はその知識を磨き、最良の原則を私の外国為替インジケーターに組み込むために数年を費やしました。 このインジケーターは非常に簡単に適用できます。必要なのは、それをチャートに添付し、簡単な取引推奨事項に従うだけです。このインジケーターは常に市場分析の仕事を行い、取引の機会を探します。適切なエントリーポイントを検出
Trend Punch
Mohamed Hassan
4.91 (23)
This indicator is unstoppable when combined with our other indicator called  Support & Resistance . After purchase, send us a message and you will get it   for  FREE as a BONUS! Introducing Trend Punch , the revolutionary forex trend indicator that will transform the way you trade! Trend Punch is uniquely designed to provide precise buy and sell arrows during strong market trends, making your trading decisions clearer and more confident. Whether you're trading major currency pairs or exotic sym
Gold Stuff
Vasiliy Strukov
4.9 (270)
Gold Stuff は、金専用に設計されたトレンド指標であり、あらゆる金融商品にも使用できます。 インジケーターは再描画せず、遅れません。 推奨時間枠 H1. それインディケータでフルオートExpert Advisor EA Gold Stuffが動作します。 あなたは私のプロフィールでそれを見つけることができます. 設定と個人的なボーナスを得るために、購入後すぐに私に連絡してください! トレンド スキャナーの強力なサポートを利用して、無料のインジケーターを入手し、プライバシーを守ります。あーみー!   設定 矢印を描く - オンオフ。 チャートに矢印を描く。 アラート - 可聴アラートのオンオフ。 メール通知 - オンオフ。 電子メール通知。 プチ通知 - オンオフ。 プッシュ通知。 次に、色域を調整します。 Gold Stuff は、金専用に設計されたトレンド指標であり、あらゆる金融商品にも使用できます。 インジケーターは再描画せず、遅れません。 推奨時間枠 H1. それインディケータでフルオートExpert Advisor EA Gold Stuff
mql5と Telegramの モーニング・ブリーフィングで、詳細とスクリーンショットを含む毎日のマーケット・アップデートをご覧 ください! FX Power MT4 NGは 、長年の人気を誇る通貨強度計FX Powerの次世代モデルです。 この次世代ストレングスメーターは何を提供するのでしょうか?初代FXパワーの魅力すべて プラス GOLD/XAUの強さ分析 より正確な計算結果 個別に設定可能な分析期間 カスタマイズ可能な計算上限値により、さらに優れたパフォーマンスを実現 もっと見たい人のための特別なマルチインスタンス設定 すべてのチャートでお好みの色を無限に設定可能 数え切れないほどの通知オプションにより、重要なことを見逃すことはありません。 Windows 11とmacOSのスタイルで角を丸くした新しいデザイン 魔法のように動くインジケーターパネル FXパワーの主な機能 すべての主要通貨の強さの完全な履歴 すべての時間枠における通貨の強さの履歴 すべてのブローカーとチャートで同一の計算結果 100%信頼できるリアルタイム計算 -> リペイントなし ドロップダウン・リストから
製品を購入する前に、以下の情報をお読みください。 Apollo Pips PLUS SP はユニークな製品です。これは、私の新しい「アポロ ピップス」インジケーターと、私のすべての取引インジケーターにアクセスできる「スーパー パック」ボーナスを手に入れたい人のためのものです。 Apollo Pips PLUS SP 製品を購入すると、実際には私の Apollo Pips インジケーターのまったく新しいバージョンを購入することになります。このバージョンのインジケーターには改良されたアルゴリズムと使いやすいパラメーターがあり、あらゆる市場およびあらゆる取引スタイルでインジケーターを使用する機会が得られます。 この製品の購入者は、私のスーパーボーナスとして、他のすべてのインジケーターにも無料でアクセスできます!私のすべての取引ツールにアクセスしたい場合は、この製品が最適です!:) しかし、これがすべてではありません!:) この製品のすべての購入者は、私の新しいインジケーターを無料で入手する資格もあります!:)新しい取引インジケーターを利用できるようになりました。私の特権のある「スーパー パッ
TPSpro TREND PRO は 、市場を自動的に分析し、トレンドとその各変化に関する情報を提供し、再描画せずに取引に参加するためのシグナルを提供するトレンド指標です。 インディケータは各ローソク足を使用し、個別に分析します。さまざまなインパルス(アップまたはダウンインパルス)を指します。通貨、仮想通貨、金属、株、指数の取引への正確なエントリーポイント! バージョンMT5                   インジケーターの完全な説明   インジケーター -   RFI LEVELS と併用することをお勧めします。 主な機能: レンダリングなしで正確な入力信号! シグナルが表示された場合、それは関連性を維持します。これは、シグナルを提供してからそれを変更する可能性があり、入金時の資金の損失につながる可能性があるリドローインジケーターとの重要な違いです。より高い確率と精度で市場に参入できるようになりました。矢印が表示された後、ターゲットに達する (利益確定) か反転シグナルが表示されるまで、ローソク足を色付けする機能もあります。 STOP LOSS / TAKE PROFIT
Please contact me after purchase to immediately get your PDF strategy + documentation for Trend Pulse !  Official release price of $89  (2 /50 copies left). Next price is $199 . Introducing Trend Pulse , a unique and robust indicator capable of detecting bullish, bearish, and even ranging trends! Trend Pulse uses a special algorithm to filter out market noise with real precision. If the current symbol is moving sideways, Trend Pulse will send you a ranging signal, letting you know that it'
An exclusive indicator that utilizes an innovative algorithm to swiftly and accurately determine the market trend. The indicator automatically calculates opening, closing, and profit levels, providing detailed trading statistics. With these features, you can choose the most appropriate trading instrument for the current market conditions. Additionally, you can easily integrate your own arrow indicators into Scalper Inside Pro to quickly evaluate their statistics and profitability. Scalper Inside
まず第一に、この取引インジケーターは再描画されず、再描画されず、遅延しないことを強調する価値があります。これにより、手動取引とロボット取引の両方に理想的なものになります。 ユーザーマニュアル:設定、入力、戦略。 アトミックアナリストは、価格の強さとモメンタムを利用して市場でより良いエッジを見つけるためのPA価格アクションインジケーターです。ノイズや誤ったシグナルを除去し、取引ポテンシャルを高めるための高度なフィルターを備えています。複雑なインジケーターの複数のレイヤーを使用して、アトミックアナリストはチャートをスキャンし、複雑な数学的計算をシンプルなシグナルと色に変換します。これにより、どのような初心者トレーダーでも理解して使用し、一貫した取引の決定を行うことができます。 「アトミックアナリスト」は、新規および経験豊富なトレーダー向けにカスタマイズされた包括的な取引ソリューションです。プレミアムインジケーターとトップノッチの機能を1つの取引戦略に組み合わせ、すべてのタイプのトレーダーにとって汎用性のある選択肢にします。 デイリートレーディングとスキャルピング戦略:高
Trend Screener
STE S.S.COMPANY
4.82 (92)
トレンドインジケーター、1つのツールに組み込まれたすべての重要なトレンド機能を備えたトレンドトレーディングとフィルタリングのための画期的なユニークなソリューション! これは、すべてのシンボル/商品(外国為替、商品、暗号通貨、インデックス、株式)で使用できる100%再描画されていないマルチタイムフレームおよびマルチ通貨インジケーターです。 トレンドスクリーナーは、チャート内のドットで矢印トレンドシグナルを提供するインジケーターに続く効率的なインジケーターです。 トレンド分析インジケーターで使用できる機能: 1.トレンドスキャナー。 2.最大利益分析を備えたトレンドライン。 3.トレンド通貨強度メーター。 4.アラート付きのトレンド反転ドット。 5.アラート付きの強いトレンドドット。 6.トレンド矢印 毎日の分析例、毎日のシグナルパフォーマンス...など、トレンドスクリーナーインジケーターを使用して、ここで見つけることができます: ここをクリックしてください 期間限定オファー:トレンドスクリーナーインジケーターは、50ドルと生涯でのみご利用いただけます。 (元の価格125 $) MQ
通貨強さウィザードは、取引を成功させるためのオールインワン ソリューションを提供する非常に強力な指標です。このインジケーターは、複数の時間枠のすべての通貨のデータを使用して、このまたはその外国為替ペアのパワーを計算します。このデータは、使いやすい通貨インデックスと通貨パワーラインの形式で表され、特定の通貨のパワーを確認するために使用できます。 必要なのは、取引したいチャートにインジケーターを接続することだけです。インジケーターは、取引する通貨の実際の強さを示します。このインジケーターは、トレンドに合わせて取引するときに有利に利用できる売買高の圧力の極値も示します。このインジケーターには、フィボナッチに基づく可能なターゲットも表示されます。 このインジケーターは、PUSH 通知を含むあらゆるタイプのアラートを提供します。 購入後ご連絡下さい。私の取引のヒントをあなたと共有し、素晴らしいボーナスインジケーターを無料で提供します! 幸せで有益な取引をお祈りします。
現在20%OFF! 初心者やエキスパートトレーダーのためのベストソリューション! このダッシュボードソフトウェアは、28の通貨ペアで動作しています。それは私達の主要な指標(高度な通貨の強さ28と高度な通貨インパルス)の2に基づいています。それは全体の外国為替市場の大きい概観を与えます。それは、すべての(9)時間枠で28の外国為替ペアのための高度な通貨の強さの値、通貨の動きの速度と信号を示しています。チャート上で1つのインディケータを使用して市場全体を観察し、トレンドやスキャルピングの機会をピンポイントで見つけることができたら、あなたのトレードがどのように改善されるか想像してみてください。 このインディケータには、強い通貨と弱い通貨の識別、潜在的な取引の識別と確認がより簡単になるような機能が搭載されています。このインディケータは、通貨の強さや弱さが増加しているか減少しているか、また、すべての時間枠でどのように機能しているかをグラフィカルに表示します。 新機能として、現在の市場環境の変化に適応するダイナミックなマーケットフィボナッチレベルが追加され、すでに当社のAdvan
Clear Breakout
Martin Alejandro Bamonte
5 (1)
「Breakout Buy-Sell」インジケーターは、異なる市場セッション(東京、ロンドン、ニューヨーク)での価格ブレイクアウトに基づいて、潜在的な売買機会を識別し、強調するために設計されています。このインジケーターは、トレーダーが買いゾーンと売りゾーン、および利益確定(TP)とストップロス(SL)レベルを明確に視覚化するのに役立ちます。 使用戦略 インジケーターは以下のように使用できます: 初期設定 :市場セッションを選択し、GMTオフセットを調整します。 市場の視覚化 :各セッションの開始時に描かれるブレイクアウトボックスを観察します。これらのボックスは期間の高値と安値を示します。 売買シグナル :ボックスの高値を超えた場合は買いシグナルと見なされます。安値を下回った場合は売りシグナルと見なされます。 リスク管理 :TP1、TP2、TP3、およびSLレベルを使用してポジションを管理します。TPレベルは異なる利益目標のために設計されており、SLは不利な動きに対する保護を保証します。 応用戦略 このインジケーターを最大限に活用するために、以下の戦略が推奨されます: ロンドンセッション
現在26%オフ 初心者やエキスパートトレーダーに最適なソリューション! このインジケーターは、独自の機能と新しい計算式を取り入れた、ユニークで高品質、かつ手頃な価格のトレーディングツールです。たった1枚のチャートで28の為替ペアの通貨強度を読み取ることができます。新しいトレンドやスキャルピングチャンスの引き金となるポイントを正確に特定することができるので、あなたのトレードがどのように改善されるか想像してみてください。 ユーザーマニュアルはこちら  https://www.mql5.com/en/blogs/post/697384 これが最初の1本、オリジナルだ! 価値のないクローンを買わないでください。 特別な サブウィンドウの矢印で強い通貨の勢いを表示 GAPがあなたのトレードを導く! 基準通貨や気配値が売られすぎ・買われすぎのゾーン(外相フィボナッチレベル)にあるとき、個別チャートのメインウィンドウに警告表示。 通貨がレンジの外側から反落した場合、プルバック/リバーサルのアラート。 クロスパターンの特別なアラート 複数の時間枠を選択可能で、トレンドを素早く
PRO Renko Systemは、特別にRENKOチャートを取引するために設計された高精度の取引システムです。 これは、様々な取引商品に適用することができる普遍的なシステムです。 システムは効果的に正確な逆転信号へのアクセスを与えるいわゆる市場の騒音を中和する。 表示器は非常に使いやすく、信号の生成に責任がある1つの変数だけがあります。 あなたは簡単にお好みの任意の取引ツールとレンコバーのサイズにツールを適応させることができます。 私はいつもあなたが私のソフトウェアで収益性の高い取引を支援するために余分なサポートを提供する準備ができています! 私はあなたに幸せで収益性の高い取引をしたいです! ご購入後にご連絡ください! 私はあなたに私のレンコチャートジェネレータを送信します。 私はまた、私の個人的な推奨事項やシステムの他のモジュールを無料で共有します!
Gold Channel is a volatility-based indicator, developed with a specific timing algorithm for the XAUUSD pair, which consists of finding possible corrections in the market. This indicator shows two outer lines, an inner line (retracement line) and an arrow sign, where the theory of the channel is to help identify overbought and oversold conditions in the market. The market price will generally fall between the boundaries of the channel. If prices touch or move outside the channel it is a tra
まず第一に、この取引ツールはノンリペイント、ノンリドロー、ノンラグの指標であり、プロの取引に理想的ですことを強調する価値があります。 オンラインコース、ユーザーマニュアル、デモ。 スマートプライスアクションコンセプトインジケーターは、新米から経験豊富なトレーダーまで、非常 に強力なツールです。Inner Circle Trader AnalysisやSmart Money Concepts Trading Strategiesなど、20以上の有用な指標を1つに組み合わせています。このインジケーターはスマートマネーコンセプトに焦点を当て、大手機関の取引方法を提供し、彼らの動きを予測するのに役立ちます。 特に、流動性分析に優れており、機関がどのように取引しているかを理解しやすくしています。市場のトレンドを予測し、価格の動きを慎重に分析するのに優れています。機関の戦略とトレードを合わせることで、市場の動向についてより正確な予測ができます。このインジケーターは多目的であり、市場構造を分析し、重要な注文ブロックを特定し、さまざまなパターンを認識するのに優れています。 このインジケー
現在31%オフ! 初心者やエキスパートトレーダーに最適なソリューション! このインジケータは、独自の機能と秘密の数式を組み込んだ、ユニークで高品質かつ手頃な価格のトレーディングツールです。たった1枚のチャートで28の通貨ペアのアラートを表示します。新しいトレンドやスキャルピングチャンスの引き金となるポイントを正確に把握することができるので、あなたのトレードがどのように改善されるか想像してみてください! 新しい基本的なアルゴリズムに基づいて構築されているため、潜在的な取引の特定と確認がより簡単になります。これは、通貨の強さや弱さが加速しているかどうかをグラフィカルに表示し、その加速のスピードを測定するためです。加速すると物事は明らかに速く進みますが、これはFX市場でも同じです。つまり、反対方向に加速している通貨をペアにすれば、利益を生む可能性のある取引を特定することができるのです。 通貨の勢いを示す縦の線と矢印は、あなたの取引の指針となるでしょう。 ダイナミックマーケットフィボナッチ23レベルはアラートトリガーとして使用され、市場の動きに適応します。もしインパルスが黄色
NAM Order Blocks
NAM TECH GROUP, CORP.
5 (1)
MT4マルチタイムフレームオーダーブロック検出インジケーター。 特徴 -チャートコントロールパネルで完全にカスタマイズ可能で、完全な相互作用を提供します。 -必要な場所でコントロールパネルを表示および非表示にします。 -複数の時間枠でOBを検出します。 -表示するOBの数量を選択します。 -さまざまなOBユーザーインターフェイス。 -OBのさまざまなフィルター。 -OB近接アラート。 -ADRの高線と低線。 -通知サービス(画面アラート|プッシュ通知)。 概要 注文ブロックは、金融機関や銀行からの注文収集を示す市場行動です。著名な金融機関と中央銀行が外国為替市場を牽引しています。したがって、トレーダーは市場で何をしているのかを知る必要があります。市場が注文ブロックを構築するとき、それは投資決定のほとんどが行われる範囲のように動きます。 注文の構築が完了すると、市場は上向きと下向きの両方に向かって急激に動きます。注文ブロック取引戦略の重要な用語は、機関投資家が行っていることを含むことです。それらは主要な価格ドライバーであるため、機関投
今、147ドル(いくつかの更新後に499ドルに増加します) - 無制限のアカウント(PCSまたはMac) RelicusRoad ユーザー マニュアル + トレーニング ビデオ + プライベート Discord グループへのアクセス + VIP ステータス 市場の新しい見方 RelicusRoad は、外国為替、先物、暗号通貨、株式、および指数の世界で最も強力な取引インジケーターであり、トレーダーに収益を維持するために必要なすべての情報とツールを提供します。初心者から上級者まで、すべてのトレーダーが成功するためのテクニカル分析と取引計画を提供します。これは、将来の市場を予測するのに十分な情報を提供する重要な取引指標です。意味をなさないチャート上のいくつかの異なる指標ではなく、完全な解決策を信じています.これは、信号、矢印 + 価格アクション情報を表示するオールインワンのインジケーターで、他に類を見ない非常に正確です。 強力な AI に基づいて、RelicusRoad は不足している情報とツールを提供して、あなたを教育し、トレーディングのプロ、成功したトレーダーにします。
トレンドトレーディング は、タイミングのプルバックとブレイクアウトにより、市場で起こっているトレンドから可能な限り利益を得るように設計された指標です。確立されたトレンドの中で価格が何をしているかを分析することにより、取引の機会を見つけます。 [ インストールガイド | 更新ガイド | トラブルシューティング | よくある質問 | すべての製品 ] 自信を持って効率的に金融市場を取引する むち打ちにならずに確立されたトレンドから利益を得る 収益性の高いプルバック、ブレイクアウト、早期の逆転を認識する この指標は、独自の品質とパフォーマンスを分析します 複数時間枠のダッシュボードを実装します インジケーターは再描画されていません 電子メール/音声/視覚アラートを実装します 確立されたトレンドは多くの取引機会を提供しますが、ほとんどのトレンド指標はそれらを完全に無視しています。インジケーターの解釈はかなり簡単です: (1) トレンドの変化 (2) トレンドの方向への後退 (3) トレンドの方向へのブレイクアウト 赤いダッシュ は下降トレンド中の修正です 青いダッシュ は上昇ト
最初のパルスレベルを反転 (RFI)     指示する     ロシア     -        utilizar con   el indicador の ESP 推奨事項 -   TPSpro トレンド プロフェッショナル版 -   MT5のバージョン 最も重要なことは、将来においても最も重要なことです。 機能のプリンシパル: ゾーンのほとんどは、ベンダーとコンプラドールによってアクティブ化されます。 状況を直感的に把握できるよう、初期の衝動を修正します。 LOGIC AI: MUESTRA zonas (círculos) parabuscar puntos de entrada cuando se activa una plantilla 視覚的に優れた視覚効果があり、最も重要な機能がすべて揃っていることに注意してください。 優れたニベレス/ゾーンの視覚化 (modo MTF) 世界で最も人気のある場所/ゾーンです。これを使用するのに最適な方法です (   TPSproTREND PRO   )。 アルゴリズム プロフェッショナル セパラド パソ ア パソ パラ オペラ それは
Break and Retest
Mohamed Hassan
4.17 (18)
This Indicator only places quality trades when the market is really in your favor with a clear break and retest. Patience is key with this price action strategy! If you want more alert signals per day, you increase the number next to the parameter called: Support & Resistance Sensitivity.  After many months of hard work and dedication, we are extremely proud to present you our  Break and Retest price action indicator created from scratch. One of the most complex indicators that we made with ove
Order Block Hunter
Noha Mohamed Fathy Younes Badr
5 (2)
Order block hunter indicator is the best indicator for  hunt the order blocks that area where there has been a large concentration of limit orders waiting to be executed Order blocks are identified on a chart by observing previous price action and looking for areas where the price experienced significant movement or sudden changes in direction .This indicator does that for you by using very complicated codes and helps you to take the best areas To buy and sell because it make marks at the best a
Scalper Vault は、スキャルピングを成功させるために必要なすべてを提供するプロフェッショナルなスキャルピング システムです。このインジケーターは、外国為替およびバイナリー オプションのトレーダーが使用できる完全な取引システムです。推奨される時間枠は M5 です。 システムは、トレンドの方向に正確な矢印シグナルを提供します。また、トップとボトムのシグナルとギャン マーケット レベルも提供します。 インジケーターは、プッシュ通知を含むすべてのタイプのアラートを提供します。 インジケータの購入後にご連絡ください。私の個人的な取引の推奨事項と素晴らしいボーナス指標を無料で共有します! 幸せで有益な取引をお祈りします!
M1 Arrow
Oleg Rodin
4.73 (15)
市場の2つの基本原則に基づく日中戦略。 このアルゴリズムは、追加のフィルターを使用したボリュームと価格の波の分析に基づいています。インディケータのインテリジェントアルゴリズムは、2つの市場要因が1つに結合した場合にのみシグナルを出します。インディケータは、より高い時間枠のデータを使用して、M1チャート上の特定の範囲の波を計算します。そして波を確認するために、インジケーターはボリュームによる分析を使用します。 このインディケータはレディトレーディングシステムです。トレーダーが必要とするのは、信号に従うことだけです。また、インジケーターはあなた自身の取引システムの基礎になることができます。取引はミニッツチャートでのみ行われます。 インジケーターがMTFの原則を使用しているという事実にもかかわらず、インジケーターのアルゴリズムは可能な限り安定しています。 購入後、必ず私に書いてください!私の取引設定と推奨事項をあなたと共有します!
`All in One Chart Patterns` チャートパターンはトレーダーの間で議論の的となっています。信頼できるシグナルだと考える人もいれば、そうでないと考える人もいます。当社の「Chart Patterns All-in-One」インジケーターは、これらのパターンを表示し、自分自身で理論を検証できるようにします。これらのパターンの収益性は、インジケーターの有効性を反映するものではなく、むしろパターン自体の評価です。「Chart Patterns All-in-One」インジケーターは、これらのパターンを視覚化するための優れたツールであり、取引戦略における有効性について自分自身で結論を下すことができます。 このインジケーターは、複数のチャートパターンを1つの統合ツールに組み合わせて、MetaTrader 4 (MT4) で使用します。チャートから直接各パターンをオンまたはオフに切り替える機能を提供し、カスタマイズ可能で効率的な分析を可能にします。以下は、インジケーターとその中に含まれるパターンの詳細な説明です。 #### 含まれるパターン: 1. **パターン
Advanced Supply Demand
Bernhard Schweigert
4.9 (314)
現在33%オフ 初心者にもエキスパートトレーダーにも最適なソリューション このインジケーターは独自の機能と新しい公式を多数内蔵しており、ユニークで高品質かつ手頃な取引ツールです。このアップデートでは、2つの時間枠ゾーンを表示できるようになります。より長いTFだけでなく、チャートTFとより長いTF(ネストゾーンを表示)の両方を表示できます。すべてのSupply Demandトレーダーの皆さんのお気に召すはずです。:) 重要情報の公開 Advanced Supply Demandの可能性を最大化するには、 https://www.mql5.com/ja/blogs/post/720245 にアクセスしてください。   エントリーまたはターゲットの正確なトリガーポイントを正確に特定できれば取引がどのように改善されるか想像してみてください。新しい基盤となるアルゴリズムに基づいて構築されているため、買い手と売り手の間の潜在的な不均衡をさらに簡単に特定できます。これは、最も強い需要と供給のゾーンと、過去のパフォーマンス(古いゾーンを表示)がグラフィカルに表現されるためです。これらの機能は、最適
AW Trend Predictor
AW Trading Software Limited
4.74 (39)
1 つのシステムでのトレンド レベルとブレイクダウン レベルの組み合わせ。高度なインジケーター アルゴリズムは、市場のノイズをフィルター処理し、トレンド、エントリー ポイント、および可能なエグジット レベルを決定します。インジケーターシグナルは統計モジュールに記録されるため、最適なツールを選択してシグナル履歴の有効性を示すことができます。この指標は、テイクプロフィットとストップロスのマークを計算します。 マニュアル・説明書→   こちら / MT5版→   こちら インジケーターで取引する方法: Trend Predictor での取引は、たった 3 つの簡単なステップです。 ステップ 1 - ポジションを開く 70% 以上の成功率で買いシグナルが受信されました ステップ 2 - ストップロスの決定 逆信号でトランクを選択 ステップ 3 - テイクプロフィット戦略の定義 戦略 1: TP1 に到達したらポジション全体をクローズする 戦略 2: TP1 に達した時点でポジションの 50% をクローズし、TP2 に達した時点で残りの 50% をクローズします。 戦略 3: トレンドの反転で
Connect Indicator is a tool used for connecting indicators between the MQL market and MT4. The connected indicators are made by our group and can be used for other applications, such as sending messages to the Line application or Telegram application. If you have any questions, please don't hesitate to ask us to receive support. Function and indicator buffer Buffer one is the high price of the previous candle. Buffer two is the high price of the previous candle. Usage To connect indicators to fu
作者のその他のプロダクト
ExactArrows
Pavel Krysanov
3.88 (8)
The main aim of this indicator lies in determining entry and exit points, that is why the ExactArrow indicator does not draw nothing but arrows which show entry and exit points. In spite of apparent simplicity of the indicator, it has complicated analytic algorithms which determine entry and exit points. The indicator generates exact and timely entry and exit signals which appear on the current candle. The indicator generates an average of 1-2 candles before its analogues do. The indicator is ve
For any trader, the result of market analysis is the correct determination of entry and exit points from the market. The ClearArrows indicator does not display any unnecessary information that may distract or mislead the trader, but only the most important thing. The indicator is very easy to use, when a down arrow appears, you need to open a SELL deal, when an up arrow appears you need to open a BUY deal. The ClearArrows indicator, despite its outward simplicity, has a large analytical algor
Correct market entries and exits are essential for any Forex trader. MasterArrow indicator addresses this issue. It has no redundant elements and draws only buy/sell arrows. The up arrow is a BUY signal, while the down arrow is a SELL one. The indicator is simple to configure. Change the Strength parameter to configure the signals frequency. The product is based on standard indicators (MA, RSI, ATR, etc.). But it also features the custom algorithm allowing to combine them into a single tool and
The main objective of this indicator is to determine entry and exit points, that is why ExactArrow draws nothing but arrows showing entry and exit points. In spite of apparent simplicity of the indicator, it has complicated analytic algorithms which determine entry and exit points. The indicator generates exact and timely entry and exit signals which appear on the current candle. The indicator generates an average of 1-2 candles before its analogues do. The indicator is very easy to use. Open Bu
RightTrend
Pavel Krysanov
5 (3)
The RightTrend indicator shows the direction of trend and reversal points (market entry and exit points). It is very easy to use: open BUY deal when the up arrow appears and open SELL deal when the down arrow appears. The indicator generates accurate and timely signals for entering and exiting the market, which appear on the current candle while it is forming. In spite of apparent simplicity of the indicator, it has complex analytic algorithms which determine trend reversal points. Inputs stre
This indicator is designed to help traders in determining the market entry and exit points. It is very easy to use: open s BUY deal when the up arrow appears and open s SELL deal when the down arrow appears. The indicator is based on the basic indicators (MA, MACD, RSI) as well as original algorithms. The indicator does not redraw, arrows appear when a new candle opens. Input Parameters: strength - indicator period EnableAlerts - enable/disable alerts EmailAlert - send notifications to email w
The Analytic Trade indicator is a complete trading system. It consists of 4 parts: The first part is the arrows showing the most optimal points for opening and closing orders. The up arrow is a buy signal, the down arrow is a sell one. The second part is the information panel in the upper right corner. The current price is shown in a larger font, above it are: the daily High, distance from the current price to the daily High, and the difference between the High and Low (in points). Below it are:
Smart Help
Pavel Krysanov
3.67 (3)
The 'Smart Help' indicator is an excellent assistant for beginners and experienced traders. It consists of 3 parts: The first part provides entry and exit signals in the form of arrows. The up arrow is a signal of an uptrend, the down arrow indicates a downward trend. The second part shows the direction and strength of the current trend. The third part provides information on the currency pair state. The current price is indicated at the top. Below it are: the daily Low and High, the point dista
Индикатор Analytic System - это полноценная торговая система. Он состоит из 2 частей: Первая - это стрелочки, показывающие наиболее оптимальные точки открытия и закрытия сделок. Стрелка вверх - сигнал на покупку,стрелка вниз - на продажу. Индикатор использует сложные аналитические алгоритмы, при помощи которых система определяет моменты входов и выходов. Вторая - это информационная панель в правом верхнем углу. Крупным шрифтом обозначена цена, справа от неё показано текущее направление тренда (в
Данный индикатор рисует на графике стрелки, которые являются сигнала на вход и выход из сделки, а также в качестве фильтра индикатор окрашивает каждую свечу в синий и красный цвет. Дополнительно ко всему в левом верхнем окне показывается сила тренда и его направление по основным парам. У индикатора новая логика, которая существенно отличает его от множества аналогов. Он дает ранние сигналы на вход и на выход, свои значения не перерисовывает — то есть, если индикатор дал сигнал на вход в сделку,
Индикатор Trading Strategy призван помочь трейдерам в поиске оптимальных входов в сделку и выходов из неё. В его основе лежат показания технических индикаторов (MA, RSI, ATR и др.), а также авторский алгоритм, связывающий их сигналы в единое целое. Индикатор даёт сигналы на покупку и продажу в виде стрелочек: стрелочка вверх — сигнал на покупку, вниз — на продажу.   В правом верхнем углу показаны сигналы индикатора на 6 таймфреймах (M1, M5, M15, M30, H1, H4) данной валютной пары.  Индикатор с
This indicator is designed to identify trend reversal points. Its main difference from others is that it does not use moving indicators such as MA and built on its basis, namely, it does not show a trend reversal after the fact of a reversal, but tries to predict a trend reversal even BEFORE the reversal begins. The indicator is based on many different author's developments that allow you to minimize the number of false signals. The Trend Predictor indicator will be a very good helper in your
The Smart Strategy Indicator is a trading system that allows you to analyze the market in terms of several aspects of technical analysis. The first of them is a price channel, which is built automatically and allows the trader to see the main direction of price movement. It also makes it possible to analyze the market using a channel strategy (breakout and rebound from channel lines). Block 2 is the SAR system, which gives general information about the micro-movements in the market and this i
The indicator has a new logic, which significantly distinguishes it from many analogues. It gives early entry and exit signals, does not redraw its values - that is, if the indicator gave a signal to enter a trade, then this signal will not disappear and will not move - it will remain where it appeared, and it also gives signals to opening a candle, which gives the trader a significant advantage in trading. The indicator is very easy to use. When a red line appears under the candles, you need
For any trader, the result of market analysis is the correct identification of the market entry and exit points. The more correctly they are selected, the more profitable the trading. The SmartArrows indicator does not display any excessive information that may distract or confuse the trader, but only the mot important things. The indicator is very simple to use. When a down arrow appears, open a SELL trade, with an up arrow open BUY. Despite its seeming simplicity, the SmartArrows indicator con
This indicator is designed to help traders find the market entry and exit points. The indicator generates signals in the form of arrows, which is a simple and intuitive for use in trading. In spite of apparent simplicity of the indicator, it has complicated analytic algorithms which determine entry and exit points. Its operation is based on moving averages, RSI, candlestick patterns, as well as certain original developments. Open a Buy position when an upward arrow appears, and a Sell position w
Основная цель индикатора заключается в определении наиболее оптимальных точек входа в сделку и выхода из нее. Индикатор состоит из трех частей. Первая – это стрелки, показывающие оптимальные точки входа в сделку и выхода из нее. Стрелка вверх – сигнал на покупку, стрелка вниз – на продажу. В индикаторе заложен алгоритм аналитического анализа, который включает в себя множество показаний стандартных индикаторов, а также авторский алгоритм. Вторая часть – это информация в правом верхнем углу (работ
Индикатор Analytic Trade - это полноценная торговая система. Он состоит из 4 частей: Первая - это стрелочки, показывающие наиболее оптимальные точки открытия и закрытия ордеров. Стрелка вверх - сигнал на покупку, вниз - на продажу. Вторая - это информационная панель в правом верхнем углу. Крупным шрифтом обозначена текущая цена, над ней показаны: максимум дня, расстояние от текущей цены до него и разность максимума и минимума (в пунктах). Под ней расположены: минимум дня, расстояние до минимума,
Индикатор Trading Strategy призван помочь трейдерам в поиске оптимальных входов в сделку и выходов из неё. В его основе лежат показания технических индикаторов (MA, RSI, ATR и др.), а также авторский алгоритм, связывающий их сигналы в единое целое. Индикатор даёт сигналы на покупку и продажу в виде стрелочек: стрелочка вверх — сигнал на покупку, вниз — на продажу. В правом верхнем углу показаны сигналы индикатора на 6 таймфреймах (M1, M5, M15, M30, H1, H4) данной валютной пары. Индикатор свои з
フィルタ:
Farooq Majoka
1817
Farooq Majoka 2019.04.06 10:39 
 

Thanx for the support Pavel and for a good indicator. Cheers!

Jonathan Vodini
583
Jonathan Vodini 2019.04.02 17:09 
 

great and very accurate signals, i don't get how this dude has so few reviews on his products... 5 stars!

Evgenij_serg97
19
Evgenij_serg97 2018.04.19 19:59 
 

ユーザーは評価に対して何もコメントを残しませんでした

iamgold
1996
iamgold 2018.03.17 15:26 
 

This is a great indikator, make good profit to me, because it is good to make entry, and it Works for all pair, thanks to the creator, 5 star from me

レビューに返信
バージョン 3.3 2019.08.06
Теперь панель индикатора на любом экране отображается одинаково
バージョン 3.2 2019.04.05
Вместо параметра Show_info добавлены параметры:
Show_panel - показывать/не показывать панель с показаниями индикаторов
Show_trend - показывать/не показывать информацию о тренде
corner1, corner2 - привязка к углу панели и информации о тренде соответственно (0 - левый верхний, 1 - правый верхний).
バージョン 3.1 2019.01.25
Небольшие правки алгоритма
バージョン 2.3 2019.01.21
Теперь таймфреймы на панели идут по порядку, также добавлена строка INDIC с показаниями данного индикатора на разных таймфреймах
バージョン 2.2 2018.04.25
The indicator has been optimized, 2 parameters have been added:
1. EmailAlerts - whether to send email alerts when a signal emerges
2. MobileAlerts - whether to send push notifications when a signal emerges