Price Action Free
- インディケータ
- Bogdan Kupinsky
- バージョン: 1.1
- アップデート済み: 25 9月 2019
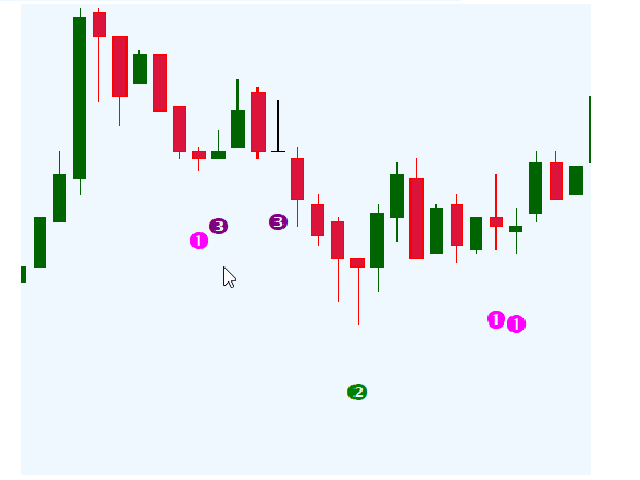
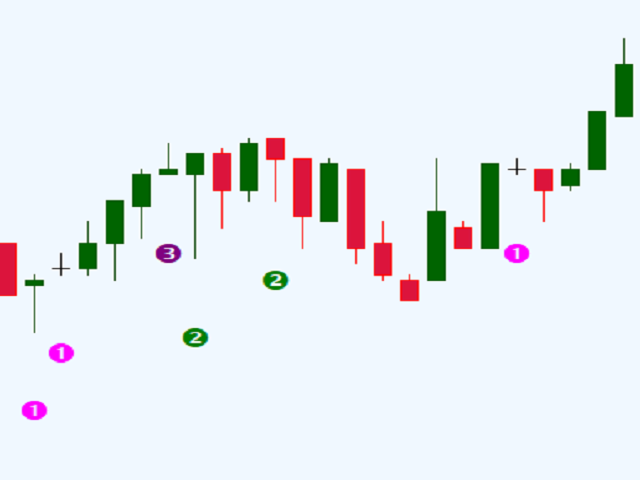
This indicator looks for 3 rather strong patterns:
- Spinning Top pattern
- Hammer or Hanging Man
- Inverted Hammer or Shooting Star
These patterns may indicate a trend continuation or its reversal, depending on the location of the patterns.
Input parameters
- Distance - distance between the signal and the formed signal
Note: the higher the timeframe, the greater the value should be used in Distance to display the signal correctly
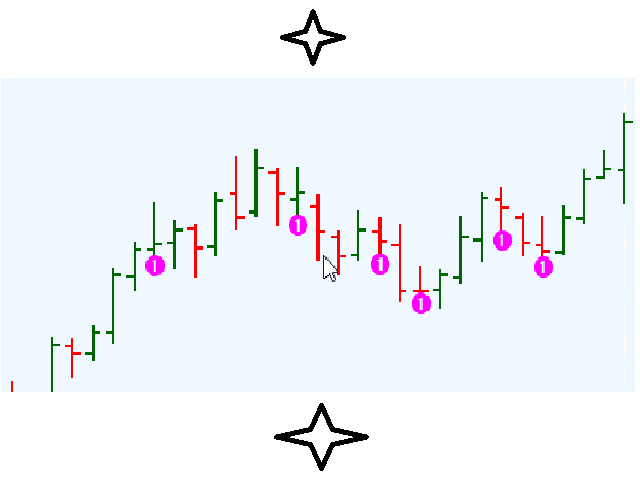
Indicator Features
- Suitable for any currency pair
- Operating timeframe: the EA works on any timeframe, all periods
- Calculates a large number of signals in history
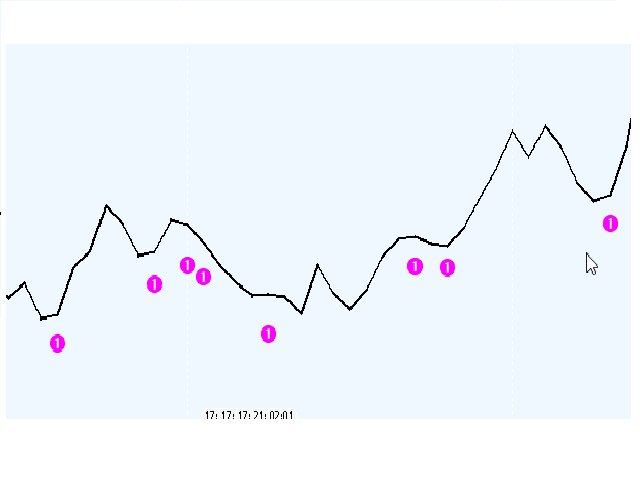
Signal Types
- 1 - Found the Spinning top pattern
- 2 - Found the Hammer pattern
- 3 - Found the Inverted Hammer pattern


ユーザーは評価に対して何もコメントを残しませんでした