• 概要
  • レビュー
  • コメント
  • 最新情報

Brief report weekly trade 4

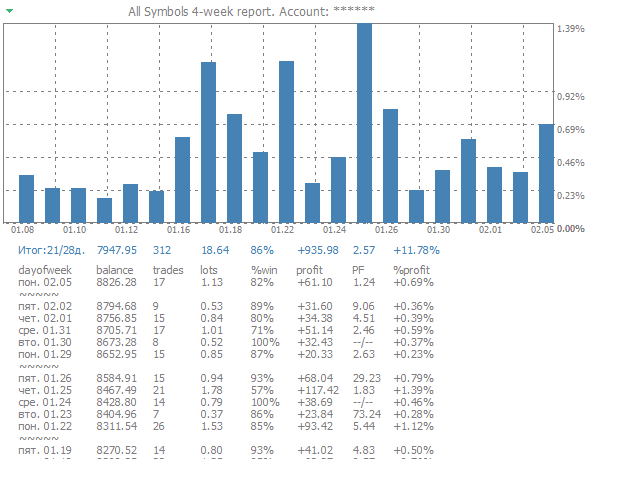
The script creates a brief daily summary report of the weekly trade in a separate window.


Input parameters of the script

  • number of weeks - set the time interval (the number of weeks) for the report.
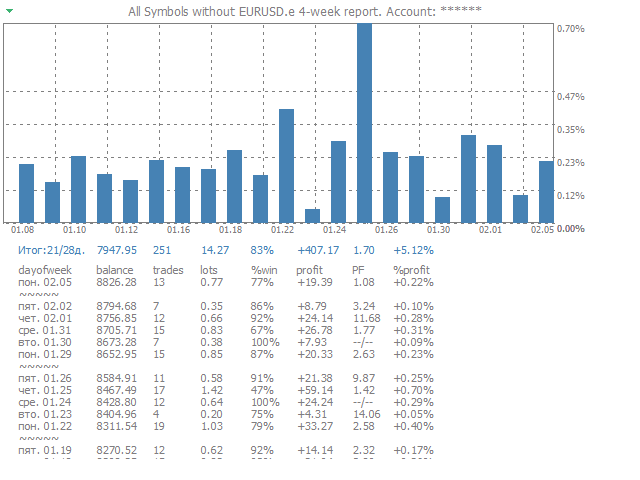
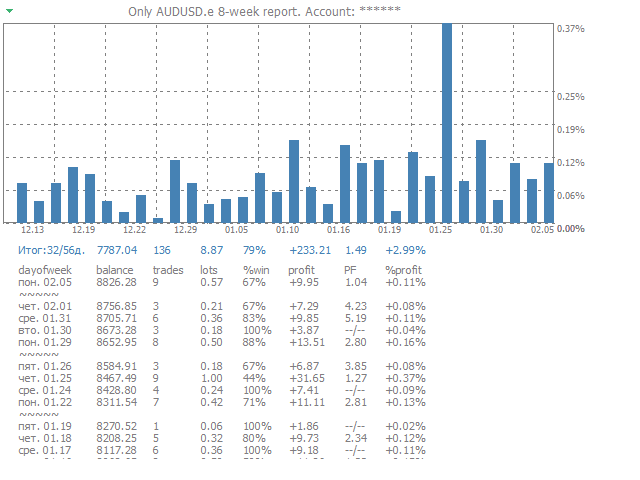
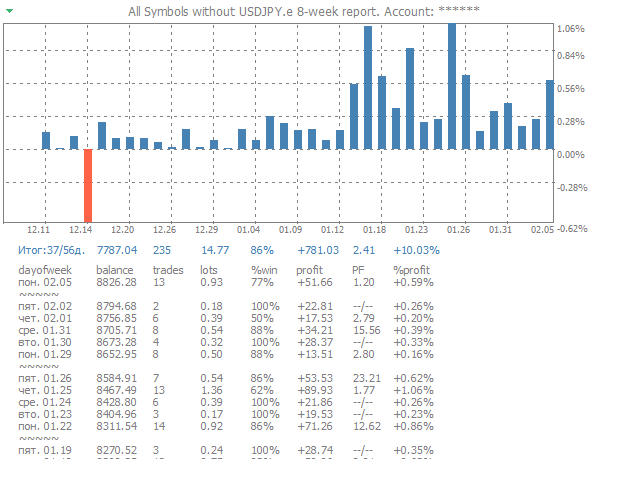
  • switch for symbols selection - three modes for selecting the instruments to generate the report:
    • All_Symbols - report is generated for deals of all instruments.
    • Current_Symbols_Only - report is generated only for deals of the instrument in the current window.
    • Without_Current_Symbols - report is generated for all deals of all instruments, except the current one.
  • hide account number - show/hide the account number.
おすすめのプロダクト
CloseProfit is a utility created to automate the process of setting a stop-loss and closing orders when a certain percentage of profit is reached. The utility also has two Buy and Sell buttons on the chart for opening orders. The utility can be used to close orders opened by other advisors, with a stop-loss or a percentage of the increase in the deposit. To do this, you need to set in the settings a magic number that matches the one that is installed in the advisor when opening a transactio
FREE
The script clears the chart window from labels of order tracing. It removes labels of only closed orders. It clears charts in all windows opened in the terminal. Parameters: Symbol: clear charts of the specified symbol. If not said, clear charts in all windows. Last Data : orders with a date of closure which goes after the specified one will not be deleted. If not said, tracing of all closed orders will be deleted. Confirmation : True - confirmation of chart clearance for each window, False -
This tool automatically sets stop loss and take profit when opening orders. The information is displayed in the lower right corner of the terminal and displays the lot size, stop loss and take profit levels, as well as the current profit/loss in points for each open order. It is possible to close orders. to do this, double-click the desired order in the lower right corner and simply move it to the left. It also displays recommendations for the current instrument in the form of OPEN BUY,
FREE
Open Risk Profit  shows your current risk or possible profit of all open positions. Total open risk   is your loss if all positions run into the stop loss. Total open profit   is your profit if all positions reach your take profit. Total float   is your current profit or loss of all positions. The program also breaks down the information into the individual symbols. For example, you can monitor how much is your current profit and your potential risk in EURUSD, no matter how many individual po
Easy Trade Panel
Kritchavatchara Datchkanakorn
EasyTrade is a dashboard that make trading easier. EasyTrade can help you to calculate and send command. EasyTrade have 3 tabs. Tab 1 Display data about information and orders in the current symbol Show all order Profit/Loss. Show all buy order Profit/Loss. Show all sell order Profit/Loss. Show average price of all opened order(buy and sell). Show average price of all buy order. Show average price of all sell order. Show total lot buy order. Show total lot sell order. Show total order buy. Show
ChartChanger は、端末上で開いているチャートの数を減らすための優れたユーティリティ ツールです。これには、シンボル、タイムフレーム、テンプレートの 3 つのセクションがあります。開いているグラフは 1 つだけですが、複数のグラフまでスクロールできます。 シンボル: ボタンを押すだけで、あるシンボルから別のシンボルに変更でき、適用したインジケーターは次のチャートに残ります。シンボルには自動検出モードがあり、希望するシンボルを手動で入力することもできます。 28 個すべて、またはそれ以下の任意の番号を使用できます。 MetaTrader にある通貨ペア、エネルギー、指数、商品などのシンボルを使用できます。 タイムフレーム: パネルの中央にタイムフレームチェンジャー機能を追加しました。ボタンを押すだけで、1分足から月足チャートまでお好みの時間足に変更できます。 テンプレート: このパネルの 3 番目の機能は、テンプレート チェンジャーです。 9 つの組み込みテンプレート。任意のテンプレートを使用することも、まったく使用しないこともできます。 すべてのボタンはフリーフローティングパ
My Account Brokers Details List This script displays the account data and broker terms regarding its operation. For example, broker name, account number, financial leverage, account currency, automatic trading approval, minimum lot, lot step, maximum number of lot, margin call, stop out and many other important data. It is easier to display such data on the chart in one moment with a click of the mouse, than to look for it in the contract or call the broker. Details are printed not on the scree
FREE
Seconds Chart — timeframes in seconds for MetaTrader 4. The utility allows you to create charts in the MetaTrader 4 terminal with a timeframe in seconds. The timeframe on such a chart is set in seconds, not in minutes or hours. Thus, you can create charts with a timeframe less than M1. For example, S15 is a timeframe with a period of 15 seconds. You can apply indicators, Expert Advisors and scripts to the resulting chart. You get a fully functional chart on which you can work just as well as on
The List swap is an indicator for the MetaTrader 4 platform, which allows to display swaps for all symbols (available in the Market Watch). When using the free demo version, you need to remember that the Strategy Tester of the MetaTrader 4 does not provide the ability to obtain data on other symbols. In the Strategy Tester, the swap information will be displayed only for the symbol the indicator is attached to. The indicator can be useful for traders utilizing the "Carry trade" strategy, as well
MFF FTMO risk management helps to close all orders when the balance falls below the previously set level. Input Parameters: Management Type:   Percent % Daily drawdown (MFF). Close all orders if Percent % drawdown based on equity: Set  Percent  with this  Management Type. Management Type : Set Equity Close all (FTMO). Number of Equity to close all orders:  Set Number with this  Management Type.
The script opens a separate window and displays information about the current open positions in it. The informer will be useful to those who operate with a large number of positions open on different instruments in different directions. It allows you to quickly decompose the loading of the deposit by instruments, visually identify the most tense places in the aggregate position. For the exposed stop orders, it calculates the total risks and goals.
Pivot Timeframe
Mohamad Zulhairi Baba
5 (12)
Daily pivot are relatively important in trading. This indicator have options to select 5 commonly use pivot point calculations. User input Choose Pivot Point Calculation ( Method Classic, Method Camarilla, Method TomDeMark, Method Fibonacci or Method Woodies. ) Choose Applied Timeframe for the calculation (M5, M15, H1, H4, D1, W1 etc) Can be attached to any timeframe Choose color of Pivot point For MT5 version, please refer here:  https://www.mql5.com/en/market/product/38816
FREE
The   Pivot Point indicator   automatically calculates and displays the pivot point line and support and resistance levels. Pivot can be calculated according to the Classic, Floor, Fibonacci, Woodie, Camarilla or DeMark formula. It is also possible to select the period for calculating the indicator. A trader can choose from daily, weekly, monthly, or user-defined periods. Types of pivots Classic Floor Fibonacci Woodie Camarilla DeMark Main features The indicator shows the current and histor
FREE
**IMPORTANT** THIS TOOL REQUIRES YOU TO FIRST PURCHASE "Graphical Trade Planner" https://www.mql5.com/en/market/product/56702. Without it, this tool will do nothing of any use. -------------------------- Use "Graphical Trade Planner"  to plan your trades directly on your charts and get instant feedback on account risk, trade risk to reward and  required position size. Plus, purchase LMBF Executor separately to easily convert planned trades into orders and manage them from your charts. Features i
This is an extension of the previous published DollarIndex with the addition of the function for calculating EURO Index under ICE Formula. Note that the broker should provide the following data: For Dollar Index formula, EURUSD, USDJPY, GBPUSD, USDCAD, USDSEK and USDCHF are needed. For Euro Index formula, EURUSD, EURGBP, EURSEK and EURCHF are needed. Now in this version if the SEK (the most uncommon) is not provided, the formula still works, since it adds 0.0001 to its value, but the index will
FREE
In the financial world, risk management is the process of identification, analysis and acceptance of uncertainty in investment decisions. Essentially, risk management occurs when an investor or fund manager analyzes and attempts to quantify the potential for losses in an investment, such as a moral hazard, and then takes the appropriate action given his investment objectives and risk tolerance. This tool should be the success key before you lost your capitals due to the unawareness of market beh
This script can generated a text file including Account information such as Account Number Account Name Account Leverage Account Balance MT4 Location Data Folder Location  Demo / Real Account  Stop Out Mode  Stop Out Level etc. Enjoy the script.  Please leave a comment or send me an email if you have any idea. The Script is developed by Steve Wan (Eamil: fxac01@gmail.com)
FREE
A full-featured trading panel that has minimal dimensions and makes one-click trading as informative, fast and convenient as possible. Supported features: opening of any types of orders; breakeven; trailing-stop; virtual take profit and stop loss (not visible to the broker); showing the general trading information panel; display of previously closed orders on the chart; installation on a chart of price signal lines; sending push-notifications when price crosses price signal lines; the ability
FREE
専門家のアドバイザーマニュアル工事の傾向線に伴う損益は、受益となりました。 ビルド後、EAはレベル、方向、およびロットを記憶します。 計算された価格で現在の価格をタッチすると、事前に選択されたパラメータを持つ注文が開かれます。 異なる時間枠から最大10の多方向レベルを構築して保存することができます。 あなたは、任意の取引商品でそれを使用することができ これは、4桁と5桁の価格で正しく動作します。 あなたは、取引チャネルの内訳とそれからのリバウンドの両方のいくつかの取引ラインから取引戦略を作成することができます。 市場価格がそれに触れていない場合は、取引ラインのすべての設定が削除される期間を設定することができます。 トレンド目標の計算の便宜のために、設定レベルを備えた組み込みのFiboルーラーがありますが、イベント処理の特殊性のために、この関数はテスト中に
Contact us for any custom order, CodeYourTrade.com . Timed Close EA is used to close all the trades automatically at your specific time. You can set the EA using any of the 3 options: 1.     OneTime: In this option EA will run only once. Execute at that date-time and stops. 2.     Weekly: In this option EA will run at specific day-time every week. For example if you wanted to close all the trades before market close at Friday, you can use this option. 3.     Daily: In this option EA will run d
The indicator shows the potential trend direction by cyclical-wave dependence. Thus, all the rays of the intersection will be optimal rays, in the direction of which the price is expected to move, taking into account the indicator period. Rays can be used as a direction for potential market movement. But we must not forget that the approach must be comprehensive, the indicator signals require additional information to enter the market.
BRiCK is a simple and versatile Utility.  By combining Experts, Indicators and utilities like the Lego block, various trading styles can be realized. "BetByTrade" is a utility to automatically add / close positions when trading. If you open the position in the trade pool, if the calculation result of the betting method exceeds the initial lot, the utility will order additional. If you close the position in the trade pool, if the position that was additionally ordered by the utility remains, it
FREE
A Trading Assistant EA that can place order at user's desired open, stop loss, and take profit prices with automatically calculated lot size based on user's risk per trade . $30 for the next 50 downloaders, next price: $45 Try it out on demo account for free:   Download Demo Features: Smart Place Order : Automatically determine the Type of Order (Market/Stop/Limit & Buy/Sell) to be placed based on Open, and Stop Loss Price input, then execute it immediately Risk Manager : Set your risk of lo
Moon Phase
Sergio D. Rocha
5 (1)
Gann and other analyst had found a curious correlations between moon phases and change in trends, this is an excellent indicator to test those relation and use what you find useful. It's very simplistic, can calculate the moon phases using the average moon cycle duration of 29 days 12 hours 44 minutes since the 1970 first full moon registered at January 22nd. You can also place a known full moon's date, to start the count since the daily opening of that date. In its window will plot a vertical l
Description A colored universal multicurrency/multi-symbol indicator  MACD Histo Smart  (MACD histogram) based on double or triple moving average .  Comparing to the standard MACD Histo this indicator is more sensitive to what allows generating advance signals. he indicator may be used with any broker, irrespective of the name of the financial instrument since it is necessary to manually enter the name as an input parameter. If you enter a non-existent or incorrect name of a financial instrument
Fibonacci Magic Pivot Levels The  Fibonacci Magic Pivot Levels  is a  powerful yet easy to use indicator . It   continuously monitor s intra-day  price action  and uses complex algorithms to calculate and detect key support, resistance and pivot levels, using the D1 timeframe as a filter.  The    Fibonacci Magic Pivot Levels is optimized for H4, H1, M30, M15, M5 & M1 timeframes and  can be used on ALL Currencies, Indices, Commodities, and Cryptocurrency pairs . Trade with improved confidence an
Smart Trend Line Alert is a unique professional Trend Line, Support Line and Resistance Line Touch and Break out Alert with awesome Alert History feature, designed to help traders easily manage many charts and symbols without staring at the monitor. Features Candle Break Out Alert, Price Touch Alert and Time Line Alert; 1 click for converting any drawn line into an alert line (Trend line and Horizontal line or Trend Line By Angle); Alerts History able to re-open closed charts or re-draw delete
Advanced Currency Strength Indicator The Advanced Divergence Currency Strength Indicator. Not only   it breaks down all 28 forex currency pairs   and calculates the strength of   individual currencies   across   all timeframes , but,   You'll be analyzing the WHOLE forex market in 1 window   (In just 1 minute) . This indicator is very powerful because it   reveals the true movements of the market.  It is highly recommended to  analyze charts knowing the performance of individual currencies or
This Utility is a test for creating objects on the graph . Drag it on any graph and follow the instructions! Any questions about work program send me mail : info@tradingsolution.it In future I will add more information with new version for now it provides account information: AccountNumber AccountName AccountCurrency AccountCompany Server Account Leverage Stop Out level Balance Equity Margin Free Margin
Buffer Scan analyzses your custom indicator buffers with iCustom function on a certain period of history (configurable by the user) and writes buffers’s data to a csv file. The script helps determine buffers’ numbers, through which the indicator transfers any data, for example, the appearance of arrows, a particular color, a certain line and other information.  The utility scans all 512 indicator buffers but it records to a csv file only those of them which have data. If a buffer does not transf
このプロダクトを購入した人は以下も購入しています
Trade Assistant MT4
Evgeniy Kravchenko
4.43 (180)
取引 ごとのリスクの 計算、新規注文 の 簡単 な 設置、部分的 な 決済機能 を 持 つ 注文管理、 7 種類 のトレーリングストップなど 、便利 な 機能 を 備 えています 。 注意、アプリケーションはストラテジーテスターでは機能しません。 Manual, Description, Download demo ライン機能 チャート上にオープニングライン、ストップロス、テイクプロフィットを表示します。この機能により、新規注文を簡単に設定することができ、注文を出す前にその特徴を確認することができます。   リスク計算 リスク計算機能は、設定されたリスクとストップロス注文のサイズを考慮して、新規注文のボリュームを計算します。ストップロスの大きさを自由に設定できると同時に、設定したリスクを守ることができます。 Lot calc ボタン - リスク 計算 を 有効 / 無効 にします 。 Risk フィールドでは 、必要 なリスクの 値 を 0 から 100 までのパーセンテージまたは 預金通貨 で 設定 します 。 設定」 タブで 、 リスク 計算 の 種類 を 選択 します :
価格が一瞬で変わる可能性のある市場では、注文はできるだけ簡単にすべきだと思いますか? Metatraderでは、注文を開くたびに、開始価格を入力し、損失を止めて利益を得るウィンドウと、取引サイズを開く必要があります。金融市場の取引では、初期預金を維持し、それを増やすために資本管理が不可欠です。それで、あなたが注文をしたいとき、あなたはおそらくあなたがどれくらいの大きさの取引を開くべきか疑問に思いますか?この単一の取引であなたの預金の何パーセントを危険にさらすべきですか?この取引からどれだけの利益を得ることができますか?また、リスクに対する利益の比率はどのくらいですか?トレードサイズを設定する前に、トレードサイズがどうあるべきかという質問に対する答えを得るために必要な計算を行います。 これらすべてを自動的に行うツールがあると想像してみてください。チャートを開き、市場分析を行い、エントリーポイント、ディフェンスポイント(ストップロス)、ターゲット(テイクプロフィット)を水平線でマークし、最後にリスクのレベルを定義します。利用可能な資本の%として、このトランザクションで負担することができ、こ
Local Trade Copier EA MT4
Juvenille Emperor Limited
5 (80)
Local Trade Copier EA MT4 による、驚くほど高速な取引コピーを体験してください。1分で簡単にセットアップできるこの取引コピー機は、同じWindowsコンピュータまたはWindows VPS上の複数のMetaTrader端末間で取引をコピーすることができ、0.5秒未満の高速コピースピードを実現します。 初心者であろうとプロのトレーダーであろうと、 Local Trade Copier EA MT4 には、あなたの特定のニーズに合わせてカスタマイズするための幅広いオプションが用意されています。これは、利益の可能性を高めたい人にとって究極のソリューションです。 今すぐ試してみて、これが市場で最も速くて簡単なトレードコピー機である理由を理解してください。 ヒント: デモアカウントで Local Trade Copier EA MT4 デモバージョンをダウンロードして試すことができます: ここ ダウンロードした無料のデモ ファイルを MT4 >> ファイル >> データ フォルダを開く >> MQL4 >> Experts フォルダに貼り付けて、ターミナルを再起動し
Exp COPYLOT CLIENT for MT4
Vladislav Andruschenko
4.7 (61)
MetaTrader4のコピー機を取引します。     それは任意の口座からの外国為替取引、ポジション、注文をコピーします。 それは最高の貿易コピー機の1つです     MT4 - MT4、MT5 - MT4     のために     COPYLOT MT4     バージョン(または     MT4 - MT5  MT5 - MT5     のために     COPYLOT MT5     バージョン)。 MT5のバージョン 完全な説明   +DEMO +PDF 購入する方法 インストールする方法     ログファイルの取得方法     テストと最適化の方法     Expforex のすべての製品 のコピー機 バージョン       MetaTrader 5 ターミナル(   МТ5 - МТ5、МТ4 - МТ5   )-   コピーロットクライアントMT5 独自のコピーアルゴリズムにより、すべての取引がマスターアカウントからクライアントアカウントに正確にコピーされます。 また、動作速度が速いことでも知られています。タフなエラー処理。 強力な機能セット。 プログ
The product will copy all telegram signal to MT4   ( which you are member  ) , also it can work as remote copier.  Easy to set up, copy order instant, can work with almost signal formats, image signal, s upport to translate other language to English Work with all type of channel or group, even channel have "Restrict Saving Content", work with  multi channel, multi MT5 Work as remote copier: with signal have ticket number, it will copy exactly via ticket number. Support to backtest signal. How to
Tired of complex order placement and manual calculations? Trade Dashboard is your solution. With its user-friendly interface, placing orders becomes effortless, by a single click, you can open trades, set stop loss and take profit levels, manage trade lot size, and calculate risk to reward ratios, allowing you to only focus on your strategy. Say goodbye to manual calculations and streamline your trading experience with Trade Dashboard. Download  Demo Version  right now. You can find  Details
TradePanel MT4
Alfiya Fazylova
4.91 (85)
Trade Panel は、多機能の取引アシスタントです。 このアプリケーションには手動取引用の 50 以上の機能が含まれており、ほとんどの取引アクションを自動化できます。 購入する前に、デモ アカウントでデモ バージョンをテストできます。 デモは こちら から。 詳しい手順は こちら をご覧ください。 取引。 ワンクリックで基本的な取引操作を実行できます。 未決の注文とポジションをオープンする 注文のグリッドを開く 未決の注文とポジションを決済する ポジションの反転(買いを閉じて売りをオープンする、または売りを閉じて買いをオープンする) ポジションをロックする(反対のポジションをオープンすることで、売りポジションと買いポジションの量を等しくします) すべてのポジションを部分的に決済します。 すべてのポジションのテイクプロフィットやストップロスを共通のレベルに設定します。 すべてのポジションのストップロスを損益分岐点レベルに設定します。 注文とポジションをオープンする際に、次のことが可能になります。 確立されたリスクに応じて取引量の自動計算を使用します。 ワンクリックで複数の注文を開き
Trade Manager は、リスクを自動的に計算しながら、取引を迅速に開始および終了するのに役立ちます。 過剰取引、復讐取引、感情的な取引を防止する機能が含まれています。 取引は自動的に管理され、アカウントのパフォーマンス指標はグラフで視覚化できます。 これらの機能により、このパネルはすべてのマニュアル トレーダーにとって理想的なものとなり、MetaTrader 4 プラットフォームの強化に役立ちます。多言語サポート。 MT5バージョン  |  ユーザーガイド + デモ Trade Manager はストラテジー テスターでは機能しません。 デモについてはユーザーガイドをご覧ください。 危機管理 % または $ に基づくリスクの自動調整 固定ロットサイズを使用するか、ボリュームとピップに基づいた自動ロットサイズ計算を使用するオプション RR、Pips、または価格を使用した損益分岐点ストップロス設定 トレーリングストップロス設定 目標に達したときにすべての取引を自動的に終了するための 1 日あたりの最大損失 (%)。 過度のドローダウンからアカウントを保護し、オーバートレードを防ぎま
プライスアクションツールキットEAは主にスカルパー向けに設計されていますが、すべての時間枠で使用して、ストップレベルに基づいて正しく計算されたロットサイズで市場に迅速に参入できます。注文)そして市場が動くにつれてストップを調整して利益を上げます。 使用するすべての機能、設定、およびベストプラクティス戦略の完全なリストについては、ここをクリックしてください:https:// www.mql5.com/en/blogs/post/748072 リスクベースのエントリ クイックオーダーボタンを使用すると、アカウントのリスクの割合に基づいてポジションに移動できます。選択したリスクとストップロスまでの距離に基づいて、ロットサイズが自動的に計算されます。そのため、ブローカーが0.01ロットのサイズ設定を使用できることを確認する必要があります。0.10または1.00のロット増分を使用するように強制された場合、ブローカーは機能しません。 高速取引実行ボタン チャート上にクイックトレード実行ボタンを配置し、トレードを即座に自動的に開いたり、閉じたり、調整したりします。通常のエントリーボタン
あなたがメンバーである任意のチャンネル(プライベートおよび制限されたチャンネルを含む)からのシグナルを、直接あなたのMT4にコピーします。 このツールは、ユーザーを念頭に置いて設計されており、取引を管理および監視するために必要な多くの機能を提供しています。 この製品は、使いやすく視覚的に魅力的なグラフィカルインターフェースで提供されています。設定をカスタマイズして、数分で製品を使用開始できます! ユーザーガイド + デモ  | MT5版 | Discord版 デモを試したい場合は、ユーザーガイドを参照してください。 Telegram To MT5レシーバーは、ストラテジーテスターでは機能しません! Telegram To MT4の特長 一度に複数のチャンネルからシグナルをコピー プライベートおよび制限されたチャンネルからシグナルをコピー BotトークンやチャットIDは不要です(必要な場合は引き続き使用できます) リスク%または固定ロットを使用して取引 特定のシンボルを除外 すべてのシグナルをコピーするか、コピーするシグナルをカスタマイズするかを選択 すべてのシグナルを認識する
Grid Manual MT4
Alfiya Fazylova
4.72 (18)
「Grid Manual」は、注文のグリッドを操作するための取引パネルです。 ユーティリティはユニバーサルで、柔軟な設定と直感的なインターフェイスを備えています。 それは、損失を平均化する方向だけでなく、利益を増やす方向でも注文のグリッドで機能します。 トレーダーは注文のグリッドを作成して維持する必要はありません。 すべてが「Grid Manual」によって行われます。 注文を開くだけで十分であり、「Grid Manual」は注文のグリッドを自動的に作成し、非常に閉じるまでそれに付随します。 完全な説明とデモバージョン ここ。 ユーティリティの主な機能と機能 ユーティリティは、モバイル端末から開かれた注文を含め、あらゆる方法で開かれた注文を処理します。 「制限」と「停止」の2種類のグリッドで機能します。 グリッド間隔の計算には、固定と動的(ATRインジケーターに基づく)の2つの方法で機能します。 オープンオーダーグリッドの設定を変更できます。 チャート上の各注文グリッドの損益分岐点を表示します。 各注文グリッドの利益率を表示します。 ワンクリックでグリッドから収益性の高い注文を閉じるこ
Trade copier MT4
Alfiya Fazylova
4.52 (29)
Trade Copierは、取引口座間の取引をコピーして同期するように設計された専門的なユーティリティです。 コピーは、同じコンピューターまたはvps にインストールされている、サプライヤーのアカウント/端末から受信者のアカウント/端末に行われます。 購入する前に、デモ アカウントでデモ バージョンをテストできます。 デモ版 こちら 。 詳細な説明は こちら 。 主な機能と利点: MT5ネッティングアカウントを含む、MT4> MT4、MT4> MT5、MT5> MT4のコピーをサポートします。 高いコピー速度(0.5秒未満)。 ベンダーモードと受信者モードは同じ製品内に実装されています。 チャートから直接リアルタイムでコピーを制御できる、簡単で直感的なインターフェイス。 接続が切断されたり、端末が再起動されたりしても、設定と位置が失われることはありません。 コピーするシンボルを選択できます。また、受信者のシンボルを置き換えることもできます(例:EURUSD> USDJPY)。 バックコピーをサポートします。 特定の注文のみのコピーを有効にする機能。 取引開始価格の最大差と最大遅延時間を
あなたの外国為替ポートフォリオを管理してください。あなたが立っている場所、何が働いているのか、そして何があなたに痛みを引き起こしているのかを即座に見てください! ここで利用可能なMT5バージョン:https:// www.mql5.com/en/market/product/58658 Trade Managerダッシュボードは、外国為替市場での現在の各ポジションが一目でわかるように設計されており、リスク管理と通貨へのエクスポージャーを理解しやすくします。 複数のポジションで徐々に市場に参入するトレーダー、またはそれらのトレーディンググリッドとバスケット戦略にとって、これは重要な情報です。ターミナル内の複数の位置を監視することは、管理が難しいことがよくあります。 不十分なリスクの活用と使用:報酬は、新しいトレーダーや一部の経験豊富なトレーダーが直面する主要な問題です。トレードマネージャーは、各通貨へのエクスポージャーを個別に示し、一度に両方向に取引しないようにします。 特徴: オープントレード-通貨ペアでソートされた現在のオープントレードをすべて表示します。ペアだけでなく
MT4 to Discord Signal Provider は、Discord へ直接トレーディングシグナルを送信するために設計された、使いやすく完全にカスタマイズ可能なユーティリティです。このツールは、あなたのトレーディングアカウントを効率的なシグナルプロバイダーに変えます。 スタイルに合わせてメッセージフォーマットをカスタマイズ!利便性を考え、事前にデザインされたテンプレートから選択し、メッセージのどの要素を含めるか除外するかを選択できます。 [ デモ ] [ マニュアル ] [ MT5 バージョン ] [ Telegram バージョン ] セットアップ 簡単なセットアップのために、私たちの詳細な ユーザーガイド に従ってください。 Discord API の事前知識は必要ありません。必要なツールはすべて提供されます。 主な特徴 購読者の更新のための注文詳細をカスタマイズ。 ブロンズ、シルバー、ゴールドなど、各レベルで異なるシグナルアクセスを提供する階層的サブスクリプションモデルを実装。 注文が実行されたチャートのスクリーンショットを添付。 これらのスクリーンショットに表
VirtualTradePad mt4 Extra
Vladislav Andruschenko
4.88 (57)
ワンクリックで取引できるトレーディングパネル。ポジションと注文の操作!チャートまたはキーボードから取引。 手動取引用の取引パネル。チャート(チャートウィンドウ)またはキーボードから取引できます。開閉、リバース、ロックポジションと注文を処理する МetaТrader4のメインオーダーのトレーディングコントロールパネル:売買、売却、売却、売却、売却、閉じる、削除、修正、トレーリングストップ、ストップロス、takeproft MT5のバージョン 完全な説明   +DEMO +PDF 購入する方法 インストールする方法     ログファイルの取得方法     テストと最適化の方法     Expforex のすべての製品 シンボルウィンドウからの取引とキーボードからの取引! あなたはMetaTrader 4ターミナル - バーチャルコントロールパネルVirtualTradePadのためのユニークなプラグインを持っています。 Description on English 注意!  ストラテジーテスターの 取引方法を学びたい場合は、無料の TesterPad ユーティリティをチェック
Summer 40% discount ($149 -> $88) Everything for chart Technical Analysis indicator mt4 in one tool Draw your supply demand zone with rectangle and support resistance with trendline and get alerts to mobile phone or email alert -  Risk reward indicator Video tutorials, manuals, DEMO download   here .  Find contacts on my   profile . 1.   Extended rectangles and trendlines Object will be extended to the right edge of the chart when price will draw new candles on chart. This is rectangle extend
The top-selling EAs on the market cost a lot and one day they are suddenly gone. This is because one strategy will not work in the forex market all the time. Our product is unique from all others in the MQL Marketplace because our EA comes with 34+ built-in indicators that allow adding more strategies every time.  You build your strategy and keep updating it. If one strategy does not work, simply build another all using only one EA. This is All-In-One EA in this market place. You can use as trad
DrawDown Limiter MT4
Haidar, Lionel Haj Ali
5 (8)
Drawdown Limiter EA You are in the right place if you were searching for Drawdown control, Drawdown limiter, Balance protection, Equity Protection or Daily Drawdown Limit related to Prop Firm, FTMO, or Funded account trading, or if you want to protect your trading account. Have you suffered from controlling your drawdown when trading funded accounts? This EA is meant for you. Prop firms usually set a rule called “Trader Daily Drawdown”, and if it is not respected, you are disqualified.  I am an
Mentfx Mmanage
Anton Jere Calmes
5 (15)
The added video will show you the full functionality, effectiveness, and simplicity of this trade manager. Drag and Drop Trade Manager. Draw your entry and have the tool calculate the rest. Advanced targeting and close portions of a trade directly available in tool (manage trades while you sleep). Market order or limit order on either side with factored spread. Just draw the entry, the tool does the rest. Hotkey setup to make it simple. Draw where you want to enter, and the stop loss, the tool c
This tool will allow you to export MetaTrader indicators data (Buffers) for any financial instrument present in your MetaTrader 4. You can download multiple Symbols and Timeframes in the same csv file. Also, you can schedule the frequency of download (every minute, 5 minutes, 60 minutes, etc.). No need to open a lot of charts in order to get the last data, the tool will download the data directly. The CSV File will be stored in the folder:   \MQL4\Files . How it works Report Tab : Select
多機能ツール 搭載機能: ロット計算機、プライスアクション、リスク/リワードレシオ、トレードマネージャー、需要供給ゾーンなどをはじめ65以上の機能。 バージョ:デモ版   |   ユーザーマニュアル   |    MT5版 このユーティリティはストラテジー テスターでは機能しません。 ここからデモ バージョンをダウンロードして製品をテストできます。 ご不明な点や改善提案、バグの発見などございましたら、 連絡してください 。 取引プロセスを簡素化、高速化、自動化します。このダッシュボードで標準端末機能を拡張します 1. 新しい取引を開始します : ロット / リスク / RR の計算 1. Lot計算機(リスクサイズに基づく取引量計算 2. リスク計算機(ロットサイズに基づくリスク量) 3. リスク/リワードレシオ (R/R) 4. 注文のアクティベーション トリガー + Buy StopLimit / Sell StopLimit: MT4でも可  5. 仮想 SL / TP レベル (隠しSL、TP: ブローカーには見えない) 6.  Smart SL / エントリー レ
The most advanced news filter and drawdown limiter on MQL market NEW: Take a Break can be backtested against your account history! Check the " What's new " tab for details. Take a Break has evolved from a once simple news filter to a full-fledged account protection tool. It pauses any other EA during potentially unfavorable market conditions and will continue trading when the noise is over. Typical use cases: Stop trading during news/high volatility (+ close my trades before). Stop trading when
この製品は、ニュースタイム中にすべてのエキスパートアドバイザーと手動チャートをフィルタリングするため、急激な価格変動によるマニュアルトレードのセットアップの破壊や他のエキスパートアドバイザーによって入力された取引について心配する必要はありません。この製品には、ニュースのリリース前にオープンポジションとペンディングオーダーを処理できる完全な注文管理システムも付属しています。 The News Filter  を購入すると、将来のエキスパートアドバイザーのためにビルトインのニュースフィルターに頼る必要はなく、今後はすべてのエキスパートアドバイザーをここからフィルタリングできます。 ニュース選択 ニュースソースは、Forex Factoryの経済カレンダーから取得されます。 USD、EUR、GBP、JPY、AUD、CAD、CHF、NZD、CNYなど、任意の通貨数に基づいて選択できます。 Non-Farm(NFP)、FOMC、CPIなどのキーワード識別に基づいて選択することもできます。 影響レベルによってフィルタリングするニュースを選択することができ、低、中、高の影響範囲から選択できます
Manual Trade Panel EA MT4
Juvenille Emperor Limited
5 (4)
手動トレードパネルEAMT4 は、MT4で見つけることができる最も簡単で使いやすいトレードパネルです。追加のウィンドウやパネルを開く必要なしに、すべてのオプションと機能が1つのサーフェスにあります。これは、注文管理、リスク計算、部分閉鎖、アカウント保護ユーティリティのすべてを1つにまとめた、非常に便利なインターフェースです。 Manual Trade Panel EA MT4 を使用することで、従来の手動取引方法よりも何倍も速く正確に取引することができ、取引の決定に集中するためのより多くの時間と明確な心を得ることができます。 アカウントの保存は私たちの最優先事項であるため、 手動取引パネルEA MT4 は、アカウントが利益を得るか停止した後、すべての未決済の取引を閉じ、すべての保留中の注文を削除し、EAが添付されているすべてのターミナルチャートを閉じることができる優れたアカウント保護ユーティリティでもあります損失の公平性に達しました。これは、利益条件で非常に便利であり、エクイティが希望のストップロスレベルを下回ったときに、取引口座をさらなる損失から救うことができます。 ヒント
GRID TRADING - Layer Master tool kit is the ultimate, easy to use trading toolkit makes it simple to layer grids of Orders over any entry level. This toolkit will make it simple and fast to Open / Enter and Manage your grid trades on MT4. Every function is simple - but clicking and dragging the order zone - you define an area you want your orders, then you can quickly drag the SL and TP levels to where you want them. Hit one button and your orders are sent!!!  Features: It is capable to send h
TakePropips TradePad Pro
Eric John Pajarillaga Aldana
5 (4)
TakePropips TradePad Pro には、強力なトレード マネージャー、通貨強度メーター、アカウント レポート ツール、リスク管理ツールなどが含まれています。 これは、最も高度な外国為替取引マネージャーおよび取引アシスタントの 1 つです。これは、貿易取引をより効率的に管理したいトレーダーにとって完璧なソリューションです。 ユーザー マニュアルはブログ記事からダウンロードできます:   https://www.mql5.com/en/blogs/post/751180 このトレーディング システムは、ストラテジー テスターでテストできます (ビジュアル モードを有効にします)。ライブ チャートでテストしたい場合は、7 日間の試用版を入手するようにメッセージを送ることもできます。 詳細については、説明の下にあるビデオ チュートリアルも利用できます。 ご不明な点やサポートが必要な場合は、お気軽にお問い合わせください。喜んでお手伝いさせていただきます。 TradePad Pro は、すべての外国為替ペア、金属、コモディティ、指数、および仮想通貨で動作します。 主な特徴
Auto Trade Copier is designed to copy trades to multiple MT4, MT5 and cTrader accounts/terminals with 100% accuracy. The provider and receiver accounts must be on the same PC/VPS. With this tool, you can copy trades to receiver accounts on the same PC/VPS. All trading actions will be copied from provider to receiver perfectly. This version can be used on MT4 accounts only. For MT5 accounts, you must use Auto Trade Copier for MT5 . Reference: - For MT4 receiver, please download Trade Receiver Fre
Eezeorder 2
Tawanda Tinarwo
5 (2)
NEW VERSION!  NB: IF YOU ARE USING A VERY HIGH RESOLUTION MACHINE AND THE EA DISPLAY LOOKS TOO SMALL, CONTACT ME SO I CAN HELP YOU. Open Multiple Trades on MT4 in 1 click at one price. Enter the Lot size Specify the number of trades you want to open Choose whether you want TP SL or Trailing Stop Once you are done, click Buy or Sell Open Multiple Pending Orders on MT4 in 1 click at one price. Enter the Lot size Specify the gap from the current price, where you want to place the pending order Spe
Forex Market View Dashboard and CSM
Opengates Success International
5 (1)
FFXMV Dashboard + CSM is a custom indicator combined with Currency Strength Meter . It is created to give the Traders a full view of what is going on in the market. It uses a real time data to access the market and display every bit of information needed to make a successful trading. Before attaching this Indicator to your window chart, go to your MT4's Market Watch panel and HIDE all the Currency pairs you don't need or trade and leave the rest there. The reason is that FFMV Dashboard will DISP
利益追跡機能により、MetaTrader 4で総利益/損失に達した時にポジションをクローズします。 仮想ストップ(個別注文) を有効にできます。 買いと売りのポジションを別々に計算してクローズ(別々の買い/売り) します。 すべてのシンボルまたは現在のシンボルのみをクローズして計算(すべてのシンボル) します。 利益追跡(トレーリング・プロフィット) を有効にします。 預金通貨、ポイント、残高の%で総利益または損失をクローズします。 このアプリケーションは、他のEAと一緒に、または手動取引と組み合わせて、任意のアカウントで使用するために設計されています。 MT5 のバージョン 完全な説明 +DEMO +PDF 購入する方法 インストールする方法 ログファイルの取得方法 テストと最適化の方法 Expforex のすべての製品 取引ペアの全てまたは一部の合計バランスが設定された値以上になった時点で、すべてのポジションがクローズされ、注文が削除されます。 このバージョンは、指定された利益レベルでポジションをクローズできるだけでなく、より良い結果を得るために利益を追跡することも可能です。 C
作者のその他のプロダクト
The indicator is an inter-week hourly filter. When executing trading operations, the indicator allows considering time features of each trading session. Permissive and restrictive filter intervals are set in string form. The used format is [first day]-[last day]:[first hour]-[last hour]. See the screenshots for examples. Parameters: Good Time for trade - intervals when trading is allowed. Bad Time for trade - intervals when trading is forbidden. time filter shift (hours) - hourly shift. percent
Ticks
Andrej Nikitin
3 (1)
A simple tick indicator of Bid and Ask prices. The period separator (1 minute) is displayed as a histogram. Parameters Show Bid Line - show/hide the Bid line; Show Ask Line - show/hide the Ask line; Show Labels - show/hide the last price values.
FREE
Ticks Bars
Andrej Nikitin
3 (1)
This tick indicator draws synthetic bars/candlesticks that contain a definite number of ticks. Parameters: option prices - price option. It can be Bid, Ask or (Ask+Bid)/2. the number of ticks to identify Bar - number of ticks that form OHLC. price levels count - number of displayed price levels (no levels are displayed if set to 0 or a lower value). calculated bar  - number of bars on the chart. Buffer indexes: 0 - OPEN, 1 - HIGH, 2 - LOW, 3 - CLOSE.
FREE
The indicator draws two simple moving averages using High and Low prices. The MA_High line is displayed when the moving average is directed downwards. It can be used for setting a stop order for a sell position. The MA_Low line is displayed when the moving average is directed upwards. It can be used for setting a stop order for a buy position. The indicator is used in the TrailingStop Expert Advisor. Parameters Period - period of calculation of the moving average. Deviation - rate of convergence
FREE
Tick
Andrej Nikitin
4.5 (2)
A simple tick indicator of Bid and Ask prices. The period separator (1 minute) is displayed as a histogram. Parameters Price_levels_count - number of price levels to be displayed. Bar_under_calculation - number of bars of the indicator to be displayed on the chart.
FREE
The Relative Strength Index indicator drawn using a tick chart. After launching it, wait for enough ticks to come. Parameters: RSI Period - period of averaging. overbuying level - overbought level. overselling level - oversold level. calculated bar - number of bars on the chart for the indicator calculation. The following parameters are intended for adjusting the weight of RSI signals (from 0 to 100). You can find their description in the Signals of the Oscillator Relative Strength Index section
The Envelopes indicator drawn using a tick chart. After launching it, wait for enough ticks to come. Parameters: Averaging period - period of averaging. Smoothing type - type of smoothing. Can have any values of the enumeration ENUM_MA_METHOD . Option prices - price to be used. Can be Ask, Bid or (Ask+Bid)/2. Deviation of boundaries from the midline (in percents) - deviation from the main line in percentage terms. Price levels count - number of displayed price levels (no levels are displayed if
The Stochastic Oscillator indicator is drawn on the tick price chart. After launching it, wait for enough ticks to come. Parameters: K period - number of single periods used for calculation of the stochastic oscillator; D period - number of single periods used for calculation of the %K Moving Average line; Slowing - period of slowing %K; Calculated bar - number of bars in the chart for calculation of the indicator. The following parameters are intended for adjusting the weight of signals of the
The Moving Average Convergence/Divergence(MACD) indicator drawn using a tick chart. After launching it, wait for enough ticks to come. Parameters: Fast EMA period - indicator drawn using a tick chart. Slow EMA period - slow period of averaging. Signal SMA period - period of averaging of the signal line. calculated bar - number of bars on the chart for the indicator calculation. The following parameters are intended for adjusting the weight of MACD signals (from 0 to 100). You can find their desc
The Bollinger Bands indicator drawn using a tick chart. After launching it, wait for enough ticks to come. Parameters: Period - period of averaging. Deviation - deviation from the main line. Price levels count - number of displayed price levels (no levels are displayed if set to 0). Bar under calculation - number of bars on the chart for the indicator calculation. Buffer indexes: 0 - BASE_LINE, 1 - UPPER_BAND, 2 - LOWER_BAND, 3 - BID, 4 - ASK.
The Moving Average of Oscillator(OsMA) indicator drawn using a tick chart. After launching it, wait for enough ticks to come. Parameters: Fast EMA period - fast period of averaging. Slow EMA period - slow period of averaging. Signal SMA period - period of averaging of the signal line. calculated bar - number of bars for the indicator calculation.
The Commodity Channel Index(CCI) indicator drawn using a tick chart. After launching it, wait for enough ticks to come. Parameters: period - number of single periods used for the indicator calculation. calculated bar - number of bars for the indicator calculation. The following parameters are intended for adjusting the weight of CCI signals (from 0 to 100). You can find their description in the Signals of the Commodity Channel Index section of MQL5 Reference. The oscillator has required directio
The Average Directional Movement Index indicator drawn using a tick chart. After launching it, wait for enough ticks to come. Parameters: Period - period of averaging. Сalculated bar - number of bars on the chart for the indicator calculation. Buffer indexes: 0 - MAIN_LINE, 1 - PLUSDI_LINE, 2 - MINUSDI_LINE.
The Standard Deviation (StdDev) indicator drawn using a tick chart. After launching it, wait for enough ticks to come. Parameters: Period - period of averaging. Method - method of averaging. calculated bar - number of bars for the indicator calculation.
The Momentum indicator drawn using a tick chart. After launching it, wait for enough ticks to come. Parameters: period - period of the indicator calculation. levels count - number of displayed levels (no levels are displayed if set to 0) calculated bar - number of bars for the indicator calculation.
The Bulls Power indicator drawn using a tick chart. After launching it, wait for enough ticks to come. Parameters: Period - period of averaging. The number of ticks to identify high/low - number of single ticks for determining high/low. Calculated bar - number of bars for the indicator calculation. The following parameters are intended for adjusting the weight of Bulls Power signals (from 0 to 100). You can find their description in the Signals of the Bulls Power oscillator section of MQL5 Refer
The  Bears Power indicator drawn using a tick chart. After launching it, wait for enough ticks to come. Parameters: Period - period of averaging. The number of ticks to identify high/low - number of single ticks for determining high/low. Calculated bar - number of bars for the indicator calculation. The following parameters are intended for adjusting the weight of Bears Power signals (from 0 to 100). You can find their description in the Signals of the Bears Power oscillator section of MQL5 Refe
The  Average True Range (ATR)  indicator drawn using a tick chart. After launching it, wait for enough ticks to come. Parameters: ATR Period  - number of single periods used for the indicator calculation. The number of ticks to identify Bar  - number of single ticks that form OHLC. Price levels count  - number of displayed price levels (no levels are displayed if set to 0 or a lower value). price mode  - choice of prices under calculation (can be bid, ask or average). Сalculated bar  - number of
The  Williams' Percent Range (%R)  indicator drawn using a tick chart. After launching it, wait for enough ticks to come. Parameters: WPR Period  - period of the indicator. Overbuying level  - overbought level. Overselling level  - oversold level. price mode  - choice of prices under calculation (can be bid, ask or average). Сalculated bar  - number of bars for the indicator calculation. The following parameters are intended for adjusting the weight of WPR signals (from 0 to 100). You can find t
The  Price Channel  indicator drawn using a tick chart. After launching it, wait for enough ticks to come. Parameters: Period  - period for determining the channel boundaries. Price levels count  - number of displayed price levels (no levels are displayed if set to 0). price mode  - choice of prices under calculation (can be bid, ask or average). Bar under calculation  - number of bars on the chart for the indicator calculation. Buffer indexes: 0 - Channel upper, 1 - Channel lower, 2 - Channel m
Description: Abigail is a medium-term trading system making profit during the price rollback. The Expert Advisor has been optimized for working on EURUSD. However, it can successfully work with other currency pairs as well. You can examine the Expert Advisor's trading statistics for different brokers and symbols at MetaTrader 4 and MetaTrader 5 Trading Signals sections. Parameters: Risk management: enter volume - market entry volume. If the value is greater than 0 - number of lots, if less than
TimeFilter indicator allows you to visually select bit masks (GoodHourOfDay, BadHoursOfDay, GoodDayOfWeek, BadDaysOfWeek) for the  Intraday Time Filter  module of trading signals of the Standard Library. The use of time filters allows you to take into account the particulars of each trading session in performing trading operations.
TrailingStop 4
Andrej Nikitin
4.83 (6)
The Expert Advisor modifies the Stop Loss order position opened for the instrument of the current chart based on indicator values. Uses indicators Parabolic SAR ,  NRTR (Nick Rypock Trailing Reverse) ,  Moving Average  or linear regression channel. Switchable modes: Trailing stop only when in profit; Trailing stop only following the price; On every teak or on formed bars; Trailing for each order separately or for a total position. Has an option of "hidden stop", also you can exclude individual
The script creates account summary report in a separate window. The report can be created for all deals and for deals on selected financial instruments. It is possible to specify a time interval of calculation and save report to an htm file. Script inputs report starting date - initial report generation date. symbols selection for report - select a method of choosing tools for a report generation. allSymbol - report is generated for deals performed on all symbols. onlyCurrentSymbol - report
The EA performs trade operations of closing position groups. Positions are grouped by type. It is possible to select orders by the profit (loss) value. It is possible to form the closure groups manually. You can set a value for automatic closure of a positions group after reaching a certain profit/loss level or price level. The additional functions of the EA are called using the hot keys: SHIFT+A - show/hide Auto exit options. SHIFT+S - show/hide Settings panel. SHIFT+V - sound ON/OFF. SHIFT+I -
The Expert Advisor for increasing (or opening) market positions. Allows specifying the desired risk, target and searching for the best open price and trade volume. Configurable Parameters: lots - directly the volume of the position increase. % equity - the amount of growth as a percentage of the amount of funds. stop loss - directly the level of the stop loss order. loss - the level of the stop loss order depending on the allowable loss. take profit - directly the take profit level of
The Expert Advisor notifies that a price has crossed a line on the chart. It handles two types of lines - horizontal line and a trendline. The number of lines is unlimited. Parameters: prefix of signal line - prefix of object (line) names processed by the indicator. If the parameter is empty, it handles all object types: horizontal lines and trendlines. price Mode - price type (bid or ask). timeout - crossing alert timeout. number of repeats - the limit of crossing alert repeats. number of comme
Tick Advisor is an intraday trading system that tries to profit during the price rollback. Martingale can be enabled, but you should be extremely careful (take profit often and at a proper time!). You can examine the Expert Advisor's trading statistics for different brokers and symbols in the MetaTrader 4 Trading Signals sections. Parameters Risk management: enter volume - a volume for entry If the value is greater than 0 - number of lots, if less than 0 - percentage of available funds, if equ
Description Abuza 4 is an intraday trading system making profit during the price rollback. The Expert Advisor has been optimized for working on EURUSD. However, it can successfully work with other currency pairs as well. Martingale can be enabled, but you should be extremely careful (take profit often and at a proper time!). You can examine the Expert Advisor's trading statistics for different brokers and symbols in the MetaTrader 4 Trading Signals sections. Parameters Risk management: enter vol
フィルタ:
レビューなし
レビューに返信
バージョン 1.35 2022.02.07
minor edits
バージョン 1.34 2018.12.22
Error correction
バージョン 1.33 2018.12.20
The limitation of the reporting period is removed.
バージョン 1.32 2018.02.14
Fixed bugs