• 概要
  • レビュー (8)
  • コメント (17)
  • 最新情報

Beta Bands

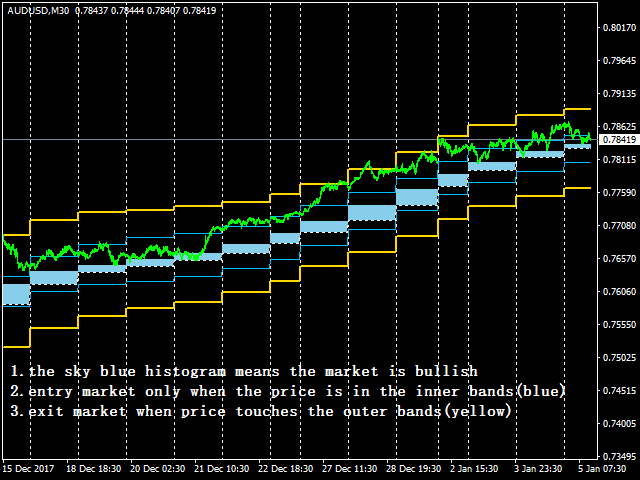
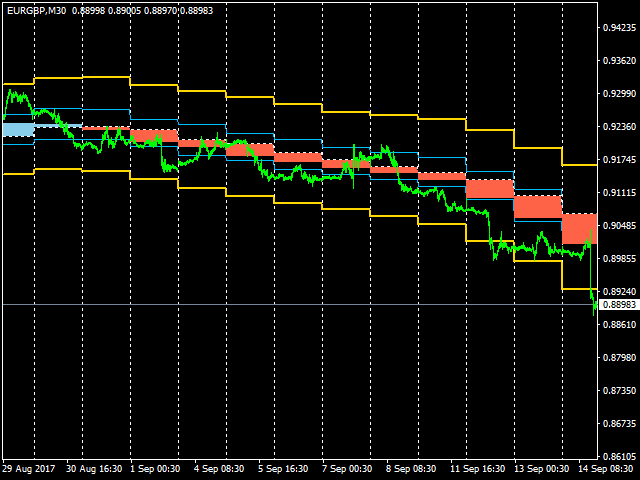
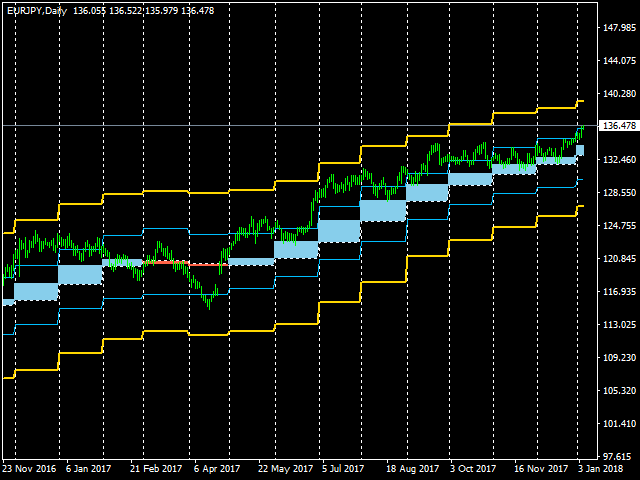
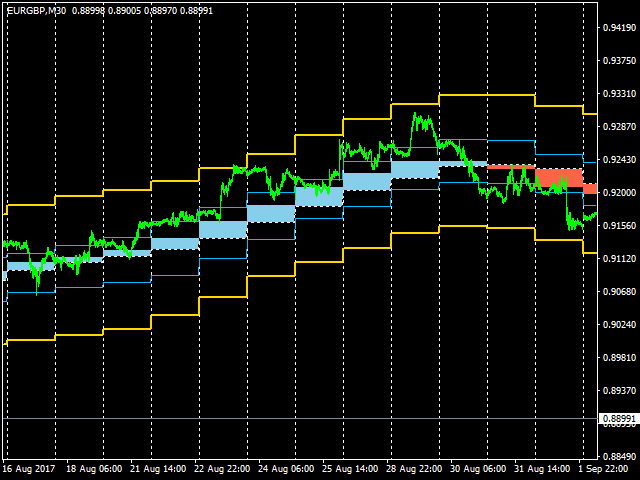
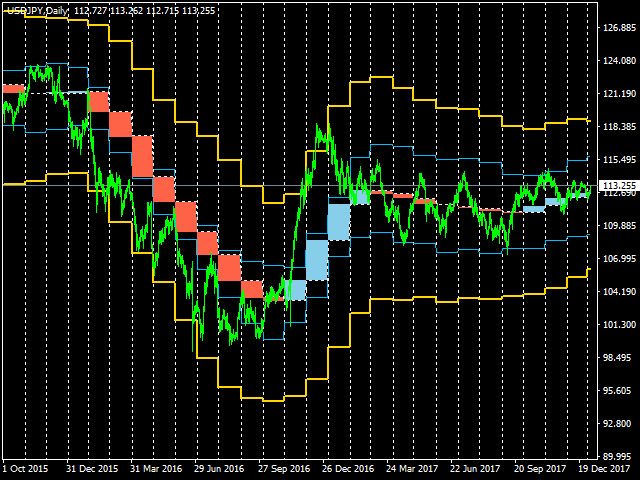
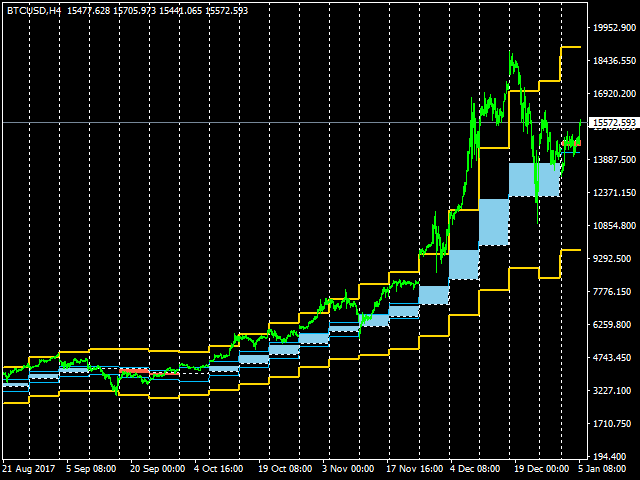
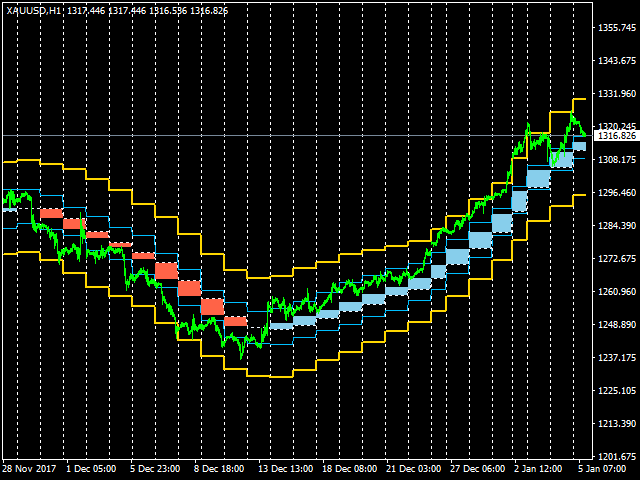
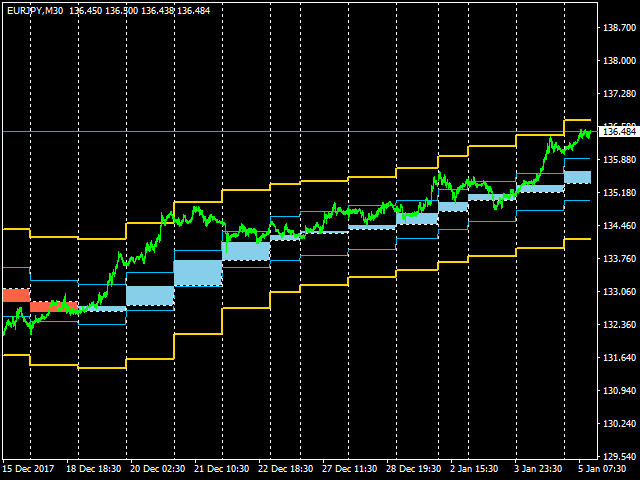
This indicator shows main trend, entry zone and exit zone.

This is a muti-timeframe indicator, so it is always repainting in the current period of the higher timeframe.


Features

  • Colorful Histogram: it indicates the main trend, the tomato means the market is bearish,and the sky blue means the market is bullish.
  • Inner Blue Bands: it is entry zone for entry market, the market is relatively safe for entry.
  • Outer Yellow Bands: it is exit zone for exit market, the market is oversold or overbought.
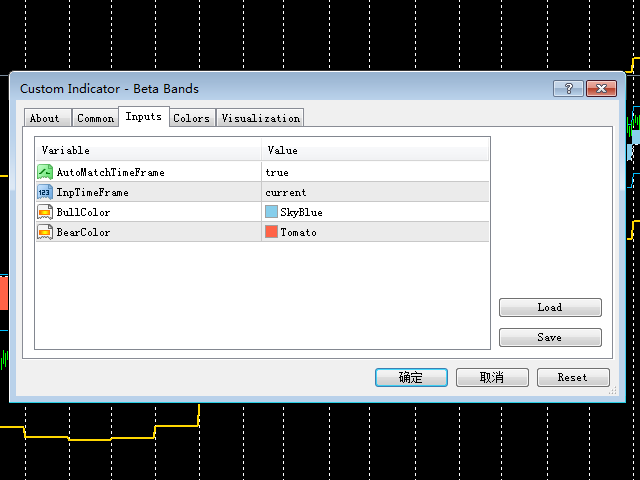

Settings

  • AutoMatchTimeFrame: if true,the indicator will automatically select a higher timeframe
  • InpTimeFrame: input timeframe by users if AutoMatchTimeFrame is false.
  • BullColor: the color of histogram in bullish market (default is sky blue).
  • BearColor: the color of histogram in bearish market (default is tomato).


Usage

Entry the market when the price is in the inner bands. If the price reached outer bands, order should be closed.

The key of trading is to select a proper timeframe. Of course, you may create your strategy based on this indicator.

おすすめのプロダクト
This is a ready-made strategy for binary options! Support/resistance levels are used to form a signal, while a number of built-in indicators are applied to sort out incoming signals. An arrow appears during a signal formation. If the signal is active, then the arrow remains after the close of the bar; if the signal is not strong enough, the arrow disappears. With a small number of signals and a small trading time, you will not need to sit all day at the computer, especially since you can enable
Limitless MT4は、すべての初心者と経験豊富なトレーダーに適したユニバーサルインジケーターです。 すべての通貨ペア、暗号通貨、生の株式で動作します 無制限のMT4-構成済みで、追加の構成は不要 そして今、主なもの なぜ無制限のMT4なのか? 1再描画の完全な欠如 2トレーディングの最高のスペシャリストによる2年間のテスト 3正しい信号の精度が80%を超える 4ニュースリリース中の取引で好調 取引ルール 1買いシグナル-青い上向き矢印の出現 下向きの赤い矢印の外観を販売するシグナル シグナル後の次のローソク足で取引を開始するには2 3テイクプロフィット チャート上 М1-40ピップ М5-50ピップ М15-55-60ピップ 4ストップロスは利益をとる 5誤った信号をフィルタリングするために、 パラボリックSAR-トレンドとのトレードへの参入を除外する移動平均または同様のトレンドインジケーター。 
スキャルピング矢印は再描画されません -チャート上に価格反転ポイントを示し、そのシグナルを再描画しないインジケーター。また、インジケーターは電子メールとプッシュを介してトレーダーにシグナルを送信します。このインジケーターの信号の精度は、M5タイムフレームで約92〜94%、H1タイムフレームで95%以上です。したがって、この指標により、トレーダーは正確に取引を開始し、さらなる価格変動を予測することができます。チャート上の価格反転ポイントは、すべてのトレーダーに対してシンプルでわかりやすい矢印を使用して示されています。絶え間なく動的な市場の変化を考えると、この指標は過去の相場データを収集し、数学モデルを使用して学習することができます。 インジケーターはシグナルを再描画しません。 インジケーターは、M1からD1までの時間枠で機能します 重要! このインジケーターを購入すると、リンク https://www.mql5.com/ru/market/product/69755で最高の自動ボットの1つをギフトとして受け取ることができます 。 。 スキャルピング矢印がインジケーターを再描画しないこと
Impulse fractals indicator - is counter-trend oriented complex market fractal pattern.  Market creates bull/bear impulse, trend starts, fractals on impulsed wave are an agressive pullback signals. Buy arrow is plotted when market is bearish and it's impulse showed up-side fractal, and sell arrow is plotted when market is bullish and it's impulse showed dn-side fractal. Main indicator's adjustable inputs : impulsePeriod - main period of impulse histogram  filterPeriod  - smoothes impulse accordi
Trend surfer is indicator based on volume calculation in combination with algorithm that recognize trend changes . For aditional filtering, user can choose from 3 different oscillators, or can use their combination. Basic idea of indicator is to give signal when current volume is above value defined as Volume MA period*Volume MA multiplier, and trend change algorithm detects start of new trend wave. When all conditions are met and new trend wave is detected, indicator plot arrow on chart. Arrows
Smart Reversal Signal  is a professional indicator for the MetaTrader 4 platform; it has been developed by a group of professional traders. This indicator is designed for Forex and binary options trading. By purchasing this indicator, you will receive: Excellent indicator signals. Free product support. Regular updates. Various notification options: alert, push, emails. You can use it on any financial instrument (Forex, CFD, options) and timeframe. Indicator Parameters Perod - indicator calcula
HeikenashiSmoothing
Rodolfo Leonardo De Morais
Heiken ashi Smoothing in separate window MTF The color of the Heiken-Ashi candles depend on their shadows. The advantage of the Heiken-Ashi chart is that the trend is determined very simply, the upward-facing sails are blue, and the downward-tendency sails are red. For profitable trading it is necessary to use it with the standard candles (make analyzes) and with the other indicators. Indicator Parameters TimeFrame - Graphic time being 0 = Current graph time, 1 = M1, 5 = M5, 15 = M15, 30 = M30
タイトル: ノンリペイント XY トレンドインジケーターの紹介: フォレックスとバイナリオプションで成功するための究極のガイド はじめに: ノンリペイント XY トレンドインジケーターは、複雑で常に変化する金融市場において、トレーダーが情報に基づいた意思決定を行うために設計された革新的な取引ツールです。この高度な MetaTrader 4 (MT4) インジケーターは、リペイントという一般的な問題を排除しながら、驚くほどの精度で価格トレンドを予測するそのユニークな能力により、トレーダーの間で大きな人気を集めています。 インジケーターの理解: ノンリペイント XY トレンドインジケーターを際立たせている重要な機能の一つは、その精度へのこだわりです。過去のシグナルをリペイントし、トレーダーに信頼性の低いデータを残してしまう他の多くのインジケーターとは異なり、このインジケーターは一貫性を保っています。トレーダーは、生成されたシグナルが過去の価格変動を正確に反映していることを知って、安心して取引できます。 XY トレンドインジケーターは、高度なアルゴリズムを使用して価格データを分析し、市場のト
Using the Arrow Effect forex indicator algorithm, you can quickly understand what kind of trend is currently developing in the market. The Elephant indicator accompanies long trends, can be used without restrictions on instruments or timeframes. With this indicator, you can try to predict future values. But the main use of the indicator is to generate buy and sell signals. The indicator tracks the market trend, ignoring sharp market fluctuations and noises around the average price. The indicator
StalkeR Arrow
Abdulkarim Karazon
5 (4)
StalkeR Arrow は、バーオープン/バー内で売買シグナルを与える矢印インジケーターです。このインジケーターは価格行動パターンとフラクタルに基づいています。 このインジケーターは、各買いシグナルと売りシグナルの tp と sl を与えます。tp と sl は各シグナルの上下の線の形式であり、新しいシグナルが形成されるまで延長されます。 このインジケーターには、履歴シグナルの勝敗統計を提供するバックテスト パネル/ダッシュボードがありますが、このインジケーターは再ペイントやバックペイントを行いません。 パラメーター : StalkeR 周期 : 矢印周期、数値が大きいほど信号が少なくなります スプレッド: ポイント単位のスプレッド値を使用して、パネル上の勝敗を計算します。 ストップロス ATR x : atr 乗算における SL 値 Takeprofit ATR x : atr乗算のTP値 ATR 期間 : に基づいて tp と sl を計算するために使用する atr 期間 TP/SL ラインの色と幅 矢印の色と幅 パネル/ダ
Fluctuation Bands
Francisco De A Vilar Enriquez
Shows the price fluctuation bands associated with a moving average. It is extremely accurate, and it's a wonderful visual guide. The indicator consists of 4 bands . The two bands closest to the price form the fluctuation channel , they mark the maximum calculated deviation of the price from the moving average. The outer bands mark the maximum overdeviation of the price with respect to the fluctuation channel, they are overbought or oversold areas. Features.  -The change of periods of the MA is d
BinaryPin
Andrey Spiridonov
3.67 (3)
BinaryPin is an indicator developed and adapted specifically for trading short-term binary options. The indicator's algorithm, before issuing the signal, analyzes many factors, such as market volatility, searches for the PinBar pattern, calculates the probability of success when making a deal. The indicator is set in the usual way. The indicator itself consists of an information window where the name of the trading instrument is displayed, the probability of making a successful transaction, the
FREE
Some informations on the chart with the single attachment. RangeBorder Buy Sell (RBBS) Non Repaint Indicator will provide trend line, buy sell arrows,reversal arrows, range channel, order exit area,high average price line and low average price line.All arrows and lines don't repaint and not lagging. Once candle closed it won't  repaint. Reading Indicator: 1. Small Stars , Indicates oversold and overbought with certain logic and price may reverse when this small star triggers. Useful to identif
Fargo does not change its readings, it is a technical indicator in the Forex market without redrawing. It combines several filters to display market entry arrows on the chart. You can note the accuracy and clarity of the signals of this pointer indicator. When a suitable moment for buying appears, the indicator generates a signal exactly at the moment of its appearance and not below or above the current candle. The arrow will be exactly at the price where the signal appears and will not change
The Swing Levels Support and Resistance Indicator is a robust tool designed for MetaTrader 5 traders (also available for MT4). It aids in identifying crucial market levels where price direction may change by showcasing: Swing High and Swing Lows across all timeframes Previous Highs and Lows for Day, Week, and Month ICT US Midnight level and Yesterday Midnight Level ICT US Preopen 8:30 AM Level Rounded Levels This indicator features a toggle button, enabling you to display or hide these levels o
Manuscript is a time-tested indicator, many tests have been conducted in its use, I will tell all buyers my recommendations on using forex, cryptocurrency or binary options This indicator gives a signal exactly at the close of the candle of the selected period The arrow does not disappear after the signal, you can set up email notifications I recommend using it on the period H1,H4,daily If you are aware of its work, you will be able to trade in a plus In the future I will give you my re
This indicator has a unique support and resistance calculation program, which is a unique trading system. Index characteristics Imagine if you can accurately determine the important trading support and resistance areas and points in advance, how will your trading improve? Based on a unique calculation method, the indicator analyzes the trend, analyzes the current support and resistance, and obtains the current important support resistance and single direction, the calculated stop profit and st
ScalperMulti is a multicurrency indicator for professional traders. The indicator shows the complete market situation for the trader. The main advantage of this indicator is that it simultaneously analyzes six major currency pairs on all timeframes from M1 to MN. The indicator analyzes the trend strength. The indicator generates color-coded signals to visualize the market situation: Green - ascending trend. Red - descending trend. Yellow - trend is not defined. The indicator is excellent for sca
これは 3Bar_Play として知られるプライス アクション ベースの戦略であり、3Bar ローソク足パターンの形成に基づいています。買い/売りシグナルの矢印をポップアップする前に、フィルターと確認のために追加のインジケーターが追加されます。上昇トレンド、下降トレンド、または横ばい市場のいずれかで取引できます。 追加された指標は次のとおりです。 確率的 - モメンタム フィッシャー - トレンド ATR - シグナル矢印のベースでのストップロスの配置も明確に定義するボラティリティ。 報酬に対するリスクは、1:1 から 1:4 のいずれかになります。 買い - 2 つの弱気バーと 1 つの強気バーの後に買いシグナルがポップアップする場合。 売り - 2 つの強気バーと 1 つの弱気バーの後に売りシグナルがポップアップする場合。 追加機能 - チャート上のシグナルをオン/オフするためのトグル ボタン。 非常に使いやすいインジケーターで、すべての市場に対応しています。 注意 インジケーターが表示されない場合は、私に連絡してカスタム インジケーター (Fisher) をインストールする必要
Super Trend Double Pro - Includes the classic SuperTrend indicator x2 - Includes two indicators for much better market analysis - Comes with various settings - Comes with a display - Displays statistical win/loss information The "Super Trend Double Pro" indicator provides the ability to combine two of the classic SuperTrend indicators into one, displaying two indicators with different settings on the same chart. The indicator comes with many customizable settings as well as a display which
This indicator is the translated version of Anıl ÖZEKŞİ's MOST Indicator, developed on the Matriks Data Terminal, into the MQL4 language. It is a trend-following indicator and quite successful. Its usage will be free and unlimited for a lifetime. You can click on my profile to access the MQL5 version of this indicator. You can also get your programming requests for MQL4 and MQL5 languages done at İpek Bilgisayar with an invoiced service. You can reach İpek Bilgisayar at www.ipekbilgisayar.org .
FREE
This indicator is the translated version of Kıvanç ÖZBİLGİÇ's PMAX Indicator, developed on the Matriks Data Terminal, into the MQL4 language. It is a trend-following indicator and quite successful. Its usage will be free and unlimited for a lifetime. You can click on my profile to access the MQL5 version of this indicator. You can also get your programming requests for MQL4 and MQL5 languages done at İpek Bilgisayar with an invoiced service. You can reach İpek Bilgisayar at www.ipekbilgisayar.or
FREE
The indicator is designed for binary options. It produces a sound alert, after which you should instantly enter the market. The indicator operates based on signals form RSI and CCI, as well as support and resistance levels. When the chart is in overbought and oversold zones, the indicator finds a level in this zone and notifies you using a sound and a message. Indicator Parameters dist - the number of points to generate a signal. Suitable values ​​are from 21 to 50. Filtr_SMA - the filter, use
Binary Options Assistant (BOA) BURN Signals Indicator provides signals based on Ana Trader Binary Options Strategy. Indicators: MACD & Stochastic Stop missing trades, stop jumping from chart to chart looking for trade set-ups and get all the signals on 1 chart! U se any of the BOA Signals Indicator with the  Binary Options Assistant (BOA) Multi Currency Dashboard .  All BOA Signal Indicator settings are adjustable to give you more strategy combinations. The signals can be seen visually and h
This indicator shows the current situation on the cryptocurrencies available for trading, depending on the signal strength specified in the settings. It can be used for determining the expected increase/decrease in the asset price, displayed by the corresponding color, and the signal strength, displayed by a vertical dash near a certain cryptocurrency pair. Indicator Parameters Panel color - color of the indicator panel Long color - cryptocurrency pair uptrend color Short color - cryptocurrency
Candle Binary Scalper - is a technical analysis product for forex and binary options. Includes several technical indicators combined into a trading system. Suitable for manual trading within a trend, for scalping and binary options. Works on all time frames and trading instruments. Recommended Timeframes for trading M15, M30, H1 and H4, M5 and M1 should be used in case of high volatility. There are several types of alerts. How to use the product The optimal settings have already been sel
Arrow Entries II   Arrow entries II indicator Arrow entries  is a tool to help make entry decisions. It draws arrows for buy and sell and is based on 2 Signals and filtered by fast over or under slow Moving Average.  Do not confuse this with my other indicator Arrow Entries. The rules for a signal is different. Arrow Entries II produce less signals than Arrow Entries, but are more precise  Want an EA to do the job for you? Buy it here: https://www.mql5.com/en/market/product/33266 Check out my ot
Xeons
Maryna Shulzhenko
The Xeon indicator was created to display the trend in a visual form. One of the main definitions for monitoring the currency market is trend. A trend is a stable direction of price movement. To find it, the indicator uses calculations designed to smooth out sharp fluctuations that do not affect the overall picture of price movement. The indicator was created for those who value their time and money. A trend can be increasing (bullish trend) or decreasing (bearish trend). In most cases, a t
Binary Options Support Resistance Indicator This indicator is designed for binary options trading and effectively shows retracements from support and resistance levels. Signals appear on the current candle. A red arrow pointing downwards indicates a potential selling opportunity, while a blue arrow pointing upwards suggests buying opportunities. All that needs adjustment is the color of the signal arrows. It is recommended to use it on the M1-M5 timeframes as signals are frequent on these timef
AURUS Arrow
Dmitriq Evgenoeviz Ko
Индикатор AURUS Arrow предусматривает возможность выявления различных особенностей и закономерностей в динамике цен, которые не видны невооруженным глазом. AURUS Arrow — индикатор, показывающий стрелки покупки-продажи, которые определенно помогут каждому трейдеру, который не знает как торговать. На основании этой информации, трейдеры могут предположить дальнейшее движение цены и корректировать свои стратегии, соответственно. Буферная стрелка покупки-продажи с сигнальным алертом. Тайм-фре
このプロダクトを購入した人は以下も購入しています
Gann Made Easy は、ミスター・ギャンの理論を使用した取引の最良の原則に基づいた、プロフェッショナルで使いやすい外国為替取引システムです。 W・D・ガン。このインジケーターは、ストップロスとテイクプロフィットレベルを含む正確な買いと売りのシグナルを提供します。 PUSH通知を利用して外出先でも取引可能です。 購入後はご連絡ください!私の取引のヒントと素晴らしいボーナスインジケーターを無料で共有します! おそらく、ギャンの取引手法についてはすでに何度も聞いたことがあるでしょう。通常、ギャンの理論は初心者のトレーダーだけでなく、すでにある程度の取引経験がある人にとっても非常に複雑なものです。なぜなら、ギャンの取引手法は理論的にはそれほど簡単に適用できるものではないからです。私はその知識を磨き、最良の原則を私の外国為替インジケーターに組み込むために数年を費やしました。 このインジケーターは非常に簡単に適用できます。必要なのは、それをチャートに添付し、簡単な取引推奨事項に従うだけです。このインジケーターは常に市場分析の仕事を行い、取引の機会を探します。適切なエントリーポイントを検出
Reversal First Impulse levels (RFI)    INSTRUCTIONS        RUS       -       ENG              R ecommended to use with an indicator   -   TREND PRO -  Version MT5 A key element in trading is zones or levels from which decisions to buy or sell a trading instrument are made. Despite attempts by major players to conceal their presence in the market, they inevitably leave traces. Our task was to learn how to identify these traces and interpret them correctly. Main functions: Displaying active zones
まず第一に、この取引インジケーターは再描画されず、再描画されず、遅延しないことを強調する価値があります。これにより、手動取引とロボット取引の両方に理想的なものになります。 ユーザーマニュアル:設定、入力、戦略。 アトミックアナリストは、価格の強さとモメンタムを利用して市場でより良いエッジを見つけるためのPA価格アクションインジケーターです。ノイズや誤ったシグナルを除去し、取引ポテンシャルを高めるための高度なフィルターを備えています。複雑なインジケーターの複数のレイヤーを使用して、アトミックアナリストはチャートをスキャンし、複雑な数学的計算をシンプルなシグナルと色に変換します。これにより、どのような初心者トレーダーでも理解して使用し、一貫した取引の決定を行うことができます。 「アトミックアナリスト」は、新規および経験豊富なトレーダー向けにカスタマイズされた包括的な取引ソリューションです。プレミアムインジケーターとトップノッチの機能を1つの取引戦略に組み合わせ、すべてのタイプのトレーダーにとって汎用性のある選択肢にします。 デイリートレーディングとスキャルピング戦略:高
現在26%オフ 初心者やエキスパートトレーダーに最適なソリューション! このインジケーターは、独自の機能と新しい計算式を取り入れた、ユニークで高品質、かつ手頃な価格のトレーディングツールです。たった1枚のチャートで28の為替ペアの通貨強度を読み取ることができます。新しいトレンドやスキャルピングチャンスの引き金となるポイントを正確に特定することができるので、あなたのトレードがどのように改善されるか想像してみてください。 ユーザーマニュアルはこちら  https://www.mql5.com/en/blogs/post/697384 これが最初の1本、オリジナルだ! 価値のないクローンを買わないでください。 特別な サブウィンドウの矢印で強い通貨の勢いを表示 GAPがあなたのトレードを導く! 基準通貨や気配値が売られすぎ・買われすぎのゾーン(外相フィボナッチレベル)にあるとき、個別チャートのメインウィンドウに警告表示。 通貨がレンジの外側から反落した場合、プルバック/リバーサルのアラート。 クロスパターンの特別なアラート 複数の時間枠を選択可能で、トレンドを素早く
Trend Punch
Mohamed Hassan
5 (14)
Manual guide:   Click here WEEKEND SALE PROMO:   $65 ONLY!  -- Next price is  $120 .  This indicator is unstoppable when combined with our other indicator called  Support & Resistance . After purchase, send us a message and you will get it   for  FREE as a BONUS! I like to use Trend Punch on XAUUSD on the M1 timeframe & higher ones!  Introducing Trend Punch , the revolutionary forex trend indicator that will transform the way you trade! Trend Punch is uniquely designed to provide
An exclusive indicator that utilizes an innovative algorithm to swiftly and accurately determine the market trend. The indicator automatically calculates opening, closing, and profit levels, providing detailed trading statistics. With these features, you can choose the most appropriate trading instrument for the current market conditions. Additionally, you can easily integrate your own arrow indicators into Scalper Inside Pro to quickly evaluate their statistics and profitability. Scalper Inside
Gold Stuff
Vasiliy Strukov
4.89 (262)
Gold Stuff は、金専用に設計されたトレンド指標であり、あらゆる金融商品にも使用できます。 インジケーターは再描画せず、遅れません。 推奨時間枠 H1. それインディケータでフルオートExpert Advisor EA Gold Stuffが動作します。 あなたは私のプロフィールでそれを見つけることができます. 設定と個人的なボーナスを得るために、購入後すぐに私に連絡してください! トレンド スキャナーの強力なサポートを利用して、無料のインジケーターを入手し、プライバシーを守ります。あーみー!   設定 矢印を描く - オンオフ。 チャートに矢印を描く。 アラート - 可聴アラートのオンオフ。 メール通知 - オンオフ。 電子メール通知。 プチ通知 - オンオフ。 プッシュ通知。 次に、色域を調整します。 Gold Stuff は、金専用に設計されたトレンド指標であり、あらゆる金融商品にも使用できます。 インジケーターは再描画せず、遅れません。 推奨時間枠 H1. それインディケータでフルオートExpert Advisor EA Gold Stuff
TPSpro TRENDPRO  - is a trend indicator that automatically analyzes the market and provides information about the trend and each of its changes, as well as giving signals for entering trades without redrawing! The indicator uses each candle, analyzing them separately. referring to different impulses - up or down impulse. Exact entry points into transactions for currencies, crypto, metals, stocks, indices!  -  Version MT5               DETAILED DESCRIPTION                R ecommended to use with
Legacy of Gann
Pavel Zamoshnikov
4.83 (12)
The indicator very accurately determines the levels of the possible end of the trend and profit fixing. The method of determining levels is based on the ideas of W.D.Gann, using an algorithm developed by his follower Kirill Borovsky. Extremely high reliability of reaching levels (according to K. Borovsky  - 80-90%) Indispensable for any trading strategy – every trader needs to determine the exit point from the market! Precisely determines targets on any timeframes and any instruments (forex, met
ブレーカートレーダーになり、価格が反転すると市場構造からの利益が変化します。 注文ブロックブレーカーインジケーターは、トレンドまたは価格の動きが枯渇に近づいており、逆転の準備ができていることを識別します。通常、反転または大規模なプルバックが発生しようとしているときに発生する市場構造の変化について警告します。 この指標は、ブレイクアウトと価格の勢いを識別する独自の計算を使用します。使い果たされる可能性のあるポイントの近くで新しい高値が形成されるたびに、インディケーターはその高値の作成を担当する最後の注文ブロックを描きます。次に、移動する価格とともに注文ブロックを追跡します。その後、価格が反対方向にシフトし、その注文ブロックを突破すると、新しい市場構造を作成し、トレンドまたは大きな後退の可能性のある反転の開始を警告します。 注文ブロックは、高値/安値が作成される前の最後の反対色のろうそくであり、価格がこれらの重要な領域を下抜けすると、トレンドの短期的ま​​たは長期的な反転の兆候です。 特徴 重要な枯渇点での市場構造の変化を警告します 価格が使い果たされるレベルに近づくと、
Advanced Supply Demand
Bernhard Schweigert
4.92 (313)
現在33%オフ 初心者にもエキスパートトレーダーにも最適なソリューション このインジケーターは独自の機能と新しい公式を多数内蔵しており、ユニークで高品質かつ手頃な取引ツールです。このアップデートでは、2つの時間枠ゾーンを表示できるようになります。より長いTFだけでなく、チャートTFとより長いTF(ネストゾーンを表示)の両方を表示できます。すべてのSupply Demandトレーダーの皆さんのお気に召すはずです。:) 重要情報の公開 Advanced Supply Demandの可能性を最大化するには、 https://www.mql5.com/ja/blogs/post/720245 にアクセスしてください。   エントリーまたはターゲットの正確なトリガーポイントを正確に特定できれば取引がどのように改善されるか想像してみてください。新しい基盤となるアルゴリズムに基づいて構築されているため、買い手と売り手の間の潜在的な不均衡をさらに簡単に特定できます。これは、最も強い需要と供給のゾーンと、過去のパフォーマンス(古いゾーンを表示)がグラフィカルに表現されるためです。これらの機能は、最適
現在20%OFF! 初心者やエキスパートトレーダーのためのベストソリューション! このダッシュボードソフトウェアは、28の通貨ペアで動作しています。それは私達の主要な指標(高度な通貨の強さ28と高度な通貨インパルス)の2に基づいています。それは全体の外国為替市場の大きい概観を与えます。それは、すべての(9)時間枠で28の外国為替ペアのための高度な通貨の強さの値、通貨の動きの速度と信号を示しています。チャート上で1つのインディケータを使用して市場全体を観察し、トレンドやスキャルピングの機会をピンポイントで見つけることができたら、あなたのトレードがどのように改善されるか想像してみてください。 このインディケータには、強い通貨と弱い通貨の識別、潜在的な取引の識別と確認がより簡単になるような機能が搭載されています。このインディケータは、通貨の強さや弱さが増加しているか減少しているか、また、すべての時間枠でどのように機能しているかをグラフィカルに表示します。 新機能として、現在の市場環境の変化に適応するダイナミックなマーケットフィボナッチレベルが追加され、すでに当社のAdvan
FX Volume
Daniel Stein
4.6 (35)
mql5と Telegramの モーニング・ブリーフィングで、詳細とスクリーンショットを含む毎日のマーケット・アップデートをご覧 ください! FX Volumeは、ブローカーの視点から市場のセンチメントをリアルに洞察する、最初で唯一の出来高インジケーターです。 ブローカーのような機関投資家が外国為替市場でどのようなポジションをとっているか、COTレポートよりもはるかに速く、素晴らしい洞察を提供します。 この情報をチャート上で直接見ることは、あなたの取引にとって真のゲームチェンジャーであり、画期的なソリューションです。 以下のようなユニークなマーケットデータ洞察から利益を得てください。 比率は 、通貨のロングポジションとショートポジションの比率をパーセントで表示します。 比率の変化は 、選択した期間内のロング比率とその変化率を表示します。 Volumes Totalは 、通貨の取引量(ロングとショート)の合計をロット単位で表示します。 Volumes Long :全通貨のロングポジションの取引量を表示します。 Volumes(ショート )は、全通貨のショートポジションの取引量を表示
Enigmera
Ivan Stefanov
5 (3)
エニグメラ:市場の中核 https://www.enigmera.com はじめに このインディケータと取引システムは、金融市場に対する驚くべきアプローチです。ENIGMERAは、フラクタルサイクルを使用して、サポートとレジスタンスレベルを正確に計算します。本格的な蓄積局面を示し、方向性と目標を示します。 トレンド中でも調整中でも機能するシステムです。 どのように作動するのか? ENIGMERAは、支持線・抵抗線、目標線、乖離線の3つのラインで構成されています。このシステムは、過去のデータを現在と未来に外挿する典型的な市場指標とは異なり、現在の完全な画像を提供します。支持線上にある場合、それは本当の支持を意味し、抵抗線上にある場合、それは本当の抵抗を意味する。ある水準が破られた場合、それはトレンドの変化を意味する。再描画はしない。 市場は常に進化しているため、ENIGMERAはその評価ツールを適応させ、定期的に戦略を修正しています。  これにより、すべてのシナリオが徹底的に評価されることが保証されます。この市場指標の独自性は、その能力を見れば明らかです。  ENIGM
mql5と Telegramの モーニング・ブリーフィングで、詳細とスクリーンショットを含む毎日のマーケット・アップデートをご覧 ください! FX Power MT4 NGは 、長年の人気を誇る通貨強度計FX Powerの次世代モデルです。 この次世代ストレングスメーターは何を提供するのでしょうか?初代FXパワーの魅力すべて プラス GOLD/XAUの強さ分析 より正確な計算結果 個別に設定可能な分析期間 カスタマイズ可能な計算上限値により、さらに優れたパフォーマンスを実現 もっと見たい人のための特別なマルチインスタンス設定 すべてのチャートでお好みの色を無限に設定可能 数え切れないほどの通知オプションにより、重要なことを見逃すことはありません。 Windows 11とmacOSのスタイルで角を丸くした新しいデザイン 魔法のように動くインジケーターパネル FXパワーの主な機能 すべての主要通貨の強さの完全な履歴 すべての時間枠における通貨の強さの履歴 すべてのブローカーとチャートで同一の計算結果 100%信頼できるリアルタイム計算 -> リペイントなし ドロップダウン・リストから
PRO Renko Systemは、特別にRENKOチャートを取引するために設計された高精度の取引システムです。 これは、様々な取引商品に適用することができる普遍的なシステムです。 システムは効果的に正確な逆転信号へのアクセスを与えるいわゆる市場の騒音を中和する。 表示器は非常に使いやすく、信号の生成に責任がある1つの変数だけがあります。 あなたは簡単にお好みの任意の取引ツールとレンコバーのサイズにツールを適応させることができます。 私はいつもあなたが私のソフトウェアで収益性の高い取引を支援するために余分なサポートを提供する準備ができています! 私はあなたに幸せで収益性の高い取引をしたいです! ご購入後にご連絡ください! 私はあなたに私のレンコチャートジェネレータを送信します。 私はまた、私の個人的な推奨事項やシステムの他のモジュールを無料で共有します!
Trend Screener
STE S.S.COMPANY
4.83 (88)
トレンドインジケーター、1つのツールに組み込まれたすべての重要なトレンド機能を備えたトレンドトレーディングとフィルタリングのための画期的なユニークなソリューション! これは、すべてのシンボル/商品(外国為替、商品、暗号通貨、インデックス、株式)で使用できる100%再描画されていないマルチタイムフレームおよびマルチ通貨インジケーターです。 トレンドスクリーナーは、チャート内のドットで矢印トレンドシグナルを提供するインジケーターに続く効率的なインジケーターです。 トレンド分析インジケーターで使用できる機能: 1.トレンドスキャナー。 2.最大利益分析を備えたトレンドライン。 3.トレンド通貨強度メーター。 4.アラート付きのトレンド反転ドット。 5.アラート付きの強いトレンドドット。 6.トレンド矢印 毎日の分析例、毎日のシグナルパフォーマンス...など、トレンドスクリーナーインジケーターを使用して、ここで見つけることができます: ここをクリックしてください 期間限定オファー:トレンドスクリーナーインジケーターは、50ドルと生涯でのみご利用いただけます。 (元の価格125 $) MQ
市場の2つの基本原則に基づく日中戦略。 このアルゴリズムは、追加のフィルターを使用したボリュームと価格の波の分析に基づいています。インディケータのインテリジェントアルゴリズムは、2つの市場要因が1つに結合した場合にのみシグナルを出します。インディケータは、より高い時間枠のデータを使用して、M1チャート上の特定の範囲の波を計算します。そして波を確認するために、インジケーターはボリュームによる分析を使用します。 このインディケータはレディトレーディングシステムです。トレーダーが必要とするのは、信号に従うことだけです。また、インジケーターはあなた自身の取引システムの基礎になることができます。取引はミニッツチャートでのみ行われます。 インジケーターがMTFの原則を使用しているという事実にもかかわらず、インジケーターのアルゴリズムは可能な限り安定しています。 購入後、必ず私に書いてください!私の取引設定と推奨事項をあなたと共有します!
通貨強さウィザードは、取引を成功させるためのオールインワン ソリューションを提供する非常に強力な指標です。このインジケーターは、複数の時間枠のすべての通貨のデータを使用して、このまたはその外国為替ペアのパワーを計算します。このデータは、使いやすい通貨インデックスと通貨パワーラインの形式で表され、特定の通貨のパワーを確認するために使用できます。 必要なのは、取引したいチャートにインジケーターを接続することだけです。インジケーターは、取引する通貨の実際の強さを示します。このインジケーターは、トレンドに合わせて取引するときに有利に利用できる売買高の圧力の極値も示します。このインジケーターには、フィボナッチに基づく可能なターゲットも表示されます。 このインジケーターは、PUSH 通知を含むあらゆるタイプのアラートを提供します。 購入後ご連絡下さい。私の取引のヒントをあなたと共有し、素晴らしいボーナスインジケーターを無料で提供します! 幸せで有益な取引をお祈りします。
ご紹介   クォンタム トレンド スナイパー インジケーターは 、トレンド反転を特定して取引する方法を変革する画期的な MQL5 インジケーターです。 13年以上の取引経験を持つ経験豊富なトレーダーのチームによって開発されました。     クォンタムトレンドスナイパーインジケーター   は、非常に高い精度でトレンドの反転を識別する革新的な方法で、あなたのトレーディングの旅を新たな高みに押し上げるように設計されています。 ***Quantum Trend Sniper Indicatorを購入すると、Quantum Breakout Indicatorを無料で入手できます!*** クォンタム ブレイクアウト インジケーターは、トレンドの反転を特定するとアラートを発し、矢印を示し、3 つのテイクプロフィットレベルを提案します。 初心者トレーダーにもプロのトレーダーにも適しています。 量子EAチャネル:       ここをクリック MT5のバージョン:       ここをクリック 推奨事項: 期間: すべての時間枠。最良の結果を得るには、
このインディケータは、当社の2つの製品 Advanced Currency IMPULSE with ALERT  +   Currency Strength Exotics . のスーパーコンビネーションです。 このインジケーターは全ての時間枠で作動し、8つの主要通貨と1つのシンボルの強弱のインパルスをグラフで表示します。 このインジケータは、金、エキゾチックペア、商品、インデックス、先物など、あらゆるシンボルの通貨強度の加速度を表示することに特化されています。金、銀、原油、DAX、US30、MXN、TRY、CNHなどの通貨強度の加速度(インパルスまたは速度)を表示するために、任意のシンボルを9行目に追加できる、この種の最初のものです。 新しいアルゴリズムに基づいて構築され、潜在的な取引の特定と確認がさらに容易になりました。これは、通貨の強さや弱さが加速しているかどうかをグラフィカルに表示し、その加速の速度を測定するためです。加速すると物事は明らかに速く進みますが、これはFX市場でも同じです。つまり、反対方向に加速している通貨をペアリングすれば、潜在的に利益を生む取
もちろんです。以下は、提供いただいたテキストの日本語への翻訳です: MT4用の天文学指標をご紹介します:究極の天体トレーディングコンパニオン トレーディング体験を天空の高みに高める準備はできていますか?私たちの革命的なMT4用の天文学指標をご紹介します。この革新的なツールは、複雑なアルゴリズムの力を借りて、類まれなる天文学的洞察と精密な計算を提供します。 あなたの指先で宇宙の情報を: 宝のような天文学的データが明らかになる包括的なパネルをご覧ください。惑星の地理的/太陽中心座標、太陽と地球の距離、星の大きさ、伸び、星座、黄道座標および赤道座標、さらには水平座標まで、それぞれが綿密に計算され美しく表示されています。指標によって生成される垂直線は時間値に対応し、トレーディングの旅に宇宙の視点を提供します。 惑星のラインと関係: グラフを飾る惑星のラインの魔法を体験し、スケールと角度をカスタマイズできます。直感的なコントロールパネルを介して各惑星のラインの表示を簡単に切り替えることができます。指定された時刻範囲内での合会、六分会、四分会、三分会、対会、逆行の指標で天体の関係の芸術を発見してく
Please send me Direct message on MQL5 CHAT after purchasing the Indicator for Training and Installation Support There are some additional files that is important to use with the Indicator . So be sure to contact me after purchasing the Indicator So that I can add you for training and support . If you find any difficulty with installation then send me Direct message here So that I can connect with you via Anydesk or Teamview for the product installation. " Smart Order Block Indicator " to find
ICT, SMC, SMART MONEY CONCEPTS, SMART MONEY, Smart Money Concept, Support and Resistance, Trend Analysis, Price Action, Market Structure, Order Blocks, BOS/CHoCH,   Breaker Blocks ,  Momentum Shift,   Supply&Demand Zone/Order Blocks , Strong Imbalance, HH/LL/HL/LH,    Fair Value Gap, FVG,  Premium  &   Discount   Zones, Fibonacci Retracement, OTE, Buy Side Liquidity, Sell Side Liquidity, BSL/SSL Taken, Equal Highs & Lows, MTF Dashboard, Multiple Time Frame, BigBar, HTF OB, HTF Market Structure, 
まず第一に、この取引ツールはノンリペイント、ノンリドロー、ノンラグの指標であり、プロの取引に理想的ですことを強調する価値があります。 オンラインコース、ユーザーマニュアル、デモ。 スマートプライスアクションコンセプトインジケーターは、新米から経験豊富なトレーダーまで、非常 に強力なツールです。Inner Circle Trader AnalysisやSmart Money Concepts Trading Strategiesなど、20以上の有用な指標を1つに組み合わせています。このインジケーターはスマートマネーコンセプトに焦点を当て、大手機関の取引方法を提供し、彼らの動きを予測するのに役立ちます。 特に、流動性分析に優れており、機関がどのように取引しているかを理解しやすくしています。市場のトレンドを予測し、価格の動きを慎重に分析するのに優れています。機関の戦略とトレードを合わせることで、市場の動向についてより正確な予測ができます。このインジケーターは多目的であり、市場構造を分析し、重要な注文ブロックを特定し、さまざまなパターンを認識するのに優れています。 このインジケー
カスタムMT4インジケーターで外国為替取引を成功させるための秘密を発見してください! 外国為替市場で成功を達成し、リスクを最小限に抑えながら一貫して利益を得る方法を疑問に思ったことはありますか? これがあなたが探している答えです! 取引へのアプローチに革命をもたらす独自のMT4インジケーターを導入できるようにします。 ユニークな汎用性 私たちのインジケータは、RenkoとRangeBarのろうそくのフォーメーションを好むユーザー向けに特別に設計されています。 これらのチャートタイプは多くの経験豊富なトレーダーに好まれていることを理解しています。そのため、私たちのインジケーターはそれらとシームレスに統合され、比類のない市場分析を提供します。 クリアトレンドシグナル 複雑な分析を忘れてください! 私たちのインジケーターは、鮮やかな色と明確なドット構造を利用して、市場の動向を明確に示しています。 赤と青の点は、価格の動きの方向性について疑いの余地がなく、取引の迅速な意思決定を可能にします。 HH/HL HL/LL戦略とのアライメント HH/HLおよびHL/LL構
現在20%OFF! 初心者やエキスパートトレーダーに最適なソリューションです。 このインディケータは、エキゾチックペア・コモディティ・インデックス・先物など、あらゆるシンボルの通貨の強さを表示することに特化したインディケータです。金、銀、原油、DAX、US30、MXN、TRY、CNHなどの通貨の強さを表示するために、9行目にどのシンボルでも追加することができます。独自の機能を多数搭載し、新しい計算式を採用したため、ユニークで高品質、かつ手頃な価格のトレーディングツールとなっています。新しいトレンドやスキャルピングチャンスのトリガーポイントを正確に把握することができるため、あなたのトレードがどのように改善されるか想像してみてください。 ユーザーマニュアル:ここをクリック   https://www.mql5.com/en/blogs/post/708876 すべての時間枠に対応します。あなたはすぐにトレンドを見ることができるようになります! 新しいアルゴリズムに基づいて設計されているため、潜在的な取引の特定と確認がより簡単になります。これは、8つの主要通貨と1つのシンボ
TakePropips Donchian Trend Pro
Eric John Pajarillaga Aldana
4.82 (17)
TakePropips Donchian Trend Pro   (MT4) は、ドンチャン チャネルを使用してトレンドの方向を自動的に検出し、エントリーとエグジットの取引シグナルを提供する強力で効果的なツールです! この多機能インジケーターには、トレンド スキャナー、取引シグナル、統計パネル、スクリーナー、取引セッション、およびアラート履歴ダッシュボードが含まれます。取引シグナルを提供し、チャートを分析する時間を節約するように設計されています! ユーザー マニュアルとインストール ガイドは、ブログ投稿 (   https://www.mql5.com/en/blogs/post/751368   ) からダウンロードできます。 今日は 50% オフ! 98ドルから49ドルに値下げ! このインジケーターは、ストラテジー テスターでテストできます (ビジュアル モードを有効にします)。 詳細については、説明の下にあるビデオ チュートリアルも利用できます。 ご不明な点やサポートが必要な場合は、私に連絡してください。 TakePropips Donchian Trend Pro イン
ECM Elite Channel is a volatility-based indicator, developed with a specific time algorithm, which consists of finding possible corrections in the market. This indicator shows two outer lines, an inner line (retracement line) and an arrow sign, where the channel theory is to help identify overbought and oversold conditions in the market. The market price will generally fall between the boundaries of the channel. If prices touch or move outside the channel, it's a trading opportunity. The
TrendDecoder Premium
Christophe Pa Trouillas
5 (6)
レンジと次の動きを特定    |  トレンドの最も早いシグナルと強さを得る   |  反転の前に明確な出口を得る   |  価格がテストするフィボ・レベルを見つける。 非リペイント、非遅延インディケータ - マニュアルおよび自動売買に最適 - すべての資産、すべての時間単位に対応 期間限定キャンペーン   >> 50%OFF 購入後、 推奨セッティングについては、このチャンネルで私に連絡してください。 MT5 バージョン: ここをクリック BladeSCALPER   と   PowerZONES   を使った完全な方法を入手する どのようなものですか? TrendDECODERは、トレンド監視をシンプルかつ簡単にするための複数のイノベーションを集約したものです。 Projective TrendLine (投影トレンドライン) - 今後のトレンドのスピードリファレンス。 RealTime TrendLine vs. Projective TrendLine (リアルタイムトレンドライン vs. Projective TrendLine) - 市場が同じ方
作者のその他のプロダクト
この指標は、8 つの主要通貨 (USD、EUR、GBP、AUD、NZD、CAD、CHF、JPY) の相対的な強さを示します。 力の値は 0 ~ 100 の範囲で正規化されます。 60 を超える値は強いことを意味します。 40未満の測定値は衰弱を示します。 購入する前に、無料のアドバイザー (ペア パワー インデックス) を試すことができます。 このアドバイザーは、28 ペアの評価、手動取引、自動ネットワーク取引、トレーリング ストップを使用した注文管理、および利益保護を提供します。       Pair Power Index Helper チケット Only Show Current Pair -       true の場合、現在のチャート ペアのみが表示されます。それ以外の場合は、8 つの曲線すべてが表示されます。 Bars To Show     - フォース カーブを表示するバーの数。 Ma Periods To Smooth Curves   : 強度曲線を平滑化するための移動平均期間 Suffix     - 文字の接尾辞。今すぐインストールする必要はありません。 F
観察。このコンサルタントはヘッジ口座のみを対象としています。メタトレーダー4のバージョン     Quick Panel Pro 特徴 バッチの計算はすばやく簡単です。停止線を移動すると、計算はすぐに行われます。 ほとんどの業務操作は、これらのパネルのボタンをクリックするだけですぐに完了できます。 緑色のボタンをクリックするだけで、パネルをすばやく切り替えることができます。 EA はストラテジー テスターで実行できます。この機能を使用して、戦略をトレーニングしたり確認したりできます。 (無料ですので、お試しください)。 黄色の背景のパネルに平均価格を表示し、平均価格の線を描きます。       ここをクリック コントロールパネル ダッシュボードは 2 つの列で構成されます。左の列は売りに関するもの、右の列は買いに関するものです。 売り: 売り注文をオープンします。 最初: 最初の売り注文を閉じます。 1つ目は営業時間についてです。 最後に: 最後の売り注文を閉じます。最後のは営業時間についてです。 all+: 利益を伴ってポジションを閉じるための売り注文。 all-: 損失で売り
Gamma Bands   This indcator shows the trend with the color histogram. It is simple and easy to use. Usage: If the histogram changes from the aqua to the fuchsia, which means the trend is up. If the histogram changes from the fuchsia to the aqua,which means the trend is down. Inputs: MaPeriods: the periods of moving average. f1: the multiplier of inner bands f2: the multiplier of outer bands   Popup Window Alert Email Alert Mobile Push Alert Alerts When the trend changes for the long trend to the
このアドバイザーは、複数のペアをワンクリックで取引できるダッシュボードです。 クリック   開ける   選択したペアの注文を開くボタン。 クリック   近い   選択したペアの注文を閉じるボタン。 注文ロットはユーザーが入力した番号です。正の数は買い注文に対応し、負の数は売り注文に対応します。 部分的に閉じるのではなく、注文全体を閉じるには、   「CLOSE」 ボタンをクリックします。クロージングアクションはロット数とは関係ありません。 マジックインプットを 0 に設定すると、アドバイザーが同時に手動注文を閉じるのを手伝ってくれます。 エントリーマジックを別のアドバイザーのマジックで構成すると、アドバイザーは、別のアドバイザーがオープンした注文を同時にクローズするのに役立ちます。 三角生垣   ワンクリックで。 禁止: Magic - アドバイザーのマジックナンバー。 MaxLots: 最大ロット。ロット数がこのMaxLotsを超える場合、注文ロットはMaxLotsとなります。 StopLoss: ある時点でのストップロス。 TakeProfit - ポイントごとに利益を獲得します
インジケーターには 2 つの部分が含まれています。 パート I: カラーキャンドルが主要なトレンドを示す カラーローソク足とは、ローソク足の色で相場の状態を識別することです。 スクリーンショットに示されているように、色がアクアの場合、市場はロング注文を発注するか、ショート注文を終了する必要がある状態です。色がトマトの場合は、ショート注文を行うか、ロング注文を終了する時期です。 色が変化している場合は、その完了を (現在のバーが閉じるまで) 待つことをお勧めします。 パート II: バンドを描く 内側のバンドは安全領域として定義され、外側のバンドはクローズオーダー用です。 以下のような取引戦略: 色がアクアで、価格が内側のバンド内にある場合は、ロング注文を出します。価格が外側のバンドを超えたら、注文を閉じる時期です。 色がトマトで、価格が内側のバンドにある場合は、ショート注文を出します。価格が外側のバンドを越えたら、注文を閉じる時期です。 注:価格が内側のバンドの場合のみエントリーマーケットです。これは非常に重要です。 入力パラメータ ShowC
This indcator shows the trend with the color histogram. It is simple and easy to use. Usage: If the histogram changes from the aqua to the fuchsia, which means the trend is up. If the histogram changes from the fuchsia to the aqua,which means the trend is down. Inputs: MaPeriods: the periods of moving average. f1: the multiplier of inner bands f2: the multiplier of outer bands Popup Window Alert Email Alert Mobile Push Alert Alerts When the trend changes from the long trend to the short trend or
This EA is designed to monitor the slippage of opening and closing orders, and save the records in files. It is useful to record the slippage and evaluate brokers. The record files are saved in the folder  MT4_Data_Folder\MQL4\Files.  Go to "File " --> "Open Data Folder" . Warning : Do NOT open the files directly, otherwise it will affect the exectution of EA, just copy them to another folder and open them. Usage: Open a chart and load the EA on it, just need only one EA to run, it monitors a
FREE
このEAには次のような特徴があります。 これは、ソートされたペアのパワーを提供します。       主要な28ペア 、         取引で強いペアまたは弱いペアを簡単に選択できるようになります。 ペアパワーはインジケーターを使用して計算されます。       EAに組み込まれている 通貨相対強度 。デフォルトの入力はD1,90,0です。 主要な28の外国為替ペアに限定されず、あらゆるシンボルまたはペアを取引できます。 6 つのタグが含まれています:       PPI、マニュアルトレード、グリッド売り、グリッド買い、自動クローズ、損益分岐点。 PPI     主要な28の外国為替ペアのソートされたペアパワーです。       「   PPI   」 という用語は 「 ペアパワーインデックス 」 の略です 。     ペアをクリックすると、チャートのシンボルがすぐに変更されます。 マニュアルトレード     -- ボタンをクリックして取引、オープン売り、SL/TP でオープン買い、ロット グリッドセル     -- 売り注文のグリッドスペースを設定して自動的に取引します グリッド購入
FREE
Note: This EA only works on Hedging account. The MetaTrader 4 version Quick Panel This Panel is an Expert Advisor, which provides six groups of trading panel. Features Most trading operations can be quickly made by clicking the button on these panels. Changing panels is quick just by clicking the green button. The EA can run on visual chart on the strategy tester, which provides an easy method to practice trading on history data. Show the average price on a yellow-background panel and draw th
This Expert Advisor is designed to manage orders. It offers the following functions: Set a stop loss for an order having none. Set a take profit for an order having none. Close the last order if the total orders of a symbol are over the setting. Close the order if its lots are over the setting. Close the order if its profit in pips is over the setting. Close the order if its loss in pips is over the setting. Close the order if its profit in amount is over the setting. Close the order if its loss
FREE
This EA is designed to monitor the slippage of opening and closing orders, and save the records in csv file. It is useful to record the slippage and evaluate brokers. The record files are saved in the folder  MT5_Data_Folder\MQL5\Files.  Go to   "File " --> "Open Data Folder"   . Warning :   Do NOT open the files directly, otherwise it will affect the exectution of EA, just copy them to another folder and open them. Usage: Open a chart and load the EA on it, just need only one EA to run, it m
FREE
This is a MetaTrader 5 script. It helps to summarize all trades into every symbol. Input Select Period: This is 7-option input. It includes Last Month, This Month, Last Week, This Week, Today, All History, and Date Specified. Specify Starting Date: Enter a date if you selected Date Specified in "Select Period" input. Specify Ending Date: Enter a date if you selected Date Specified in "Select Period" input. The summary is saved into a file in MQL5\Files folder. MT4 Version:   https://www.mql5.c
FREE
This is a MetaTrader 4 script. It helps to summarize all trades into every symbol. Input Select Period: This is 7-option input. It includes Last Month, This Month, Last Week, This Week, Today, All History, and Date Specified. Specify Starting Date: Enter a date if you selected Date Specified in "Select Period" input. Specify Ending Date: Enter a date if you selected Date Specified in "Select Period" input. The summary is saved into a file in MQL4\Files folder. Also, there is pop-up window for
FREE
This is a MetaTrader 4 script. It helps to export all trades into a CSV file as per Symbol and selected periods. Input Select Symbol: This is 2-option input. Select current symbol or all symbols to export its orders. Select Period: This is 7-option input. It includes Last Month, This Month, Last Week, This Week, Today, All History, and Date Specified. Specify Starting Date: Enter a date if you selected Date Specified in "Select Period" input. Specify Ending Date: Enter a date if you selected D
FREE
このアドバイザーは次の機能を提供します。 ポジションをオープンする: 価格がトレンドラインを超えたら、ロング注文またはショートオーダーをオープンします。 クローズ: 価格がトレンドラインを超えたら、ロングポジションまたはショートポジションをクローズします。 トレーリングストップロス – EA はトレンドラインに沿って、ロング注文のストップロスを増加させたり、ショート注文のストップロスを減少させ続けます。 ラインはトレンドラインでも水平線でも構いません。     傾向線は半径または線分にすることができます。線分には、その線が存在する期間のみ取引するという特別な機能があります。 ポジションをオープンおよびクローズできるこれらのラインには、特定の名前が付いています。 EA では、手動で線を描画する代わりに、線描画パネルを提供します。 すべてのオープンポジションとクローズポジションのスクリーンショットは、MQL4/Files/Cross Trend Line to Trade フォルダーに保存されます。 EAは以下で使用できます 戦略 試着室。支払う前にストラテジーテスターで試してみてください
インジケーターには 2 つの部分が含まれています。 パート I: カラーキャンドルが主要なトレンドを示す カラーローソク足とは、ローソク足の色で相場の状態を識別することです。 スクリーンショットに示されているように、色がアクアの場合、市場はロング注文を発注するか、ショート注文を終了する必要がある状態です。色がトマトの場合は、ショート注文を行うか、ロング注文を終了する時期です。 色が変化している場合は、その完了を (現在のバーが閉じるまで) 待つことをお勧めします。 パート II: バンドを描く 内側のバンドは安全領域として定義され、外側のバンドはクローズオーダー用です。 以下のような取引戦略: 色がアクアで、価格が内側のバンド内にある場合は、ロング注文を出します。価格が外側のバンドを超えたら、注文を閉じる時期です。 色がトマトで、価格が内側のバンドにある場合は、ショート注文を出します。価格が外側のバンドを越えたら、注文を閉じる時期です。 注:価格が内側のバンドの場合のみエントリーマーケットです。これは非常に重要です。 入力パラメータ ShowC
このパネルはエキスパートアドバイザーであり、6 つのグループの取引パネルを提供します。 MT5 バージョン:   クイックパネルカバレッジ 特徴 ほとんどの取引操作は、これらのパネルのボタンをクリックすることで迅速に実行できます。 パネルの変更は緑色のボタンをクリックするだけで簡単に行えます。 EA はストラテジー テスターの視覚的なチャート上で実行でき、履歴データに基づいて取引を練習する簡単な方法を提供します。 背景が黄色のパネルに平均価格を表示し、平均価格の線を描きます。       ここをクリック パネル ダッシュボードには 2 つの列が含まれています。左の列は売りに関するもので、右の列は買いに関するものです。 売る:     売り注文をオープンします。 初め:     最初の売り注文をクローズします。 1 つ目はオープンタイムを指します。 最後:     最後の売り注文をクローズします。最後のはオープンタイムを指します。 すべて+:     売り注文を利益を上げてクローズします。 全て-:     損失が出た状態で売り注文を閉じる。 最大+:     最大の利益で売り注文を
このEAは、柔軟なリスク管理と6セットの取引パネルを統合したプロフェッショナルな取引ツールです。 MT5 バージョン:  Quick Panel Pro Hedging 特徴 バッチの計算はすばやく簡単です。停止線を移動すると、計算はすぐに行われます。 ほとんどの業務操作は、これらのパネルのボタンをクリックするだけですぐに完了できます。 緑色のボタンをクリックするだけで、パネルをすばやく切り替えることができます。 EA はストラテジー テスターで実行できます。この機能を使用して、戦略をトレーニングしたり確認したりできます。 (無料ですので、お試しください)。 黄色の背景のパネルに平均価格を表示し、平均価格の線を描きます。       ここをクリック コントロールパネル ダッシュボードは 2 つの列で構成されます。左の列は売りに関するもの、右の列は買いに関するものです。 売り: 売り注文をオープンします。 最初: 最初の売り注文を閉じます。 1つ目は営業時間についてです。 最後に: 最後の売り注文を閉じます。最後のは営業時間についてです。 all+: 利益を伴ってポジションを閉じるための
This indicator shows the main trend on the current chart. Features This indicator includes two bands, one is the inner white bands, another is the outer blue bands. If the white dotted line crosses down the white solid line, this means that the trend has changed to be bearish. If the white dotted line crosses up the white solid line, this means that the trend has changed to be bullish. Once the crossing happened, it will not repaint. Settings ShowColorCandle: if 'true', it will show the colo
This indicator shows the relative strength of 8 major currencies: USD, EUR, GBP, AUD, NZD, CAD, CHF and JPY. The strength value is normalized to the range 0-100: The value above 60 means strong. The value below 40 means weak. Note: This indicator does not show strength lines, it just shows the digital result on chart. Another version with strength lines: Currency Relative Strength Inputs BarsToCalculate - Number of bars to calculate strength. MaPeriodsToSmoothLines - Moving Average periods f
This indicator is designed to show the pair power of the major 28 paris with RSI,Stochostic,and CCI. The power value is sorted from the weak to the strong. The weaker pairs: the pairs occurs at least 2 times in the top 3 rows The stronger pairs:   the pairs occurs at least 2 times in the bottom 3 rows Users can add another symbol, so it can calculate 28+1 symbols. My advice: https://www.mql5.com/en/blogs/post/729880 A free EA with Pair Power Matrix  ---  https://www.mql5.com/en/blogs/post/732
The purpose of the inidcator is to identify the reversal point. The blue arrow is buy signal and the yellow star is its stop loss. The red arrow is sell signal and the yellow star is its stop loss. Alert feature: if there is a signal, the indicator will send alerts of  popup window,email or mobile push. Inputs: Popup Window Alert: it is false in default Email Alert : it is false in default Mobile Push Alert: it is false in default. MetaTrader 5 Version: Reversal Point Please note that the singa
The purpose of the inidcator is to identify the reversal point. The blue arrow is buy signal and the yellow star is its stop loss. The red arrow is sell signal and the yellow star is its stop loss. Please note that the singal is against trend,it could be continual fail. Alert feature: if there is a signal, the indicator will send alerts of  popup window,email or mobile push. Inputs: Popup Window Alert: it is false in default Email Alert : it is false in default Mobile Push Alert: it is false in
このアドバイザーは次の機能を提供します。 ポジションをオープンする: 価格がトレンドラインを超えたら、ロング注文またはショートオーダーをオープンします。 クローズ: 価格がトレンドラインを超えたら、ロングポジションまたはショートポジションをクローズします。 トレーリングストップロス – EA はトレンドラインに沿って、ロング注文のストップロスを増加させたり、ショート注文のストップロスを減少させ続けます。 ラインはトレンドラインでも水平線でも構いません。     傾向線は半径または線分にすることができます。線分には、その線が存在する期間のみ取引するという特別な機能があります。 ポジションをオープンおよびクローズできるこれらのラインには、特定の名前が付いています。 EA では、手動で線を描画する代わりに、線描画パネルを提供します。 すべてのオープンポジションとクローズポジションのスクリーンショットは、MQL4/Files/Cross Trend Line to Trade フォルダーに保存されます。 EA はヘッジ口座でのみ機能します バージョンMT4 :   https://www.
フィルタ:
Martin Brown
711
Martin Brown 2022.03.04 12:19 
 

ユーザーは評価に対して何もコメントを残しませんでした

Qun Li
579
Qun Li 2019.09.14 21:01 
 

ユーザーは評価に対して何もコメントを残しませんでした

Thomas Fairhurst
1187
Thomas Fairhurst 2019.06.15 10:04 
 

ユーザーは評価に対して何もコメントを残しませんでした

Tim Eubanks
5762
Tim Eubanks 2018.03.13 08:39 
 

ユーザーは評価に対して何もコメントを残しませんでした

philippe germain
2728
philippe germain 2018.03.09 15:35 
 

ユーザーは評価に対して何もコメントを残しませんでした

2458
565
2458 2018.02.27 15:37 
 

ユーザーは評価に対して何もコメントを残しませんでした

rainwalker123
3362
rainwalker123 2018.01.28 11:23 
 

ユーザーは評価に対して何もコメントを残しませんでした

alexsxs72
406
alexsxs72 2018.01.26 09:57 
 

ユーザーは評価に対して何もコメントを残しませんでした

レビューに返信
バージョン 7.10 2022.05.19
Includes the timeframe information of the yello top/bottom when send alert message.
バージョン 7.0 2022.05.19
Added alert function when price crosses the yellow top/bottom,three kinds of alerts:
1.popup window alert
2.Email alert
3.Mobile notice push