Alpha Bands
- インディケータ
- Ziheng Zhuang
- バージョン: 6.0
- アクティベーション: 20
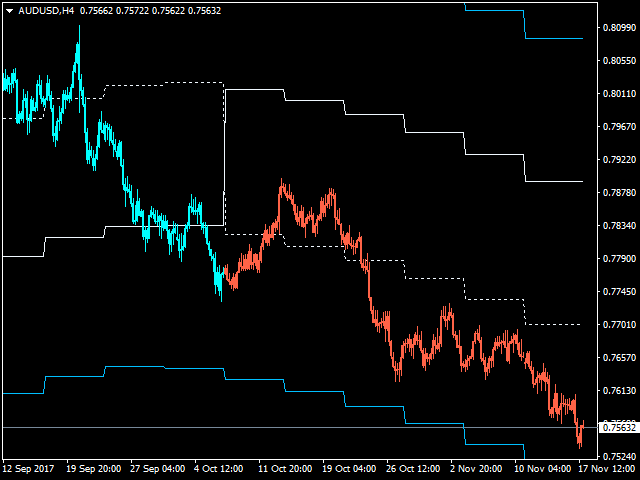
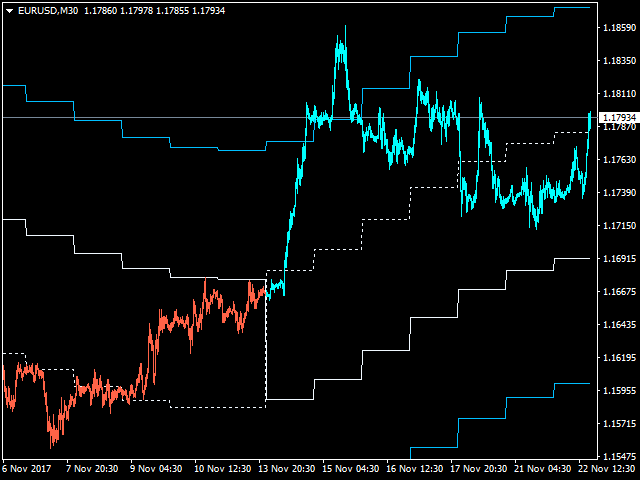
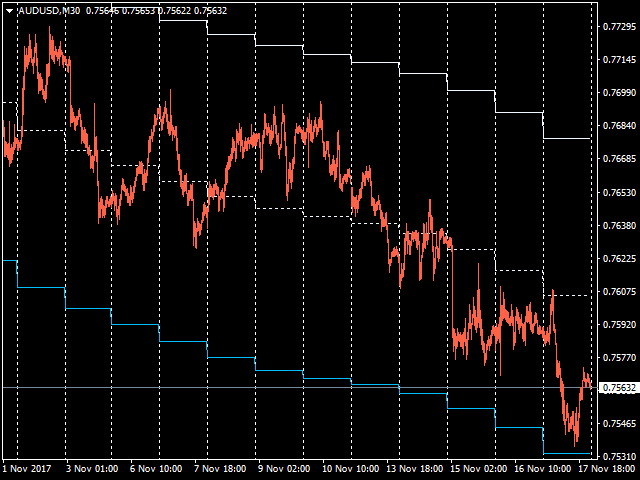
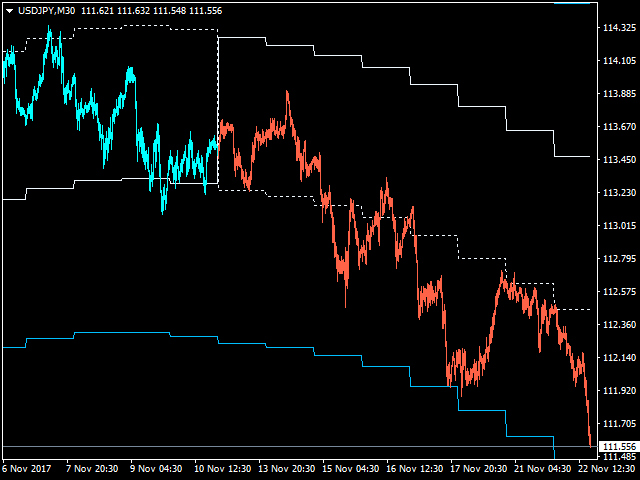
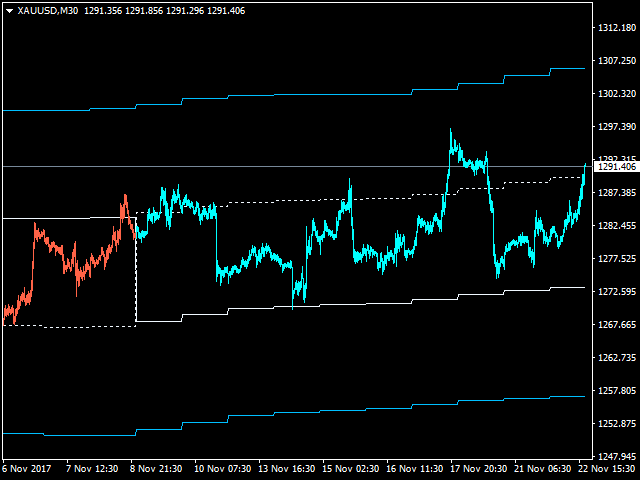
This indicator shows the main trend on the current chart.
Features
- This indicator includes two bands, one is the inner white bands, another is the outer blue bands.
- If the white dotted line crosses down the white solid line, this means that the trend has changed to be bearish.
- If the white dotted line crosses up the white solid line, this means that the trend has changed to be bullish.
- Once the crossing happened, it will not repaint.
Settings
- ShowColorCandle: if 'true', it will show the color candle.
- BullColor: the color of candle in bullish market (default is clrAqua).
- BearColor: the color of candle in bearish market (default is clrTomato).
Usage
Enter the market when the price is in the inner bands. If the price reached outer bands, order should be closed.
The key of trading is to select the proper timeframe. Of course, you may create your strategy based on this indicator.
