ZigZagLW
- インディケータ
- Gayrat Madumarov
- バージョン: 1.2
- アップデート済み: 27 10月 2017
- アクティベーション: 5
ZigZagLW - Brief Description
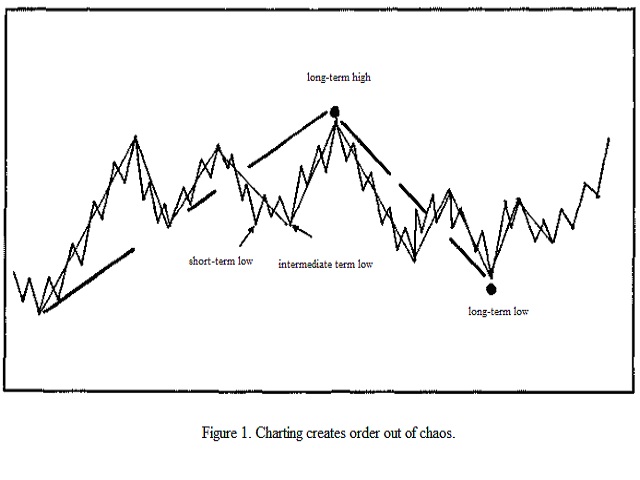
This is an implementation of an idea described in Larry Williams' "Long-Term Secrets to Short-Term Trading".
The first figure displaying the basic principle has been taken from that book.
Operation Principles
The indicator applies optimized calculation algorithms with the maximum possible speed for non-redrawable indicator. In other words, the zigzag's last shoulder is formed right after the appropriate conditions occur on the market. The shoulder does not change its direction afterwards (can only continue).
Indicator parameters
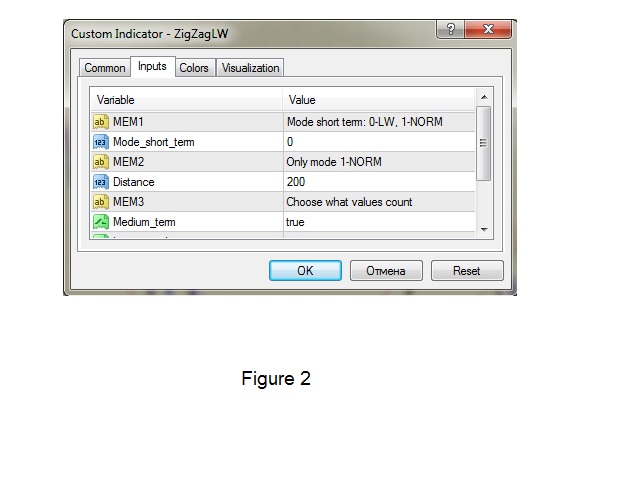
Figure 2 displays the indicator's settings menu, where:
- MEM1, MEM2, MEM3 serve only as reminders, nothing should be specified here;
- Mode_short_term - short-term level calculation mode, possible modes:
- 0 - original algorithm described by Larry Williams in his book;
- 1 - simple zigzag with the minimum reversal step;
- Distance - minimum reversal step in points used only when Mode_short_term=1;
- Medium_term, Long_term1, Long_term2, Long_term3 - flags for enabling/disabling calculations for the appropriate levels. If some definite level is disabled, all subsequent ones should be disabled as well. For example, if Long_term1=false, then Long_term2=false and Long_term3=false.
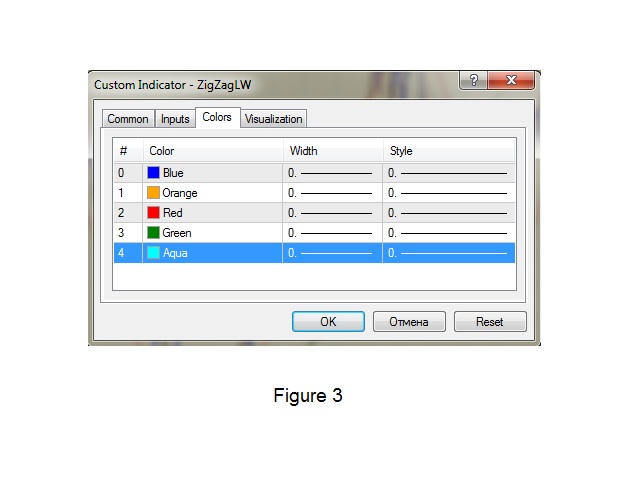
Tip: If you use the indicator in visual mode, set None in settings menu of Colors tab (Fig. 3) to delete a line of a certain level from the chart. This allows deleting the lines in random order.
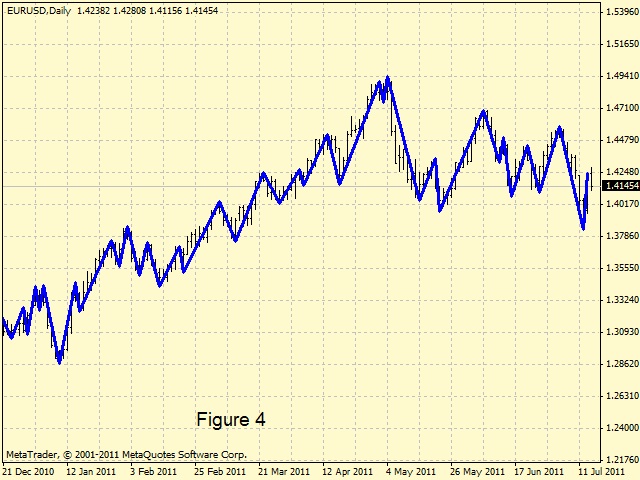
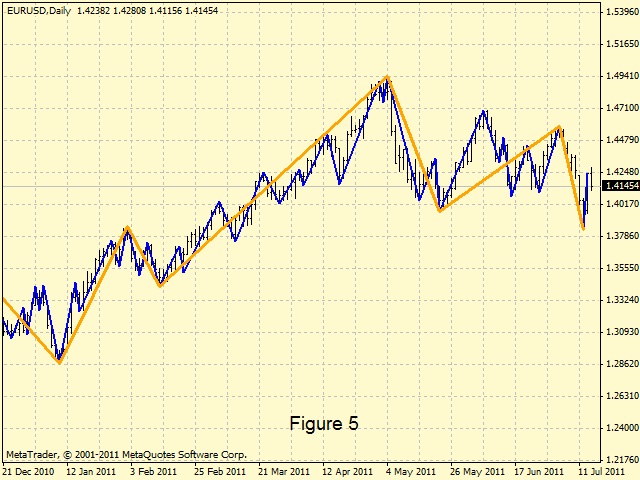
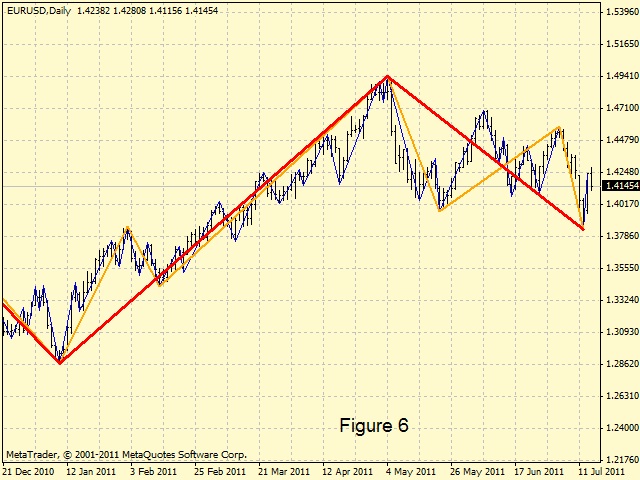
Examples
Figures 4, 5 and 6 show how the lines are added consistently.
The page https://www.mql5.com/en/code/19646 provides a link to an Expert Advisor which uses the ZigZagLW indicator, which in turn is a logical extension of the indicator presented here.
Note: similar MQL4 indicator is also available.