Fibonacci Retracement MT4 Indicator by PipTick
- インディケータ
- Michal Jurnik
- バージョン: 1.1
- アップデート済み: 1 12月 2021
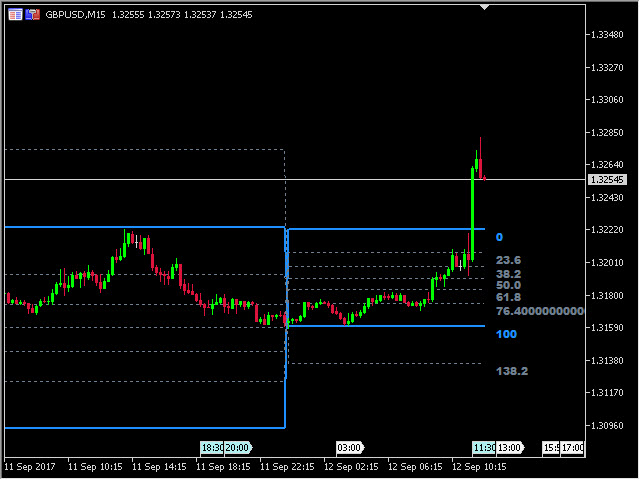
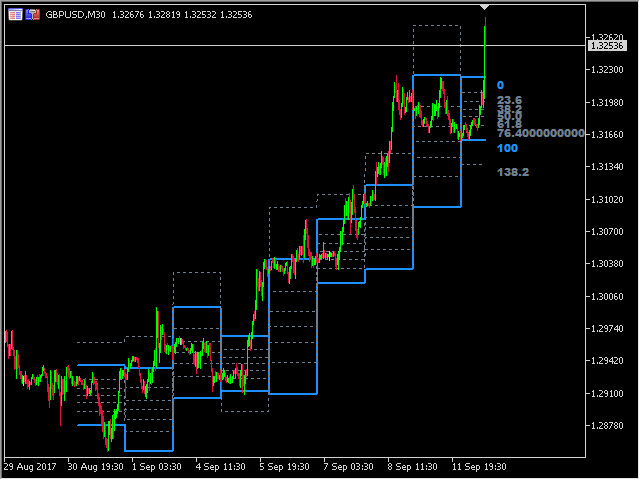
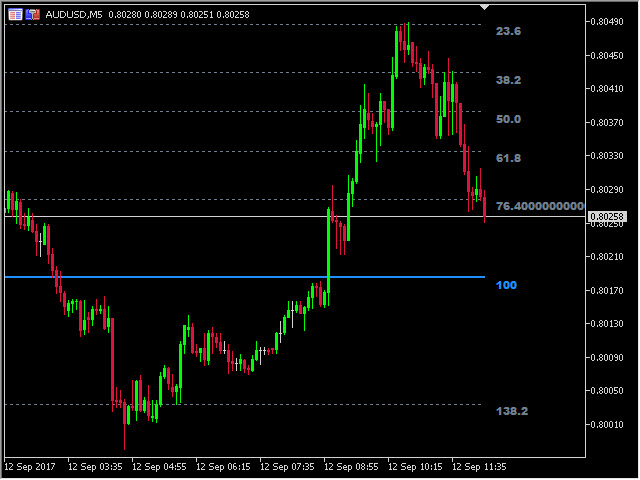
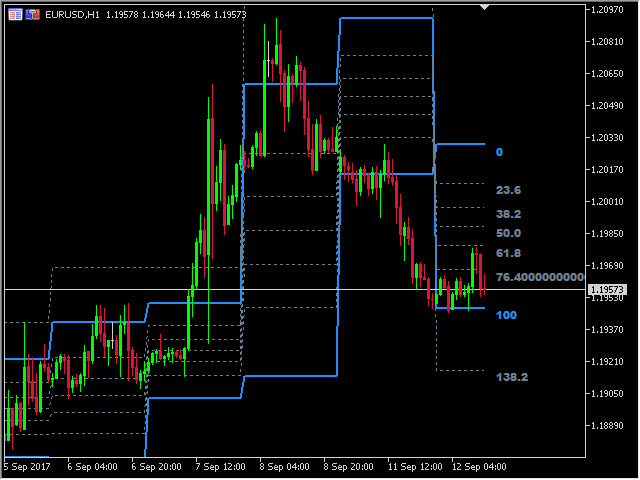
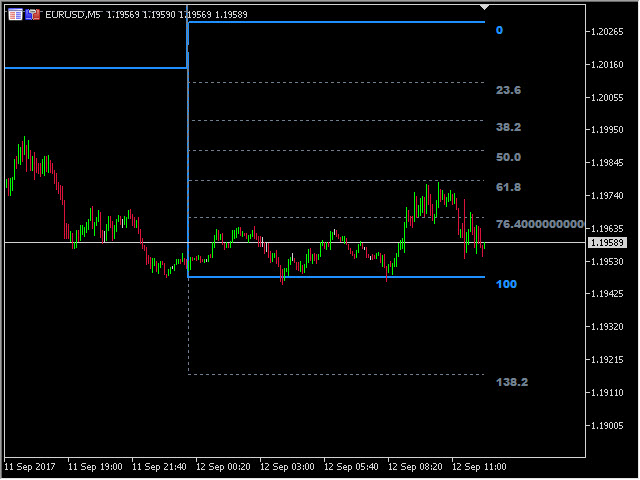
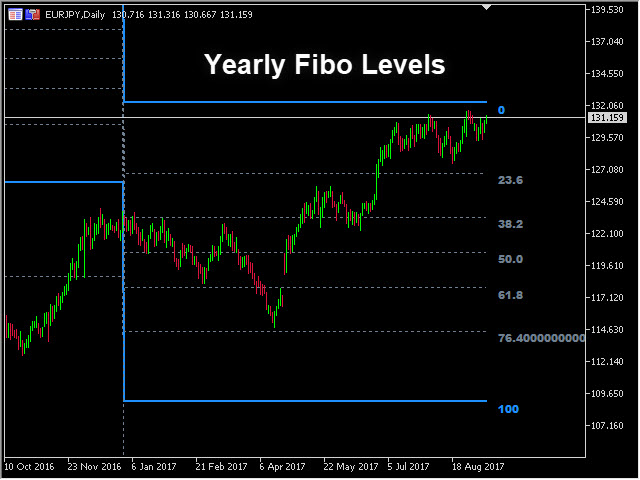
The Fibonacci indicator automatically displays the Fibonacci retracement levels, representing significant support and resistance. The range for calculating the indicator can be taken from the previous day, week, month, year or user-specified session.
Levels
- 100 % (High) of the range from the previous session.
- 0 % (Low) of the range from the previous session.
- 76,4 % of the range from the previous session.
- 61,8 % of the range from the previous session.
- 50 % of the range from the previous session.
- 38,2 % of the range from the previous session.
- 23,6 % of the range from the previous session.
- 138,2 % of the range from the previous session.
Recommendations
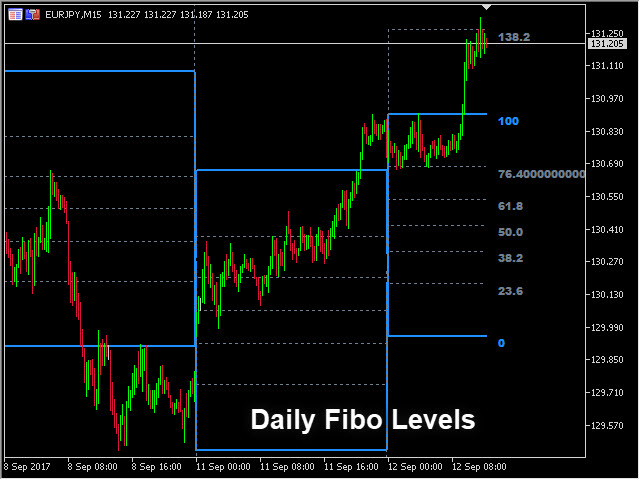
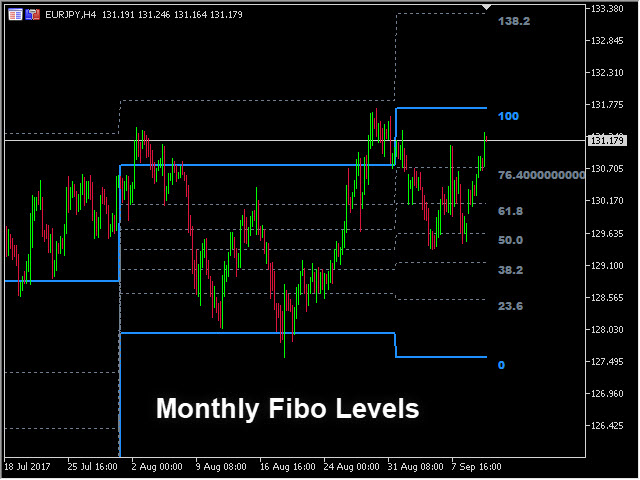
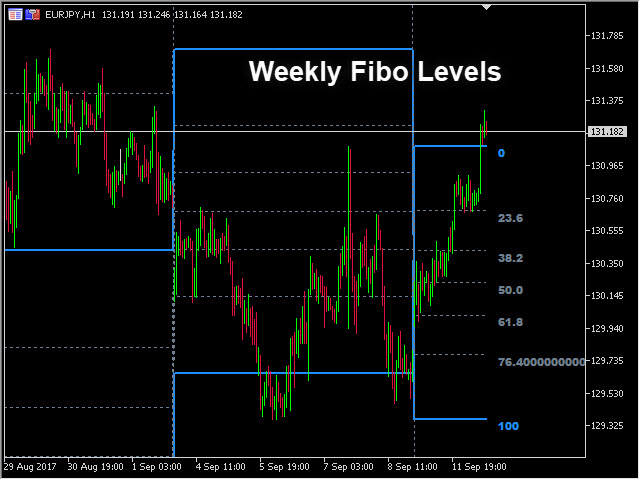
- It is advantageous to insert multiple copies of our indicator into the chart and watch the levels from daily, weekly and monthly sessions. They tend to work very well as strong support and resistance levels.
Main features
- The indicator shows the Fibonacci of the range from the previous session.
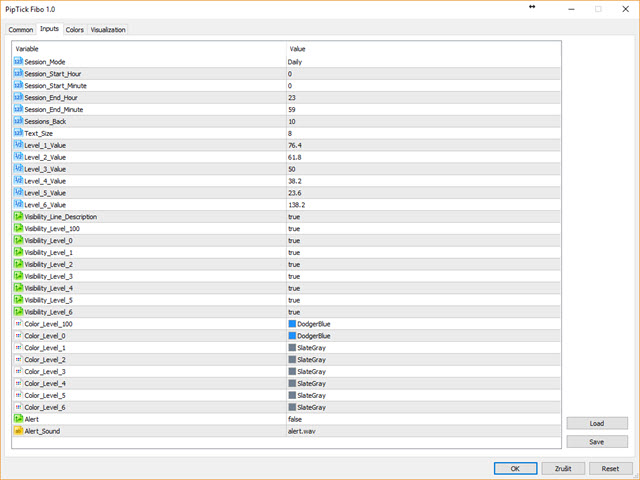
- Six user-definable levels.
- Alert notifications for indicator lines.
- Custom session time.
- Works on every timeframe (M1, M5, M15, M30, H1, H4, D1, W1, MN).
- The indicator is non-repainting.
- Ready for backtesting.
- Customizable parameters (Colors, Line thickness, Visibility...).
- High-speed calculation.
- Available for MT4 and MT5.
GREAT NO ISSUES