Market Pulse AM
- インディケータ
- Andriy Matviyevs'kyy
- バージョン: 30.50
- アップデート済み: 21 3月 2025
- アクティベーション: 10
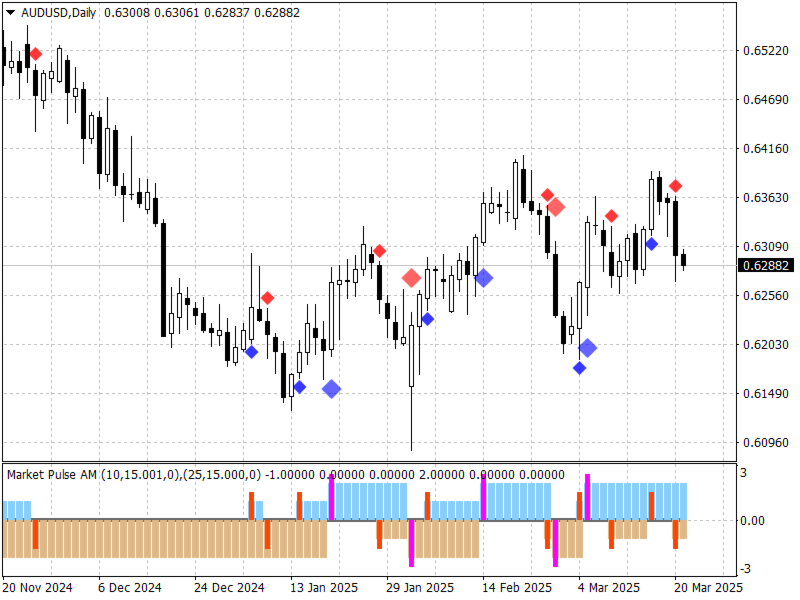
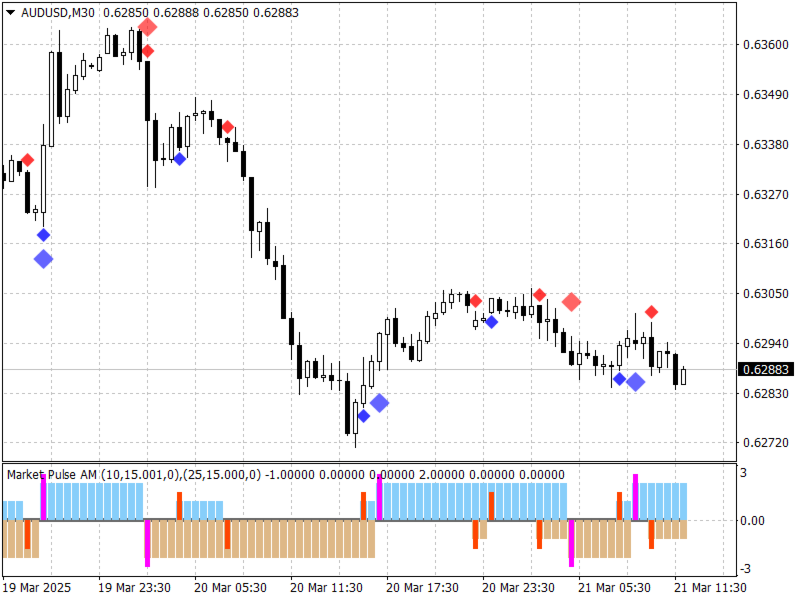
The presented indicator analyzes the direction of the short-term and long-term trend for specified periods, taking into account the volatility of the market.
This approach allows combining high sensitivity of the indicator with a high probability of execution of its signals.
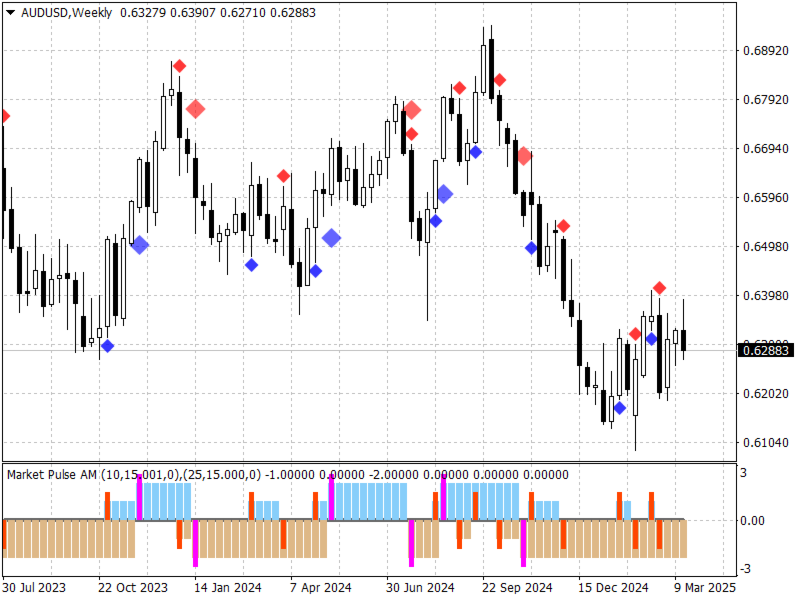
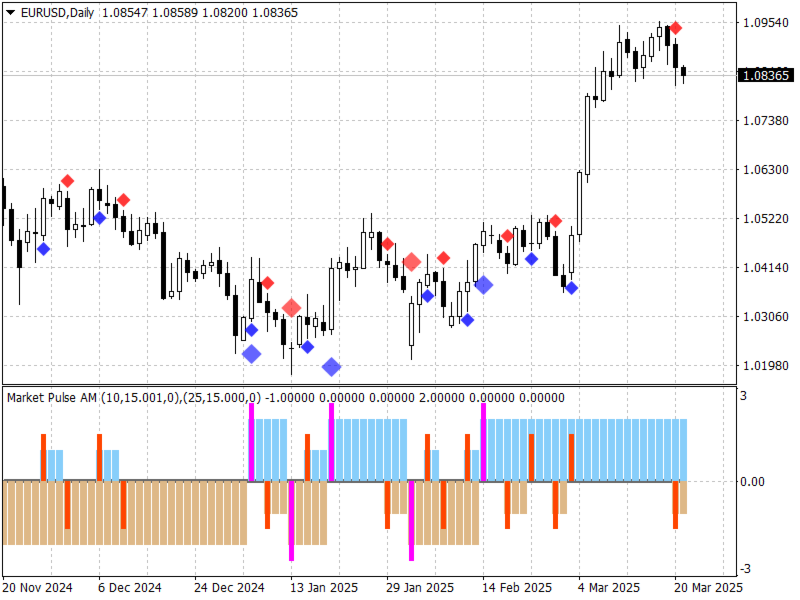
The principle of use is extremely simple: the indicator histogram is greater than 0 - a buy signal / the indicator histogram is less than 0 - a sell signal.
The indicator allows you to configure two types of parameters: fast pulse / slow pulse.
It will be rational to open transactions in the case when the fast pulse signal coincides in direction with the slow pulse signal.
Confirmation of the indicator signal is the price overcoming the maximum/minimum of the bar on which the indicator gave the signal.
The indicator does not repaint on fully formed bars.
Configurable parameters:
- Sensitivity for Slow Signal - sensitivity for the slow indicator signal to volatility;
- Coefficient sensitivity for Slow Signal - coefficient for the sensitivity of the slow indicator signal to volatility;
- Shift price for Slow Signal - shift for the price by which the slow indicator signal is calculated;
- Limit_Price_Slow - type of limit prices by which the slow indicator signal is calculated;
- Reference_Price_Slow - type of reference price by which the slow indicator signal is calculated;
- Sensitivity for Fast Signal - sensitivity for the fast indicator signal to volatility;
- Coefficient sensitivity for Fast Signal - coefficient for the sensitivity of the fast indicator signal to volatility;
- Shift price for Fast Signal - shift for the price by which the fast indicator signal is calculated;
- Limit_Price_Fast - type of limit prices by which the fast indicator signal is calculated;
- Reference_Price_Fast - type of reference price by which the fast indicator signal is calculated;
- Signal_on_Chart - the indicator displays signals not only in the indicator window but also on the price chart;
- Alerts - the indicator displays a dialog box containing information about the signal;
- Send Notification - the indicator sends a notification to mobile terminals whose MetaQuotes ID is specified in the settings window on the "Notifications" tab;
- Send Mail - the indicator sends an email to the address specified in the settings window on the "Mail" tab.
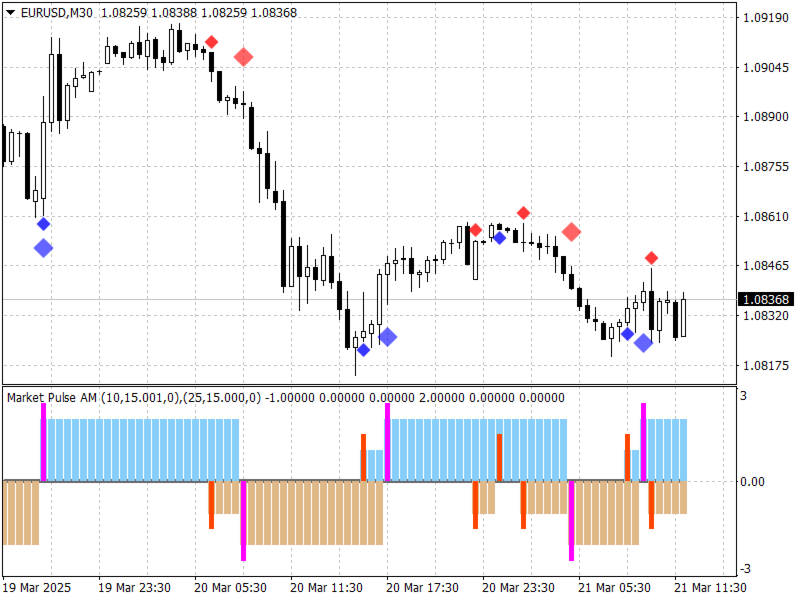

Used as a help to confirm signal before opening Order in together with other indicators.