TimeFilter simple
- インディケータ
- Andrej Nikitin
- バージョン: 1.12
- アップデート済み: 17 11月 2021
- アクティベーション: 5
The indicator is an inter-week hourly filter.
When executing trading operations, the indicator allows considering time features of each trading session.
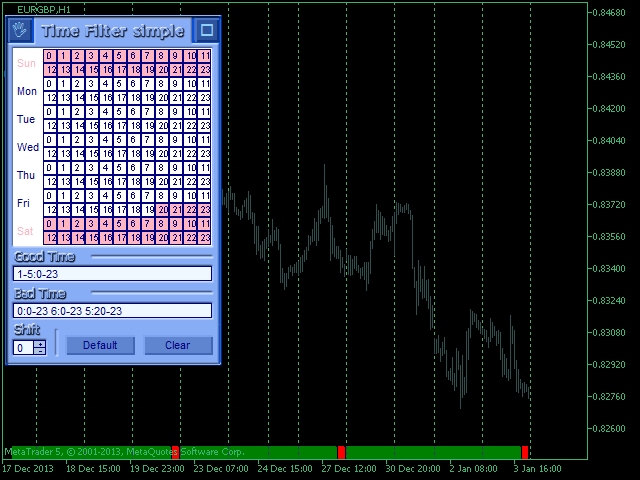
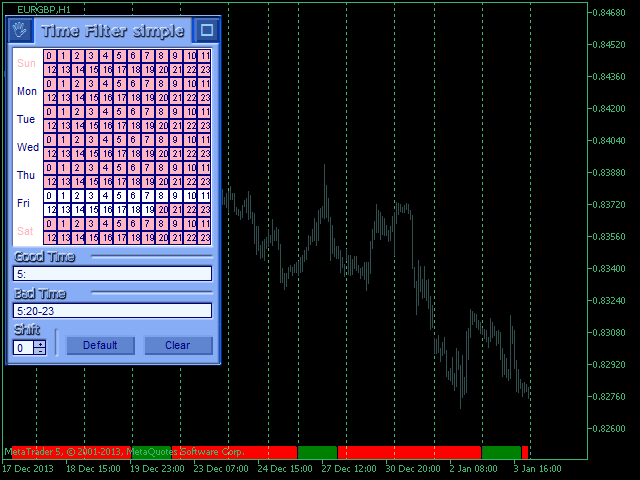
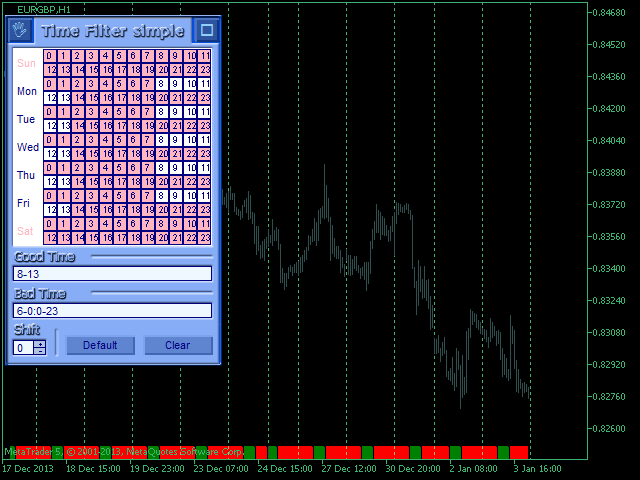
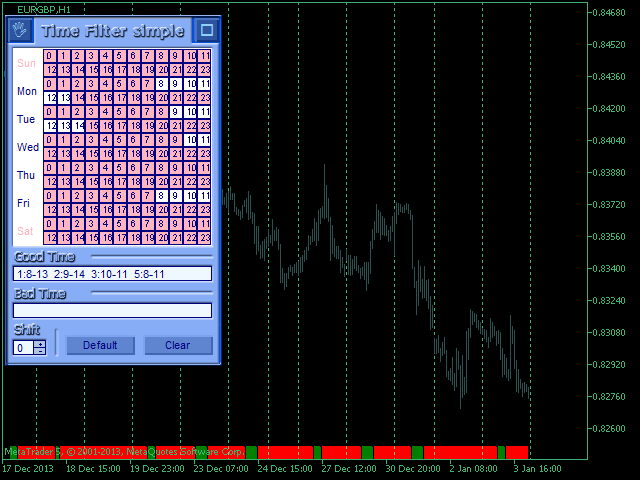
Permissive and restrictive filter intervals are set in string form. The used format is [first day]-[last day]:[first hour]-[last hour]. See the screenshots for examples.
Parameters:- Good Time for trade - intervals when trading is allowed.
- Bad Time for trade - intervals when trading is forbidden.
- time filter shift (hours) - hourly shift.
- percentage filling - indication value.
- Show On/Off - enable/disable the filter visualization.
Using in Expert Advisors: buffer 0 equal to 0 - trading is forbidden, otherwise - allowed.


ユーザーは評価に対して何もコメントを残しませんでした