• 概要
  • レビュー
  • コメント (11)
  • 最新情報

Magneto Volume Trigger

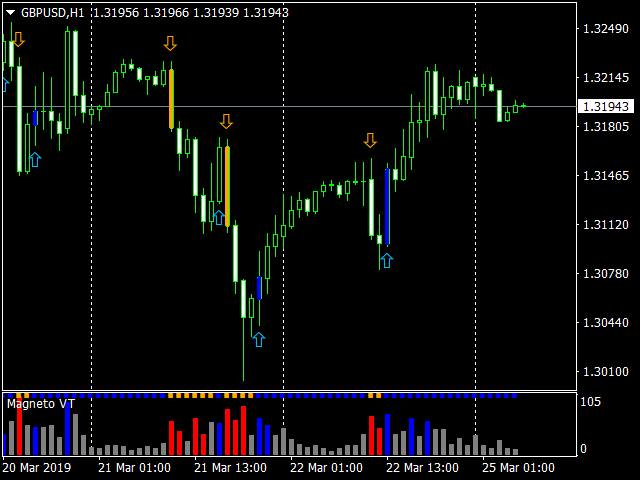
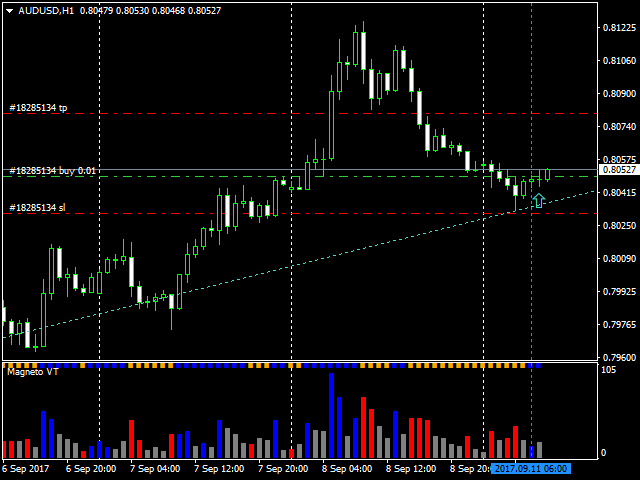
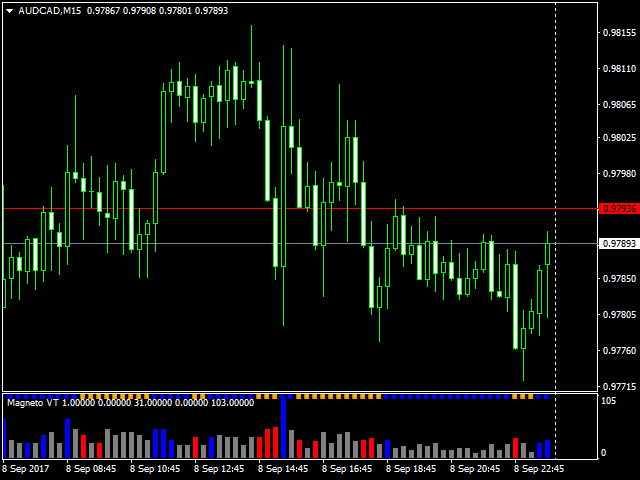
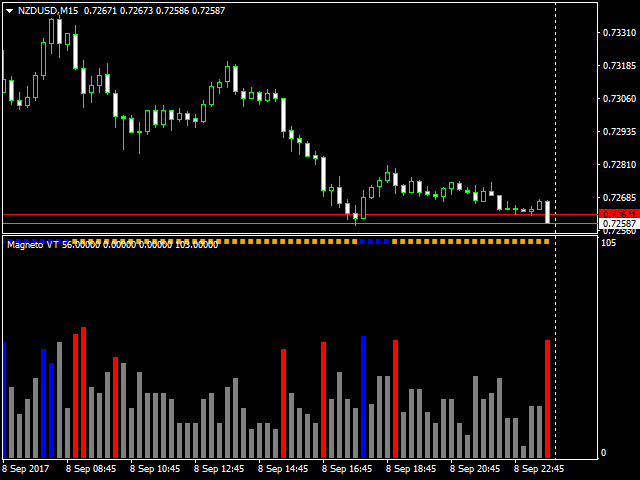
The Magneto Volume Trigger indicator is designed for determining the volume confirmed by the candlestick pattern and predicting the trend tendency.


Indicator setup and use

The calculation of values is affected by two parameters - Period and Gate. The lower the value of Gate, the higher the sensitivity of the indicator. Period allows making a sample of data for the specified number of candles. The lower the value of Period, the more the indicator is adapted to the current market conditions. In the indicator window, it is possible to track the expected trend, as well as enable the notification on trend changes. The indicator values can be used not only for opening positions, but also for determining the moment for exit. For example, if you open a buy order using the indicator signal from the H1 timeframe or based on your strategy, the order can be closed based on a signal from the smaller timeframe.


Parameters

  • Bars - the number of candles used to display the indicator.
  • Period - data sampling range.
  • Gate - sensitivity.
  • Alert - notification on trend changes.
おすすめのプロダクト
A technical indicator that calculates its readings on trading volumes. In the form of a histogram, it shows the accumulation of the strength of the movement of the trading instrument. It has independent calculation systems for bullish and bearish directions. Works on any trading instruments and time frames. Can complement any trading system. The indicator does not redraw its values, the signals appear on the current candle. It is easy to use and does not load the chart, does not require additi
Was: $249  Now: $99   Market Profile defines a number of day types that can help the trader to determine market behaviour. A key feature is the Value Area, representing the range of price action where 70% of trading took place. Understanding the Value Area can give traders valuable insight into market direction and establish the higher odds trade. It is an excellent addition to any system you may be using. Blahtech Limited presents their Market Profile indicator for the MetaTrader community. Ins
Was: $299  Now: $99   Supply Demand uses previous price action to identify potential imbalances between buyers and sellers. The key is to identify the better odds zones, not just the untouched ones. Blahtech Supply Demand indicator delivers functionality previously unavailable on any trading platform. This 4-in-1 indicator not only highlights the higher probability zones using a multi-criteria strength engine, but also combines it with multi-timeframe trend analysis, previously confirmed swings
これは、キャンドルの終値を予測する指標です。 このインジケータは、主にD1チャートでの使用を目的としていますが. この指標は、従来の外国為替取引とバイナリオプション取引の両方に適しています。 インジケーターは、スタンドアロンのトレーディングシステムとして使用することも、既存のトレーディングシステムへの追加として機能させることもできます。 このインジケーターは、現在のキャンドルを分析し、キャンドル自体の内部の特定の強度係数と、前のキャンドルのパラメーターを計算します。 したがって、この指標は、市場の動きのさらなる方向性と現在のキャンドルの終値を予測します。 この方法のおかげで、この指標は、短期の日中取引だけでなく、中期および長期の取引にも適しています。 インジケーターを使用すると、市場の状況の分析中にインジケーターが生成する潜在的な信号の数を設定できます。 インジケーターの設定には、このための特別なパラメーターがあります。 また、インジケーターは、チャート上のメッセージの形式で、電子メールで、およびPUSH通知の形式で、新しい信号について通知することができます。 購入後は必ず私に書いて
BoxChart MT4
Evgeny Shevtsov
4.57 (7)
The market is unfair if only because 10% of participants manage 90% of funds. An ordinary trader has slim changes to stand against these "vultures". This problem can be solved. You just need to be among these 10%, learn to predict their intentions and move with them. Volume is the only preemptive factor that faultlessly works on any timeframe and symbol. First, the volume appears and is accumulated, and only then the price moves. The price moves from one volume to another. Areas of volume accumu
This indicator displays the histogram and arrows on chart. When Simple The Best Pro are placed on a chart, they identify the trend.  The color of may be blue or red. The blue color stands for upside moves and the red color stands for downside trends. The indicator offers to set Stop Loss (SL) and  Take Profit (TP)  setting. The default value is ATR. Indicator has automatic optimization. The STB is a unique indicator that shows the tendency (button Bars) of a particular signals. The STB tells us
The Volume by Price Indicator for MetaTrader 4 features Volume Profile and Market Profile TPO (Time Price Opportunity). Volume and TPO histogram bar and line charts. Volume Footprint charts. TPO letter and block marker collapsed and split structure charts. Session filtering and grouping. Static, dynamic and flexible range segmentation and compositing methods with relative and absolute visualizations. Graphical layering, positioning and styling options to suit the user's analytic and aesthetic n
The Chaikin Oscillator is a technical indicator developed by Marc Chaikin that combines price and volume data to measure the accumulation and distribution of a financial instrument. It aims to identify potential buying and selling opportunities in the market. The Chaikin Oscillator is calculated by subtracting a 10-day exponential moving average of the Accumulation Distribution Line (ADL) from a 3-day exponential moving average of the ADL. Here's how to use the Chaikin Oscillator indicator in tr
Descption: The Volume Profile displays detailed informations of historical trading activities at certain price levels (Market Profile). So you can locate the areas with the best prices in the market and get an advantage about other market participants. Features: Customizable Volume Profile / Market Profile Shows the "fair" Value Area with 70% of all Volume Shows critical low volume zones Shows VPOC, VAL and VAH Points Works on all timeframes Also available for MT5 ( https://www.mql5.com/en/m
The Best One Scalping Trade Panel functional manual trade panel with risk reward, auto SL by candle ( original solution), lot size calculation, one-click trading, scale in and out of trades (partial close),  Works with all symbols not just currency pairs, perfect works on DAX, NASDAQ, GOLD, ...... I earn every day during live stream on ZakopiecFX - join Me Risk by lot Risk by percent SL by points SL by Candle, Renko, RangeBar ( original solution) TP by point TP by Risk/Reward Auto Trailing b
Market Profile Shows where the price has spent more time, highlighting important levels that can be used in trading. It is a powerful tool which is designed to take the fundamental components which comprise every market; price/volume/time, and visually display their relationship in real-time as the market develops for a pre-determined time period. Very powerful tool!
Market Profile 3
Hussien Abdeltwab Hussien Ryad
4 (4)
Market Profile 3 MetaTrader 4 indicator  — is a classic Market Profile implementation that can show the price density over time, outlining the most important price levels, value area, and control value of a given trading session. This indicator can be attached to timeframes between M1 and D1 and will show the Market Profile for daily, weekly, monthly, or even intraday sessions. Lower timeframes offer higher precision. Higher timeframes are recommended for better visibility. It is also possible t
FREE
TWO PAIRS SQUARE HEDGE METER INDICATOR Try this brilliant 2 pairs square indicator It draws a square wave of the relation between your two inputs symbols when square wave indicates -1 then it is very great opportunity to SELL pair1 and BUY Pair2 when square wave indicates +1 then it is very great opportunity to BUY pair1 and SELL Pair2 the inputs are : 2 pairs of symbols         then index value : i use 20 for M30 charts ( you can try other values : 40/50 for M15 , : 30 for M30 , : 10 for H1 ,
Owl smart levels
Sergey Ermolov
4.63 (54)
MT5版  |   FAQ Owl Smart Levels Indicator   は、 Bill Williams   の高度なフラクタル、市場の正しい波構造を構築する Valable ZigZag、エントリの正確なレベルをマークする Fibonacci レベルなどの一般的な市場分析ツールを含む 1 つのインジケーター内の完全な取引システムです。 利益を得るために市場と場所に。 戦略の詳細な説明 インジケータを操作するための指示 顧問-取引助手 プライベートユーザーチャット ->購入後に私に書いて、私はプライベートチャットにあなたを追加し、あなたはそこにすべてのボーナスをダウンロードすることができます 力はシンプルさにあります! Owl Smart Levels   取引システムは非常に使いやすいので、専門家にも、市場を勉強し始めて自分で取引戦略を選択し始めたばかりの人にも適しています。 戦略と指標に秘密の数式や計算方法が隠されているわけではなく、すべての戦略指標は公開されています。 Owl Smart Levels を使用すると、取引を開始するためのシグナルをすばやく確認し、
設定した時差で時間ラインを表示します。(30分単位の時差には対応していません。) また、100.000、.100、.200のようにキリの良い価格で価格ラインを表示します。 標準ではMT4による時間と価格でグリッドラインが表示されていますが、ブローカーの時間となり価格とともに中途半端な位置で表示されるので、非常に分かりにくいものとなっています。 それを非表示にし ユーザーが設定した時差と価格の分かりやすい位置でグリッドラインを表示します 。他のEAや裁量取引に負荷をかけないよう、軽快に動作するよう実装しております。 時間ラインは未来の時間も表示 します。事前に節目となる時間の把握ができます。(土日の時間軸は表示されません。) アジア、EU、USの時間帯を色付きで表示できます。 マーケットの開始時刻や、イベントの時間など特定の時間をSpecial Timeとしてラインを表示することができます。 パラメーター説明 ・Time offset:  MT4上の時間に対する時差を設定します。 ・Bars time range:  時間ラインを表示する範囲をバーの本数で設定します。 ・P
インディケータは現在のクオートを作成し、これを過去のものと比較して、これに基づいて価格変動予測を行います。インジケータには、目的の日付にすばやく移動するためのテキスト フィールドがあります。 オプション: シンボル - インジケーターが表示するシンボルの選択; SymbolPeriod - 指標がデータを取る期間の選択; IndicatorColor - インジケータの色; HorisontalShift - 指定されたバー数だけインディケータによって描画されたクオートのシフト; Inverse - true は引用符を逆にします。false - 元のビュー。 ChartVerticalShiftStep - チャートを垂直方向にシフトします (キーボードの上下矢印)。 次は日付を入力できるテキストフィールドの設定で、「Enter」を押すとすぐにジャンプできます。
Zig Zag 123 tells us when a reversal or continuation is more likely by looking at the shift in supply and demand. When this happens a signature pattern appears known as 123 (also known ABC) will often break out in direction of higher low or lower high. Stop loss and take profit levels have been added. There is a panel that shows the overall performance of your trades for if you was to use these stop loss and take profit levels.  We get alerted if a pattern 123 appears and also if the price
Noize Absorption Index - is the manual trading system that measures the difference of pressure between bears forces and bulls forces. Green line - is a noize free index that showing curent situation. Zero value of index shows totally choppy/flat market.Values above zero level shows how powerfull bullish wave is and values below zero measures bearish forces.Up arrow appears on bearish market when it's ready to reverse, dn arrow appears on weak bullish market, as a result of reverse expectation. S
Title : Market Bias Indicator - Oscillator-Based Trading Tool Introduction : Discover the potential of the "Market Bias Indicator," a revolutionary oscillator-based trading tool designed for precise market analysis. If you're in search of a robust alternative to traditional bias indicators, your quest ends here. Market Bias Indicator offers unparalleled accuracy in identifying market sentiment and is your gateway to confident trading decisions. Recommended Trading Pairs : Market Bias Indicator i
The   VWAP indicator   is our version of the popular Volume-Weighted Average Price indicator. The VWAP is the ratio between the value traded (price multiplied by the number of volume traded) and the total volume traded over a specific time period. As a result, it measures the average price of the instrument much better than the simple moving average. Although there are many ways to use the VWAP, most investors use it to calculate the daily average.  The indicator works in five modes: Moving  
Старый, добрый "AP" в версии трендового осциллятора. Это простой индикатор, который использует максимум возможностей языка MQL4. Но при этом он работает достаточно быстро даже на процессорах 1 Гигагерц и менее. При анализе следует обращать внимание на пересечение уровня 50, если вы намеренны использовать его как трендовый индикатор. Индикатор не перерисовывает, и работает на всех типах графиков и таймфреймах. Сделаны основные возможности оповещения, оповещения работают в обоих направлениях
The Th3Eng PipFinite indicator is based on a very excellent analysis of the right trend direction with perfect custom algorithms. It show the true direction and the best point to start trading. With StopLoss point and Three Take Profit points. Also it show the right pivot of the price and small points to order to replace the dynamic support and resistance channel, Which surrounds the price. And Finally it draws a very helpful Box on the left side on the chart includes (take profits and Stop loss
The indicator analyzes the change in the minimum and maximum prices of the previous bars fixing the entrance of the big players. If the change (delta) increases, a signal is displayed on the graph in the form of an arrow. At the same time, virtual trade on history is carried out. In case of a repeat of the signal, the positions are increased (refilling). Thus the lot of positions can differ. The results of virtual trading in the form of losses / losses, profitability, drawdown and transaction li
VR Cub
Vladimir Pastushak
VR Cub は、質の高いエントリーポイントを獲得するためのインジケーターです。このインジケーターは、数学的計算を容易にし、ポジションへのエントリーポイントの検索を簡素化するために開発されました。このインジケーターが作成されたトレーディング戦略は、長年にわたってその有効性が証明されてきました。取引戦略のシンプルさはその大きな利点であり、初心者のトレーダーでもうまく取引することができます。 VR Cub はポジション開始ポイントとテイクプロフィットとストップロスのターゲットレベルを計算し、効率と使いやすさを大幅に向上させます。取引の簡単なルールを理解するには、以下の戦略を使用した取引のスクリーンショットを見てください。 設定、設定ファイル、デモ版、説明書、問題解決方法は、以下から入手できます。 [ブログ] レビューを読んだり書いたりすることができます。 [リンク] のバージョン [MetaTrader 5] エントリーポイントの計算ルール ポジションをオープンする エントリーポイントを計算するには、VR Cub ツールを最後の高値から最後の安値までストレッチする必要があります。
COSMOS4U Volume MT4
COSMOS4U - D. Vezeris & Co, L.P.
1 (1)
COSMOS4U Volume indicator facilitates your trade decisions. It gives confirmation of the running movement and market trends. It highlights current and past accumulation and distribution volumes, comparing them to moving average volume and the highest volume. In addition, it identifies and marks nuances as well as convergence and divergence patterns of bears and bulls in order to provide the market trend and price ranges. The supported features are as follows: Fast Volume Moving Average Slow Volu
This is a new strategy for SUPPLY DEMAND areas It is based on a calculation using the tick volume to detect the big price action in market for both bear /bull actions this smart volume action candles are used to determine the supply and demand areas prices in between main supply and demand lines indicate sideway market  up arrows will be shown when prices moves above the main supply and the secondary supply lines Down arrows will be shown when prices moves below the main demand and the secondary
Mean Reversion Supply Demand Indicator Mean Reversion Supply Demand is the indicator to detect the important supply demand zone in your chart. The concept of supply demand trading relies on the quantity mismatching between buying and selling volumes in the financial market. Typically, supply demand zone serves to predict the turning point. The wave pattern, for any supply demand zone to work as an successful trade, looks like the price must touch the base zone, move away and then return to zone
VN Trade Panel II
Vyacheslav Nekipelov
4 (1)
The new version of the trading panel, which now has the ability to separately close Buy and Sell orders, display targets for all orders on the chart, as well as the ability to use the panel to trade with brokers working on the FIFO rule. Also, the new version adds option buttons for separate management of open orders. It has a convenient visualized interface and intuitive control without a lot of additional tabs to which traders have to be distracted and switch their attention. Thanks to this
インディケータは、フィボナッチのサポートとレジスタンスのレベルを自動的に計算してプロットします。これは、市場分析に最も効果的なツールの1つです。 計算では、選択した期間と時間枠の平均価格データが使用されます。この期間の最小値と最大値は、移動の開始と終了と見なされます。 フィボナッチレベルを使用すると、価格の動きが遅くなったり逆転したりする可能性のある潜在的な参照ポイントを確認できます。つまり、フィボナッチレベルは、さらなる動きを予測したり、ストップ注文や指値注文を行うために使用されます。 パラメーター: PartsShow-現在のバーから表示された履歴レベルの数 CalcPeriod-価格平均期間 SmoothingMethod-価格平均化方法(26オプション) TF-計算に使用される時間枠 LevelColor-レベルラインの色 ZeroLevelColor-ゼロレベルの色 ShowVerticalLine-レベル間の垂直線の表示を有効/無効にします VLineStyle-垂直線のスタイル VLineColor-垂直線の色 ShowInfo-レベルパーセンテージの値に関する情報をラベ
このプロダクトを購入した人は以下も購入しています
まず第一に、この取引インジケーターは再描画されず、再描画されず、遅延しないことを強調する価値があります。これにより、手動取引とロボット取引の両方に理想的なものになります。 ユーザーマニュアル:設定、入力、戦略。 アトミックアナリストは、価格の強さとモメンタムを利用して市場でより良いエッジを見つけるためのPA価格アクションインジケーターです。ノイズや誤ったシグナルを除去し、取引ポテンシャルを高めるための高度なフィルターを備えています。複雑なインジケーターの複数のレイヤーを使用して、アトミックアナリストはチャートをスキャンし、複雑な数学的計算をシンプルなシグナルと色に変換します。これにより、どのような初心者トレーダーでも理解して使用し、一貫した取引の決定を行うことができます。 「アトミックアナリスト」は、新規および経験豊富なトレーダー向けにカスタマイズされた包括的な取引ソリューションです。プレミアムインジケーターとトップノッチの機能を1つの取引戦略に組み合わせ、すべてのタイプのトレーダーにとって汎用性のある選択肢にします。 デイリートレーディングとスキャルピング戦略:高
An exclusive indicator that utilizes an innovative algorithm to swiftly and accurately determine the market trend. The indicator automatically calculates opening, closing, and profit levels, providing detailed trading statistics. With these features, you can choose the most appropriate trading instrument for the current market conditions. Additionally, you can easily integrate your own arrow indicators into Scalper Inside Pro to quickly evaluate their statistics and profitability. Scalper Inside
現在26%オフ 初心者やエキスパートトレーダーに最適なソリューション! このインジケーターは、独自の機能と新しい計算式を取り入れた、ユニークで高品質、かつ手頃な価格のトレーディングツールです。たった1枚のチャートで28の為替ペアの通貨強度を読み取ることができます。新しいトレンドやスキャルピングチャンスの引き金となるポイントを正確に特定することができるので、あなたのトレードがどのように改善されるか想像してみてください。 ユーザーマニュアルはこちら  https://www.mql5.com/en/blogs/post/697384 これが最初の1本、オリジナルだ! 価値のないクローンを買わないでください。 特別な サブウィンドウの矢印で強い通貨の勢いを表示 GAPがあなたのトレードを導く! 基準通貨や気配値が売られすぎ・買われすぎのゾーン(外相フィボナッチレベル)にあるとき、個別チャートのメインウィンドウに警告表示。 通貨がレンジの外側から反落した場合、プルバック/リバーサルのアラート。 クロスパターンの特別なアラート 複数の時間枠を選択可能で、トレンドを素早く
Reversal First Impulse levels (RFI)    INSTRUCTIONS        RUS       -       ENG              R ecommended to use with an indicator   -   TREND PRO -  Version MT5 A key element in trading is zones or levels from which decisions to buy or sell a trading instrument are made. Despite attempts by major players to conceal their presence in the market, they inevitably leave traces. Our task was to learn how to identify these traces and interpret them correctly. Main functions: Displaying active zones
FX Volume
Daniel Stein
4.6 (35)
mql5と Telegramの モーニング・ブリーフィングで、詳細とスクリーンショットを含む毎日のマーケット・アップデートをご覧 ください! FX Volumeは、ブローカーの視点から市場のセンチメントをリアルに洞察する、最初で唯一の出来高インジケーターです。 ブローカーのような機関投資家が外国為替市場でどのようなポジションをとっているか、COTレポートよりもはるかに速く、素晴らしい洞察を提供します。 この情報をチャート上で直接見ることは、あなたの取引にとって真のゲームチェンジャーであり、画期的なソリューションです。 以下のようなユニークなマーケットデータ洞察から利益を得てください。 比率は 、通貨のロングポジションとショートポジションの比率をパーセントで表示します。 比率の変化は 、選択した期間内のロング比率とその変化率を表示します。 Volumes Totalは 、通貨の取引量(ロングとショート)の合計をロット単位で表示します。 Volumes Long :全通貨のロングポジションの取引量を表示します。 Volumes(ショート )は、全通貨のショートポジションの取引量を表示
TPSpro TRENDPRO  - is a trend indicator that automatically analyzes the market and provides information about the trend and each of its changes, as well as giving signals for entering trades without redrawing! The indicator uses each candle, analyzing them separately. referring to different impulses - up or down impulse. Exact entry points into transactions for currencies, crypto, metals, stocks, indices!  -  Version MT5               DETAILED DESCRIPTION                R ecommended to use with
mql5と Telegramの モーニング・ブリーフィングで、詳細とスクリーンショットを含む毎日のマーケット・アップデートをご覧 ください! FX Power MT4 NGは 、長年の人気を誇る通貨強度計FX Powerの次世代モデルです。 この次世代ストレングスメーターは何を提供するのでしょうか?初代FXパワーの魅力すべて プラス GOLD/XAUの強さ分析 より正確な計算結果 個別に設定可能な分析期間 カスタマイズ可能な計算上限値により、さらに優れたパフォーマンスを実現 もっと見たい人のための特別なマルチインスタンス設定 すべてのチャートでお好みの色を無限に設定可能 数え切れないほどの通知オプションにより、重要なことを見逃すことはありません。 Windows 11とmacOSのスタイルで角を丸くした新しいデザイン 魔法のように動くインジケーターパネル FXパワーの主な機能 すべての主要通貨の強さの完全な履歴 すべての時間枠における通貨の強さの履歴 すべてのブローカーとチャートで同一の計算結果 100%信頼できるリアルタイム計算 -> リペイントなし ドロップダウン・リストから
Enigmera
Ivan Stefanov
5 (2)
エニグメラ:市場の中核 https://www.enigmera.com はじめに このインディケータと取引システムは、金融市場に対する驚くべきアプローチです。ENIGMERAは、フラクタルサイクルを使用して、サポートとレジスタンスレベルを正確に計算します。本格的な蓄積局面を示し、方向性と目標を示します。 トレンド中でも調整中でも機能するシステムです。 どのように作動するのか? ENIGMERAは、支持線・抵抗線、目標線、乖離線の3つのラインで構成されています。このシステムは、過去のデータを現在と未来に外挿する典型的な市場指標とは異なり、現在の完全な画像を提供します。支持線上にある場合、それは本当の支持を意味し、抵抗線上にある場合、それは本当の抵抗を意味する。ある水準が破られた場合、それはトレンドの変化を意味する。再描画はしない。 市場は常に進化しているため、ENIGMERAはその評価ツールを適応させ、定期的に戦略を修正しています。  これにより、すべてのシナリオが徹底的に評価されることが保証されます。この市場指標の独自性は、その能力を見れば明らかです。  ENIGM
This indicator is based on the mathematics of the great trader W.D. Ganna. With its help, you can easily find strong levels by analyzing swings to find the optimal entry point. The indicator works on all instruments and all timeframes. The indicator is fully manual and has control buttons. All you need to do is press the NEW button, a segment will appear, which you can place on any movement, swing or even 1 candle that you want to analyze. By placing the segment, press the OK button. A grid (th
現在20%OFF! 初心者やエキスパートトレーダーのためのベストソリューション! このダッシュボードソフトウェアは、28の通貨ペアで動作しています。それは私達の主要な指標(高度な通貨の強さ28と高度な通貨インパルス)の2に基づいています。それは全体の外国為替市場の大きい概観を与えます。それは、すべての(9)時間枠で28の外国為替ペアのための高度な通貨の強さの値、通貨の動きの速度と信号を示しています。チャート上で1つのインディケータを使用して市場全体を観察し、トレンドやスキャルピングの機会をピンポイントで見つけることができたら、あなたのトレードがどのように改善されるか想像してみてください。 このインディケータには、強い通貨と弱い通貨の識別、潜在的な取引の識別と確認がより簡単になるような機能が搭載されています。このインディケータは、通貨の強さや弱さが増加しているか減少しているか、また、すべての時間枠でどのように機能しているかをグラフィカルに表示します。 新機能として、現在の市場環境の変化に適応するダイナミックなマーケットフィボナッチレベルが追加され、すでに当社のAdvan
Advanced Supply Demand
Bernhard Schweigert
4.92 (311)
現在33%オフ 初心者にもエキスパートトレーダーにも最適なソリューション このインジケーターは独自の機能と新しい公式を多数内蔵しており、ユニークで高品質かつ手頃な取引ツールです。このアップデートでは、2つの時間枠ゾーンを表示できるようになります。より長いTFだけでなく、チャートTFとより長いTF(ネストゾーンを表示)の両方を表示できます。すべてのSupply Demandトレーダーの皆さんのお気に召すはずです。:) 重要情報の公開 Advanced Supply Demandの可能性を最大化するには、 https://www.mql5.com/ja/blogs/post/720245 にアクセスしてください。   エントリーまたはターゲットの正確なトリガーポイントを正確に特定できれば取引がどのように改善されるか想像してみてください。新しい基盤となるアルゴリズムに基づいて構築されているため、買い手と売り手の間の潜在的な不均衡をさらに簡単に特定できます。これは、最も強い需要と供給のゾーンと、過去のパフォーマンス(古いゾーンを表示)がグラフィカルに表現されるためです。これらの機能は、最適
これはMT4のインジケーターで、再描画なしで取引に参入するための正確なシグナルを提供します。 外国為替、暗号通貨、金属、株式、インデックスなど、あらゆる金融資産に適用できます。かなり正確な見積もりを提供し、取引を開始して終了するのに最適な時期を教えてくれます。1つのシグナルを処理しただけでインジケーターの元が取れた例の 動画 (6:22)をご覧ください。Entry PointsPro インジケーターの助けを借りたほとんどのトレーダーの最初の1週間の結果が改善しています。 Telegramグループ に登録してください。Entry Points Proインジケーターのメリットは次の通りです。 再描画のないエントリーシグナル 再描画されるインジケーターでは一度表示されたシグナルが削除されて大きな金銭的損失につながることがありますが、これと異なり、表示されて確認されたシグナルは消えることがありません。 エラーなしの取引開始 インジケーターアルゴリズムによって取引を開始する(資産を売買する)理想的な瞬間を見つけることができます。それを使用するすべてのトレーダーの成功率が向上します。
現在31%オフ! 初心者やエキスパートトレーダーに最適なソリューション! このインジケータは、独自の機能と秘密の数式を組み込んだ、ユニークで高品質かつ手頃な価格のトレーディングツールです。たった1枚のチャートで28の通貨ペアのアラートを表示します。新しいトレンドやスキャルピングチャンスの引き金となるポイントを正確に把握することができるので、あなたのトレードがどのように改善されるか想像してみてください! 新しい基本的なアルゴリズムに基づいて構築されているため、潜在的な取引の特定と確認がより簡単になります。これは、通貨の強さや弱さが加速しているかどうかをグラフィカルに表示し、その加速のスピードを測定するためです。加速すると物事は明らかに速く進みますが、これはFX市場でも同じです。つまり、反対方向に加速している通貨をペアにすれば、利益を生む可能性のある取引を特定することができるのです。 通貨の勢いを示す縦の線と矢印は、あなたの取引の指針となるでしょう。 ダイナミックマーケットフィボナッチ23レベルはアラートトリガーとして使用され、市場の動きに適応します。もしインパルスが黄色
3 Indicators in 1 indicator Strategy based on price action Made specifically for the best forex currency pairs Can be used in the best time frame of the market at a very reasonable price This indicator is basically 3 different indicatos . But we have combined these 3 indicators in 1 indicator so that you can use 3 indicators at the lowest price. All three strategies are based on price action. But based on different trends. Long term, medium term and short term Attributes : No repaintin
TrendMaestro
Stefano Frisetti
5 (3)
note: this indicator is for METATRADER4, if you want the version for METATRADER5 this is the link:  https://www.mql5.com/it/market/product/108106 TRENDMAESTRO ver 2.4 TRENDMAESTRO recognizes a new TREND in the bud, he never makes mistakes. The certainty of identifying a new TREND is priceless. DESCRIPTION TRENDMAESTRO identifies a new TREND in the bud, this indicator examines the volatility, volumes and momentum to identify the moment in which there is an explosion of one or more of these data a
トレンドトレーディング は、タイミングのプルバックとブレイクアウトにより、市場で起こっているトレンドから可能な限り利益を得るように設計された指標です。確立されたトレンドの中で価格が何をしているかを分析することにより、取引の機会を見つけます。 [ インストールガイド | 更新ガイド | トラブルシューティング | よくある質問 | すべての製品 ] 自信を持って効率的に金融市場を取引する むち打ちにならずに確立されたトレンドから利益を得る 収益性の高いプルバック、ブレイクアウト、早期の逆転を認識する この指標は、独自の品質とパフォーマンスを分析します 複数時間枠のダッシュボードを実装します インジケーターは再描画されていません 電子メール/音声/視覚アラートを実装します 確立されたトレンドは多くの取引機会を提供しますが、ほとんどのトレンド指標はそれらを完全に無視しています。インジケーターの解釈はかなり簡単です: (1) トレンドの変化 (2) トレンドの方向への後退 (3) トレンドの方向へのブレイクアウト 赤いダッシュ は下降トレンド中の修正です 青いダッシュ は上昇ト
Full Forex Market View Dashboard
Opengates Success International
5 (2)
FULL FOREX MARKET VIEWダッシュボードインジケーター これは、トレーダーが市場で何が起こっているかを完全に把握できるようにするために作成されたカスタム指標です。 リアルタイム データを使用して市場にアクセスし、取引を成功させるために必要なあらゆる情報を表示します。 インストール: このインジケーターをウィンドウ チャートに添付する前に、MT4 のマーケット ウォッチ パネルに移動し、不要な通貨ペアまたは取引しないすべての通貨ペアを非表示にして、残りをそこに残します。 その理由は、FFMV ダッシュボードが MT4 の気配値表示に表示されるすべての通貨ペアを表示するためです。 最大 30 通貨ペア以下を表示できます。 MT4 の気配値表示でそれ以上だと、FFMV ダッシュボードのフォントと画像がぼやけて変形します。 正しく表示されません。 使用法:      個人取引の場合      バスケット取引の場合 (方法についてはスクリーンショットを参照してください)      複数注文取引にも使用可能      独自の取引システムなどから
ECM Elite Channel is a volatility-based indicator, developed with a specific time algorithm, which consists of finding possible corrections in the market. This indicator shows two outer lines, an inner line (retracement line) and an arrow sign, where the channel theory is to help identify overbought and oversold conditions in the market. The market price will generally fall between the boundaries of the channel. If prices touch or move outside the channel, it's a trading opportunity. The
ご紹介   クォンタム トレンド スナイパー インジケーターは 、トレンド反転を特定して取引する方法を変革する画期的な MQL5 インジケーターです。 13年以上の取引経験を持つ経験豊富なトレーダーのチームによって開発されました。     クォンタムトレンドスナイパーインジケーター   は、非常に高い精度でトレンドの反転を識別する革新的な方法で、あなたのトレーディングの旅を新たな高みに押し上げるように設計されています。 ***Quantum Trend Sniper Indicatorを購入すると、Quantum Breakout Indicatorを無料で入手できます!*** クォンタム ブレイクアウト インジケーターは、トレンドの反転を特定するとアラートを発し、矢印を示し、3 つのテイクプロフィットレベルを提案します。 初心者トレーダーにもプロのトレーダーにも適しています。 量子EAチャネル:       ここをクリック MT5のバージョン:       ここをクリック 推奨事項: 期間: すべての時間枠。最良の結果を得るには、
Volatility Trend System - a trading system that gives signals for entries. The volatility system gives linear and point signals in the direction of the trend, as well as signals to exit it, without redrawing and delays. The trend indicator monitors the direction of the medium-term trend, shows the direction and its change. The signal indicator is based on changes in volatility and shows market entries. The indicator is equipped with several types of alerts. Can be applied to various trading
TakePropips Donchian Trend Pro
Eric John Pajarillaga Aldana
4.82 (17)
TakePropips Donchian Trend Pro   (MT4) は、ドンチャン チャネルを使用してトレンドの方向を自動的に検出し、エントリーとエグジットの取引シグナルを提供する強力で効果的なツールです! この多機能インジケーターには、トレンド スキャナー、取引シグナル、統計パネル、スクリーナー、取引セッション、およびアラート履歴ダッシュボードが含まれます。取引シグナルを提供し、チャートを分析する時間を節約するように設計されています! ユーザー マニュアルとインストール ガイドは、ブログ投稿 (   https://www.mql5.com/en/blogs/post/751368   ) からダウンロードできます。 今日は 50% オフ! 98ドルから49ドルに値下げ! このインジケーターは、ストラテジー テスターでテストできます (ビジュアル モードを有効にします)。 詳細については、説明の下にあるビデオ チュートリアルも利用できます。 ご不明な点やサポートが必要な場合は、私に連絡してください。 TakePropips Donchian Trend Pro イン
[ MT5 Version ] Backtesting Simulator Are you tired of spending months on demo or live accounts to test your trading strategies? The Backtesting Simulator is the ultimate tool designed to elevate your backtesting experience to new heights. Utilizing Metatrader historical symbol information, it offers an unparalleled simulation of real market conditions. Take control of your testing speed, test ideas quickly or at a slower pace, and witness remarkable improvements in your testing performance. For
PipFinite Trend PRO
Karlo Wilson Vendiola
4.9 (2777)
Breakthrough Solution For Trend Trading And Filtering With All Important Features Built Inside One Tool! Trend PRO's smart algorithm detects the trend, filters out market noise and gives entry signals with exit levels. The new features with enhanced rules for statistical calculation improved the overall performance of this indicator. Important Information Revealed Maximize the potential of Trend Pro, please visit www.mql5.com/en/blogs/post/713938 The Powerful Expert Advisor Version Automa
Bands Sniper
Abdulkarim Karazon
5 (1)
現在の価格は 10 部のみで、それ以降の価格は 90 ドルとなります 矢印付きのエンベロープとtmaに基づいたバンドスナイパーインジケーターは、動的なサポートとレジスタンスを示し、売買の矢印としてエントリーシグナルも与えるため、多目的のインジケーターです。 デフォルト設定は 1H の時間枠に基づいています。完全なガイドについては購入後にお問い合わせください。 エントリールール: 買い : 1.ローソク足は両バンドの下で終了          2.ローソク足 2 つの上矢印 (金色の矢印とオレンジ色の矢印) を使用して 2 つのバンド内で戻ります。 売り : 1.両方のバンドの上でローソク足で終了          2.ローソク足 2 つの下矢印 (金色の矢印とオレンジ色の矢印) を使用して 2 つのバンド内で閉じます。 TP 1 : ミドルバンドライン TP 2 : 逆バンド SL カップルが矢印の下でピップス 推奨される時間枠は : 15 分以上
Automated Trendlines
Georgios Kalomoiropoulos
5 (16)
トレンドラインは、外国為替取引におけるテクニカル分析の最も重要なツールです。残念ながら、ほとんどのトレーダーはそれらを正しく描画していません。自動トレンドラインインジケーターは、市場のトレンドの動きを視覚化するのに役立つ本格的なトレーダー向けのプロフェッショナルツールです。 トレンドラインには、強気トレンドラインと弱気トレンドラインの2種類があります。 上昇トレンドでは、外国為替トレンドラインは価格変動の最低スイングポイントを介して描画されます。 少なくとも2つの「最低安値」を接続すると、トレンドラインが作成されます。 下降トレンドでは、トレンドラインは価格変動の最も高いスイングポイントを介して描画されます。 少なくとも2つの「最高値」を接続すると、トレンドラインが作成されます。 トレンドラインが壊れたとき? 弱気のろうそくが強気のトレンドラインの下で閉じ、ろうそくの高さがトレンドラインの上にあるとき、強気のトレンドラインは壊れます。 強気のろうそくが弱気のトレンドラインの上で閉じ、ろうそくの安値がトレンドラインの下にあるとき、弱気のトレ
SMCpro VIP MT4  Original Price  $630   ---  Currently Price 25% OFF ( for unlimited use )   BONUS  AUX VIP Club 2024 : Include  EA Airbag  and  Load Data History  to enhance the performance of this tool to its maximum potential  Click Here to Download Files   ( for users only )   Hello World! Introducing.. SMCpro VIP tool and Indicator for MetaTrader 4, designed to revolutionize your trading experience with the ICT Smart Money Concept. This system is meticulously crafted to empower trad
シンプルでありながら効果的なポジション取引戦略であるオーダーブロックの個人的な実装。価格範囲がブレイクアウトの反対方向に違反されていない場合、トレーダーは市場に参入するか、最後の注文ブロックの方向で取引を探す必要があります。わかりやすくするために、開いたブロックは描かれていません。 【 インストールガイド】 アップデートガイド | トラブルシューティング | FAQ | すべての製品 ] 強気のオープンブロックは、新鮮な市場の安値の後の最初の強気のバーです 弱気のオープンブロックは、新鮮な市場の高値の後の最初の弱気のバーです 開いているブロックが壊れるとシグナルが表示され、オーダーブロックになります オーダーブロックが反対側に折れると、反転ブロックになります インジケーターはすべての種類のアラートを実装します 塗り直しや裏塗りはしません 入力パラメータ 期間:新鮮な高値または安値を作成するために必要なバーの量。値が小さいほど、信号が多くなります。 最小ATRフィルター:ATRの乗数として表される、オーダーブロックバーの最小ボディサイズ。 最大ATRフィルター:ATRの乗数と
ご紹介     Quantum Breakout PRO は 、ブレイクアウト ゾーンの取引方法を変革する画期的な MQL5 インジケーターです。 13年以上の取引経験を持つ経験豊富なトレーダーのチームによって開発された Quantum Breakout PROは 、革新的でダイナミックなブレイクアウトゾーン戦略により、あなたの取引の旅を新たな高みに押し上げるように設計されています。 クォンタム ブレイクアウト インジケーターは、5 つの利益ターゲット ゾーンを備えたブレイクアウト ゾーン上のシグナル矢印と、ブレイクアウト ボックスに基づいたストップロスの提案を提供します。 初心者トレーダーにもプロのトレーダーにも適しています。 量子EAチャネル:       ここをクリック MT5バージョン:   ここをクリック 重要!購入後、インストールマニュアルを受け取るためにプライベートメッセージを送ってください。 推奨事項: 時間枠: M15 通貨ペア: GBPJPY、EURJPY、USDJPY、NZDUSD、XAUUSD アカウントの種類: ECN、Raw、また
Advanced Currency Strength Indicator The Advanced Divergence Currency Strength Indicator. Not only it breaks down all 28 forex currency pairs and calculates the strength of individual currencies across all timeframes , but, You'll be analyzing the WHOLE forex market in 1 window (In just 1 minute) . This indicator is very powerful because it reveals the true movements of the market.  It is highly recommended to  analyze charts knowing the performance of individual currencies or the countries ec
このダッシュボードは、選択したシンボルの取引戦略に応じて、スキャルピングと長期モードの両方で、チャート上の需給ゾーンを発見し表示します。さらに、ダッシュボードのスキャナーモードは、一目ですべての希望のシンボルをチェックし、適切なポジションを見逃さないようにするのに役立ちます /  バージョンMT5 無料インディケータ:   Basic Supply Demand 特徴 複数の通貨ペアの取引機会を見ることができ、需給ゾーンの近さに応じてランク付けされた全ペアを明確かつ簡潔に表示します。 色から検出パラメータまで、特定のニーズに合わせてカスタマイズ可能な設定 主な入力 Indicator mode : 新機能を備えたインジケーター・モードまたはパネル・モードから選択。 Symbols : "主要28通貨ペア "または "選択されたシンボル "から選択。 Selected Symbols : カンマで区切られた監視したいシンボル (「EURUSD,GBPUSD,XAUUSD」)。お使いのブローカーがペアに接尾辞または接頭辞を付けている場合は、次の2つのパラメータ(ペア接頭辞または
作者のその他のプロダクト
Description Indicator for MT5 is here. It displays alternative (mathematically calculated) support and resistance levels, as well as the levels the price is most likely to achieve in the near future. The calculation is based on history data, and the quality of quotes is critical when generating lines. The lines built by Magneto Pro and Magneto Weekly Pro do not change on the entire calculation period. Application Magneto Pro can be used both in conjunction with an existing strategy and as a se
Идея индикатора очень проста и скорее всего пригодится тем, кто используют линейный график для технического анализа. Что-бы устранить "неровности" (-: линейного графика и был написан этот индикатор. Линия графика соединяет цены закрытия свечей, как и в классическом линейном графике, но игнорирует цены, которые шли в направлении линии и новый экстремум возникает только тогда, когда цена закрытия последней свечи явно ниже или выше предыдущего значения. Это облегчает визуальное восприятие при поиск
FREE
Magneto Breakdown
Vladimir Blednov
4.75 (4)
Полная версия индикатора находится здесь . Индикатор предназначен для торговли внутри дня. Строит канал по пробою крайних уровней которого вы можете открывать ордер на покупку или продажу. Во флетовом рынке работа ведётся на отбой от этих уровней. Для фильтрации входов используется цветная гибридная скользящая средняя. Настройки по умолчанию предназначены для терминального времени GMT +3 (подходит для большинства брокеров) и для терминалов с пятизначными котировками. Индикация канала и уровней
FREE
Lampropeltis
Vladimir Blednov
4.6 (5)
Lampropeltis is a trend indicator. The algorithm of calculation is based on data from the standard indicators included in the MT4 package and interpretation of patterns formed by these indicators. The settings include a minimum set of parameters: Slow MA - slow MA period; Slow MA method - slow MA smoothing method; Fast MA - fast MA period; Fast MA method - fast MA smoothing method. Change of the signal color to red indicates the possibility of opening a Sell order. Change of the signal color to
FREE
Empty Wall
Vladimir Blednov
3.67 (3)
Индикатор вычисляет наиболее вероятные уровни возврата цены. Может быть использован для установки уровня тейк профит. Рекомендуемый таймфрейм - любой, при соответствующей настройке. Настройки. Period - количество свечей для анализа. Accuracy - точность расчёта уровня в пунктах. Width - размер ценовой метки. Отработка уровней как правило не занимает много времени, уровни достаточно точны при касании и процент возврата цены к ним достаточно высок. Но следует учитывать риск продаж на локальных ми
FREE
Magneto Power MA - трендовый осциллятор. Основан на классическом индикаторе moving average, но при этом имеет нестандартный способ интерпретации. Здесь нет никаких фокусов с пересечениями мувингов, только гибридная работа MA и волатильности инструмента. При этом при должной настройке может составить конкуренцию дорогим и сложным аналогам. По гистограмме индикатора легко определить текущую тенденцию, а так же исчерпало себя движение цены или ещё нет. Настройки индикатора аналогичны классическому
FREE
Индикатор Magneto Weekly Pro отображает: Недельные важные линии поддержки и сопротивления (выделены желтым, красным и синим цветами). Основные недельные цели (выделены белым цветом). Недельные паттерны возврата цены (обозначаются красными флажками). Применение индикатора Magneto Pro можно использовать и как дополнение к существующей стратегии, и как самодостаточную торговую стратегию. Данный продукт состоит из двух индикаторов, работающих на разных временных промежутках, и предназначен для скаль
The arrow indicator 'Magneto Flash" is based on candlestick analysis and does not use built-in terminal indicators. It determines entry points in the current candlestick (a signal can be canceled) and informs about a confirmed signal on the next candlestick. Indicator setup and use Only two parameters can be used for optimization - the hour of the beginning and end of chart analysis period. These data for some instruments will be available in product comments page, but you can easily find your
The Magneto Precision Trend indicator is based on candlestick analysis. It determines the trend change on the previous candle, signal is not redrawn. Indicator setup and use Increasing the Period parameter decreases the indicator sensitivity, resulting in less frequent changes in color but filtering the market noise. However, the trend change signals will arrive visually with a delay. And, conversely, decreasing the value of Period provides more accurate but more frequently changing signals. T
The Magneto Reverse Signal indicator is based on the candlestick analysis. It identifies the reversal points. Indicator setup and use Adjustment of the indicator is reduced to selection of parameters Period (left window of the panel) and Gate (right window of the panel). It is more convenient to adjust the settings using the control panel directly on the chart. In this case, you can immediately see which optimal parameters can be used in the current market. This method is shown in the video in
Индикатор Magneto BCS работает на основе анализа свечей. Определяет точки разворота и продолжение тренда. Основан на простой и стабильной стратегии для внутридневной и среднесрочной работы. Адаптируется к текущей волатильности инструмента. Настройка и работа с индикатором Настройка индикатора сводится к подбору параметров Gate и Size detect . Чем больше значение Gate тем меньше сигналов. Size detect позволяет применить расчёт только к телу свечи либо к полному размеру. Кроме выделенных на гр
GreenRabbit EA Simple - автоматический советник, сочетающий в себе и трендовую и контртрендовую стратегии торговли. В первую очередь советник ищет сигнал на вход в направлении тренда, затем начинает работать алгоритм сопровождения ордеров - перевод в безубыток, перенос стоп уровня. В случае если на рынке преобладает флет советник строит сетку ордеров.     В советнике не используются какие либо индикаторы, только математические модели. Входные параметры содержат минимальный набор настроек, чт
Это продвинутая версия продукта, бесплатная версия находится здесь . Индикатор предназначен для торговли внутри дня. Строит канал по пробою крайних уровней которого вы можете открывать ордер на покупку или продажу. Во флетовом рынке работа ведётся на отбой от этих уровней. Для фильтрации входов используется цветная гибридная скользящая средняя. Настройки по умолчанию предназначены для терминального времени GMT +3 (подходит для большинства брокеров). Индикация канала и уровней ADR появляется нач
Hornet
Vladimir Blednov
The HORNET automated trading advisor was designed to work with the EURUSD pair, but with proper optimization it works successfully on many other currency pairs. The algorithm of work is based on several precise strategies, such as: regression channels on several timeframes, Price Action patterns, following the medium-term trend. The use of several filters, such as: control of the average daily deviation, reversible patterns on higher timeframes, determining the medium-term trend, allows you to
Стратегия Советник открывает отложенные ордера на пробой важных уровней поддержки и сопротивления. Открытие фильтруется специальной тренд следящей функцией. При возникновении противоположных условий отложенные ордера немедленно удаляются. Работа ведётся только в направлении локальных трендов на текущем таймфрейме. Особенности Советник не использует сетку, мартингейл, тиковый скальпинг! Для увеличения доходности - периодически оптимизируйте параметры за 3 последних месяца. Или используйте предлаг
Veles FX - автоматический торговый советник работающий внутри ценовых каналов по текущему тренду. Уникальность алгоритма состоит в том, что применён совершенно нетипичный подход к настраиваемым параметрам. Известно что некоторые параметры рынка изменчивы и стратегии которые работали раньше перестают работать сегодня. Именно поэтому в настройках советника применены коэффициенты, а не пункты, которые позволяют ему адаптироваться под изменчивые условия торговли, опираясь на характер движения той ил
Magneto TC
Vladimir Blednov
1 (1)
Трёхуровневый цифровой фильтр тренда. Индикатор не нуждается в настройке. Просто установите и работайте! Предварительно подберите необходимый рабочий таймфрейм и торговый инструмент, визуально подходящие для торговли. Сигнал не перерисовывается на сформированной свече! Не забудьте посмотреть другие мой продукты - https://www.mql5.com/ru/users/altiveus/seller . Приобретая мои продукты, вы поддерживаете разработку нового программного обеспечения. Так же купив любой мой продукт вы получаете скидку
Сигнал Советник торгует от динамических уровней внутри канала. Ширина канала, уровни тейкпрофит и сетка ордеров подстраиваются под текущую волатильность инструмента. Это позволяет снизить нагрузку на депозит и автоматически скорректировать параметры. Советник не требователен к спреду, и скорости исполнения ордеров. Набор параметров не громоздкий и интуитивно понятный, при этом позволяет полностью контролировать стратегию, манименеджмент и сопровождение ордеров. Требование к счёту
Индикатор Magneto Weekly Pro отображает: Недельные важные линии поддержки и сопротивления (выделены желтым, красным и синим цветами). Основные недельные цели (выделены белым цветом). Недельные паттерны возврата цены (обозначаются красными флажками). Применение индикатора Magneto Pro можно использовать и как дополнение к существующей стратегии, и как самодостаточную торговую стратегию. Данный продукт состоит из двух индикаторов, работающих на разных временных промежутках, и предназначен для скал
Описание Данный индикатор строит (альтернативные, математически рассчитанные) уровни поддержки и сопротивления, а так же уровни, к которым с большой вероятностью придет цена в ближайшее время. Следует обратить внимание на то, что расчет уровней производится на исторических данных, и качество котировок играет важную роль при построении индикатором линий. Замечу, что отрисованные Magneto и Magneto Weekly линии не изменяют свои значения на всем расчетном периоде. Важное изменение! Добавлена функция
フィルタ:
レビューなし
レビューに返信
バージョン 2.0 2019.03.25
Добавлены: сигнальные стрелки на основной график, цветная индикация подтверждающих паттернов, различные виды уведомлений.