MArketWave
- インディケータ
- Vijaya Kumar Hegde
- バージョン: 5.0
- アクティベーション: 5
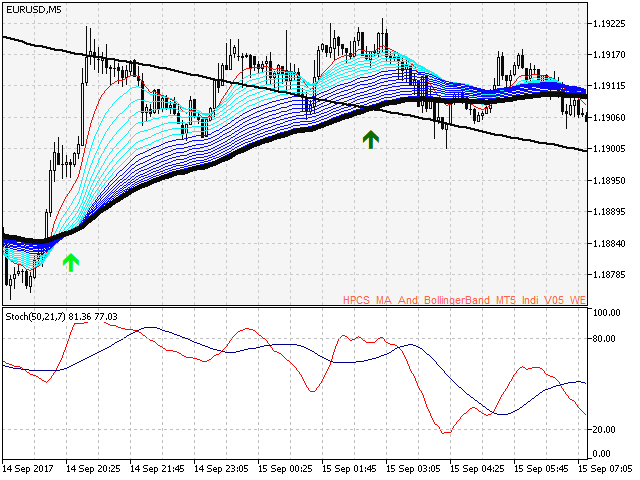
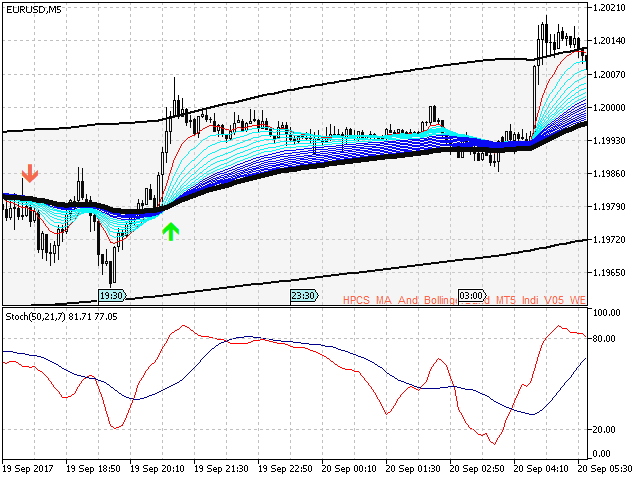
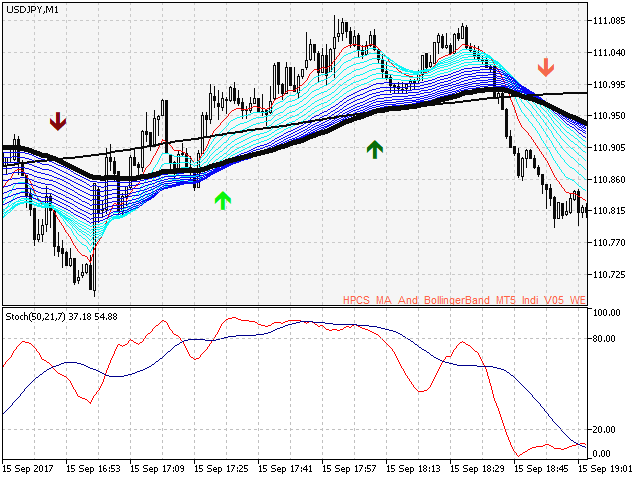
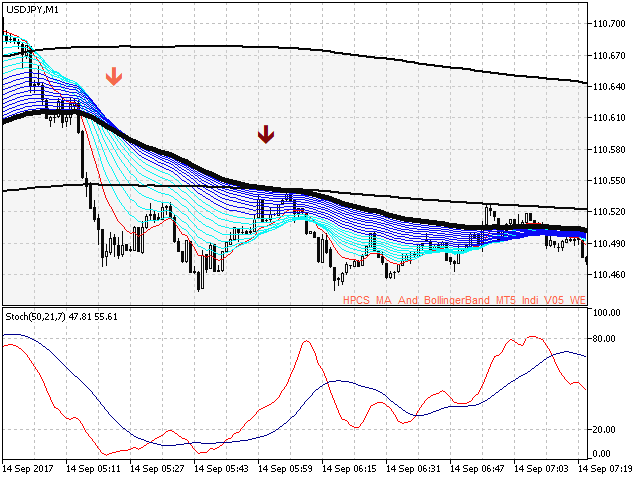
MArketwave is a multicurrency, trend following indicator which combines three of the most commonly used parameters.
Parameters
- Moving Averages
- Bollinger Bands
- Stochastic Oscillator
The parameters have been customized to provide accurate signals.
Signals
- Thick dark green up arrows - Uptrend
- Thin light green up arrows - Buy
- Thick red down arrow - Downtrend
- Thin red down arrow - Sell
Trading tips
- Check the trend with thick arrows
- Buy or sell with thin arrows only in the direction of the main trend
- Stochastic Oscillator is used to assess overbought/oversold conditions
Timeframe
- M1, M5 - for intraday
- H1, H4 - for positional
Risk Management
- Start with 10% of your account balance
- Use martingale on appearance of arrows only
- Opposite color arrows should be the stop loss