CCI normalized
- インディケータ
- Jose Miguel Soriano
- バージョン: 2.10
- アップデート済み: 23 1月 2022
- アクティベーション: 5
Commodity Channel Index Technical Indicator (CCI) measures the deviation of the commodity price from its average statistical price. High values of the index point out that the price is unusually high being compared with the average one, and low values show that the price is too low. In spite of its name, the Commodity Channel Index can be applied for any financial instrument, and not only for the wares.
There are two basic techniques of using Commodity Channel Index:
- Finding the divergences.
The divergence appears when the price reaches a new maximum, and Commodity Channel Index cannot grow above the previous maximums. This classical divergence is normally followed by the price correction. - As an indicator of overbuying/overselling.
Commodity Channel Index usually varies in the range of ±100. Values above +100 inform about overbuying state (and about a probability of correcting fall), and the values below 100 inform about the overselling state (and about a probability of correcting rise).
Calculation
D = Price - SMA (TP, N)
SMA (D, N) = SUM (D, N) / N Simple Moving Average
M = SMA (D, N) * 0,015
CCI = M / D
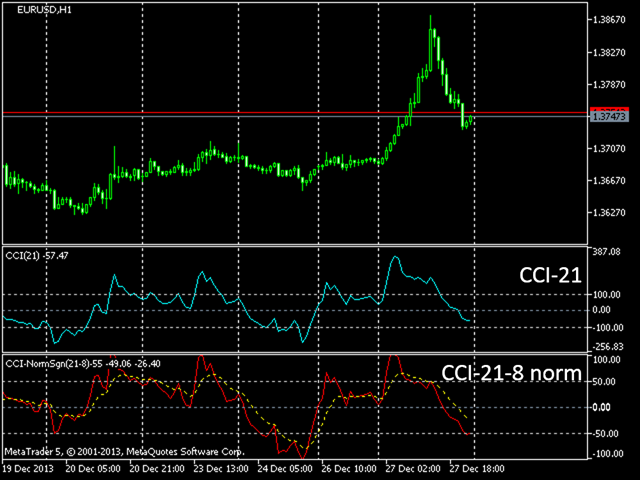
CCI is not an indicator ranging between fixed values and this makes comparison between different markets or time periods more difficult.
To resolve this problem, we normalize values within a given interval.
CCInorm= (CCIreal-CCImin)*(relMax-relMin)/(CCImax-CCImin) + relMin
General Parameters
- Symbol: Set different graphic symbol to study, for example, correlation behavior.
- CCI period: The number of bars to calculate CCI.
- Normalization period: Time interval, over which we calculate the normalization values.
- Period smoothing: Period to calculate signal line (EMA).
- TimeFrame: Provides the vision of ATR in different frames to the graph.
- Maximum level: Maximum level normalized CCI (100 by default).
Advantages
- Reports the level of volatility in a relative way: more than yesterday, less than a month ago, etc.
- Facilitates the study of volatility compared between different pairs.
- Reports the level of correlation between different pairs visually.
