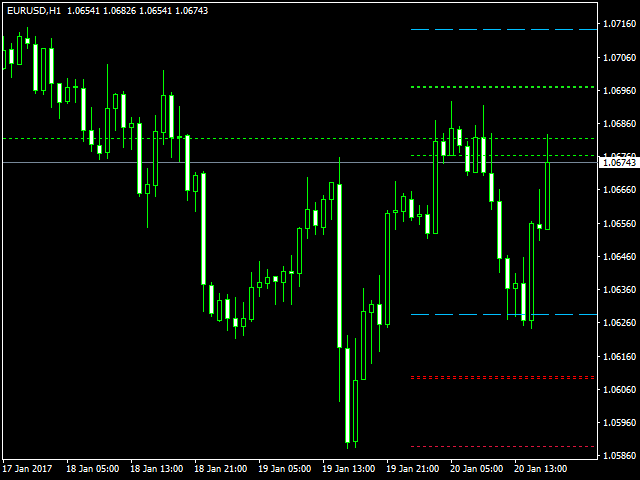
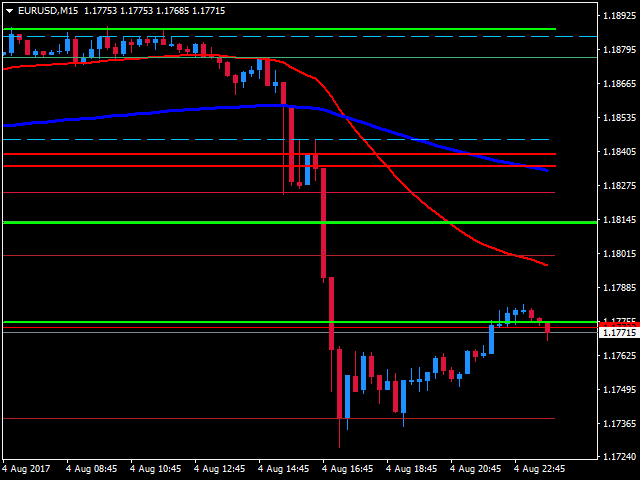
Pivot Cluster
- インディケータ
- Christian Berggruen
- バージョン: 1.0
- アクティベーション: 5
Pivot points are prominent lines which are based on the course itself to determine possible support and resistance.
Unfortunately there is more than one method to calculate them.
Considering the different pivot points, (e.g. Fibonacci pivots) you can see some commonalities at some prices.
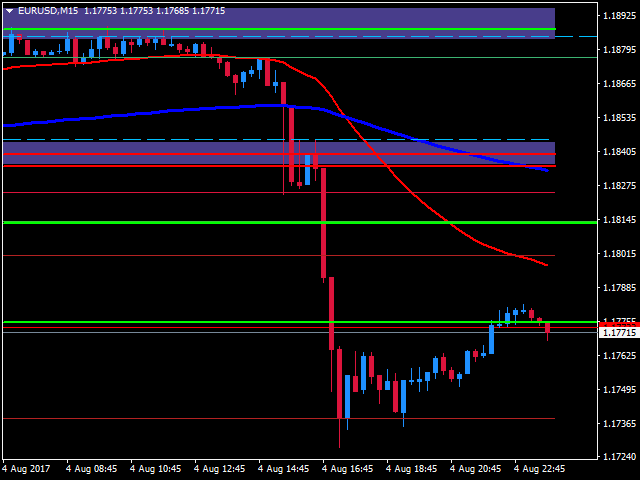
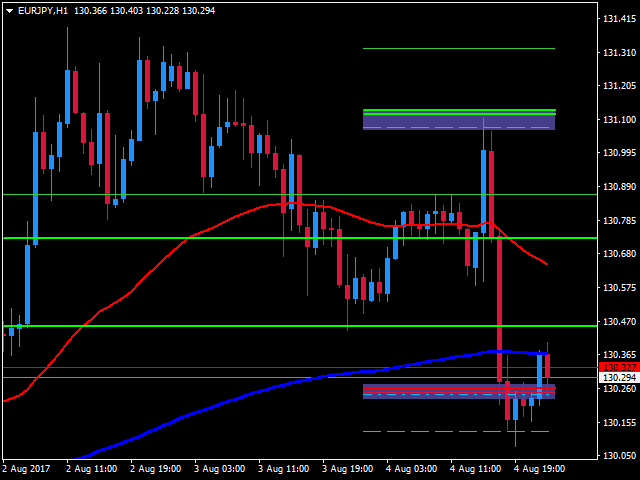
In this case you can see possible support and resistance zones better.
This indicator allows you to see these zones. It shows you the pivot points with classic and Fibonacci calculation to determine these zones.
Additional it shows you the statistical bandwidth and its extension.
Functions
- Classic pivot points on daily and weekly base
- Fibonacci pivot points on daily and weekly base
- Statistical Bandwidth on daily and weekly base
- Statistical Bandwidth Extension on daily and weekly base
- Configuration of line styles
- Configuration of colors
- Set single functions on or off
Important parameters
Next to the parameters for colours and line styles there are some more
- Classic = switch for classic daily pivot s/r lines
- Fibonacci = switch for Fibonacci daily pivot s/r lines
- W1Classic = switch for classic weekly pivot s/r lines
- W1Fibonacci = switch for Fibonacci weekly pivot s/r lines
- Bandwidth = switch for the daily bandwidth
- W1Bandwidth = switch for the weekly bandwidth
- HiLoExtension = switch for the show/hide the extensions for the weekly AND daily bandwidth
- Pivots = switch for pivot points
- DaysToLookBack = amount of days in the past to calculate the statistical bandwidth and extension
