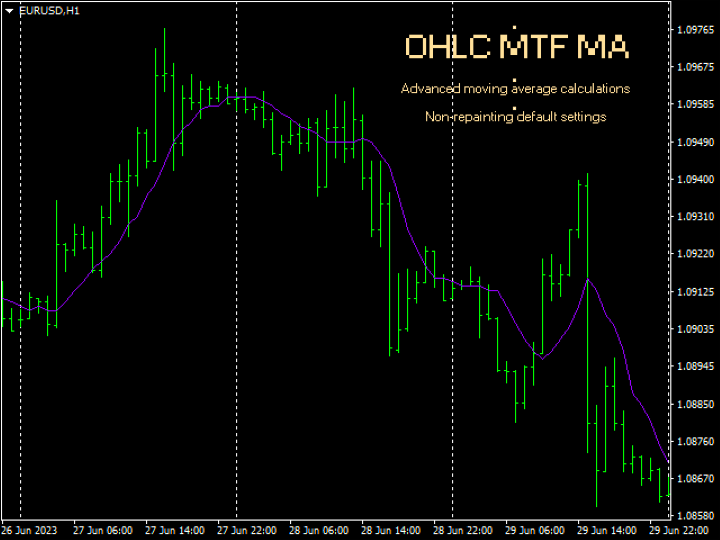
OHLC Moving MTF Average
- インディケータ
- Brian Lillard
- バージョン: 8.0
- アップデート済み: 24 9月 2023
- アクティベーション: 20
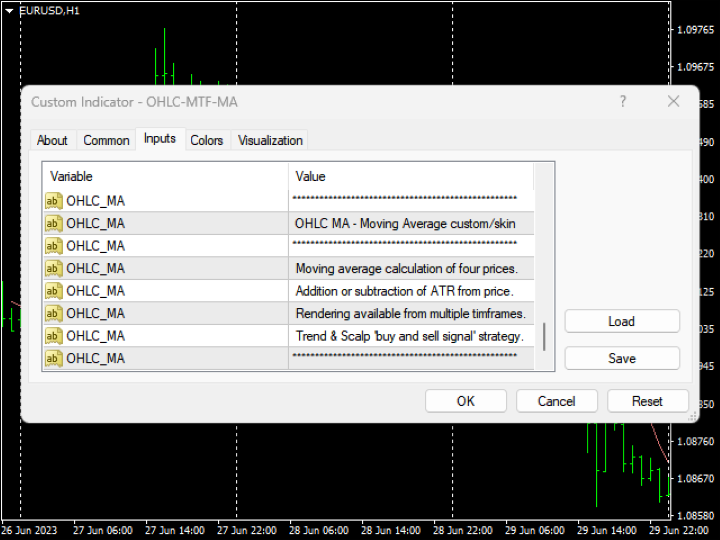
The 'OHLC Moving MTF Average' indicator comes from the age old 'Moving Average ' strategy with signals available.
There are many settings available to customize exactly how you would like to invent your own moving average algo.
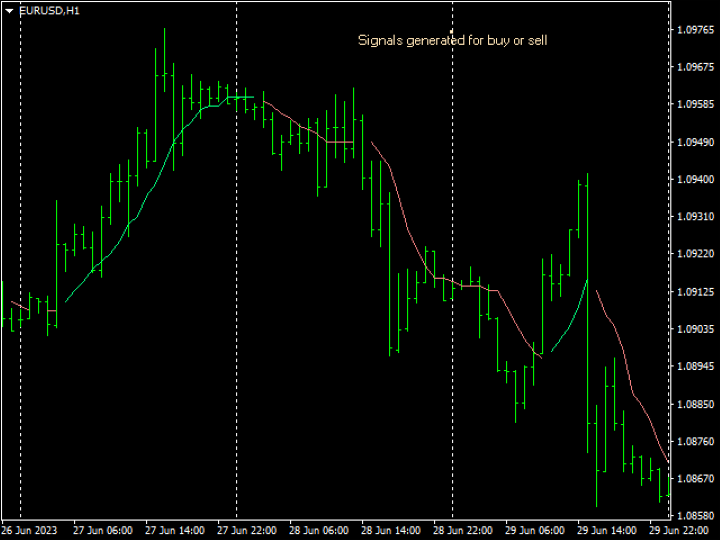
An advanced customizable stock moving average replacement and also comes with a tradable colorful signal strategy.
Default settings; using custom OHLC moving average calculations; generates non-repainting trends & scalping signals.
Key Features
- Four prices with a divider to produce a single moving average price.
- Each price has its own exclusive settings (except timeframe & ATR).
- There are additional settings that provide advanced effects, such as:
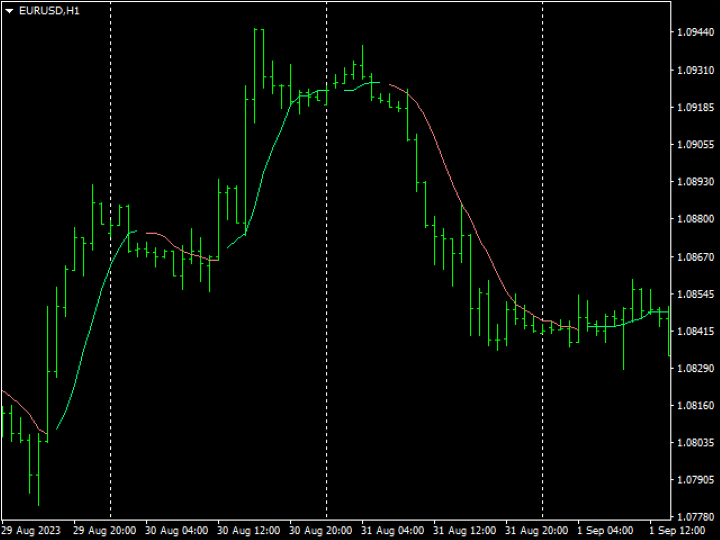
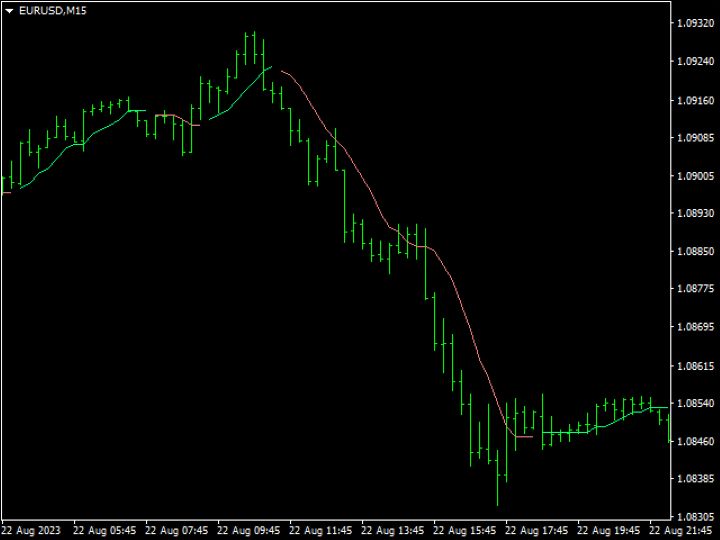
- Colorful signals with a 1 bar confirmation of directions @ bar 0.
- Bar shift that takes prices from historical data (less repaint?).
- Price multiplier for four prices and a sum divider for one price.
- ATR indicator price +/- to adjust the price higher or lower.
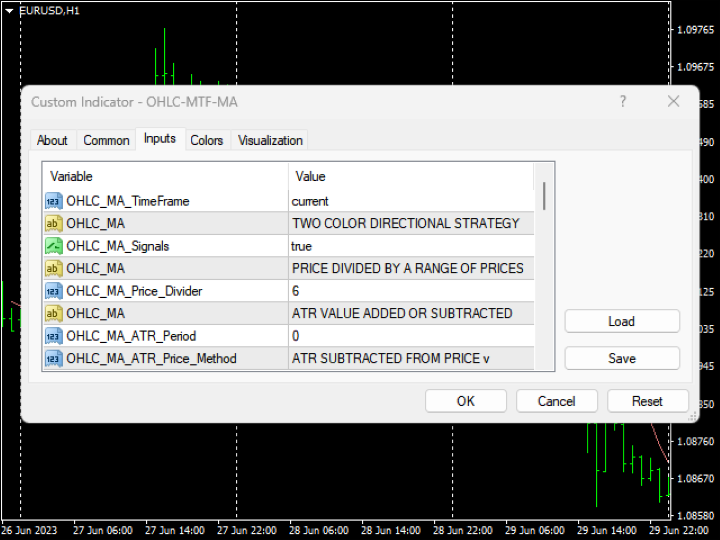
Input Parameters
- MA TimeFrame = PERIOD_CURRENT; Timeframe of Moving Average.
- MA Colorful = false; Customizable two color moving average line.
- MA Price Divider = 6; Sum divider of four moving averages.
- ATR Period = 0; 0:Off, or ATR for added MA price positioning.
- ATR Price Method = 1; 0:ATR added(UP), 1:ATR subtracted(DN).
- MA1 Period (# of Periods) = 5; Periods of Moving Average calculation.
- MA1 Shift (# of Periods) = 0; Periods of Moving Average shift.
- MA1 Method = 0; 0:Simple, Exponential, Smoothed, Linear Weighted.
- MA1 Price = 0; 0:Close, Open, High, Low, Median, Typical, Weighted.
- MA1 Price Multiple = 3; Must be 1 or higher.
- MA1 Bars Back = 0; 0: Current bar, reads historical bars.
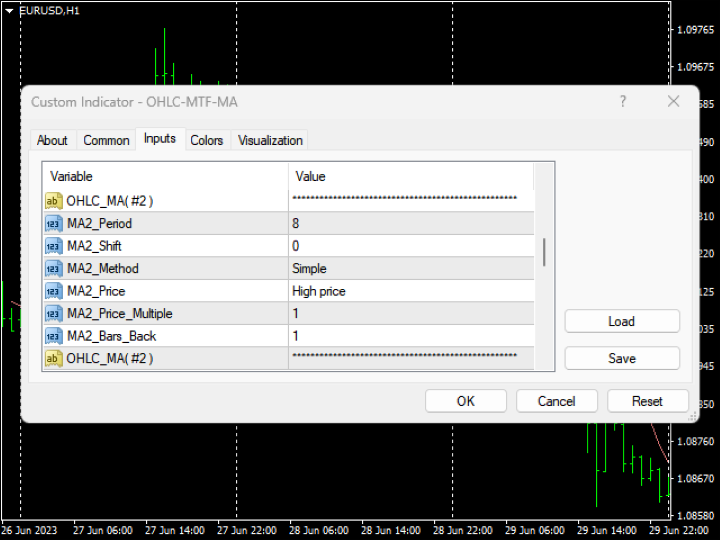
- MA2 Period (# of Periods) = 8; Periods of Moving Average calculation.
- MA2 Shift (# of Periods) = 0; Periods of Moving Average shift.
- MA2 Method = 0; 0:Simple, Exponential, Smoothed, Linear Weighted.
- MA2 Price = 1; 0:Close, Open, High, Low, Median, Typical, Weighted.
- MA2 Price Multiple = 1; Must be 1 or higher.
- MA2 Bars Back = 1; 0: Current bar, reads historical bars.
- MA3 Period (# of Periods) = 8; Periods of Moving Average calculation.
- MA3 Shift (# of Periods) = 0; Periods of Moving Average shift.
- MA3 Method = 0; 0:Simple, Exponential, Smoothed, Linear Weighted.
- MA3 Price = 2; 0:Close, Open, High, Low, Median, Typical, Weighted.
- MA3 Price Multiple = 1; Must be 1 or higher.
- MA3 Bars Back = 1; 0: Current bar, reads historical bars.
- MA4 Period (# of Periods) = 8; Periods of Moving Average calculation.
- MA4 Shift (# of Periods) = 0; Periods of Moving Average shift.
- MA4 Method = 0; 0:Simple, Exponential, Smoothed, Linear Weighted.
- MA4 Price = 3; 0:Close, Open, High, Low, Median, Typical, Weighted.
- MA4 Price Multiple = 1; Must be 1 or higher.
- MA4 Bars Back = 1; 0: Current bar, reads historical bars.
Integration
- There are three buffers, 0 to 2, which represents a value of MTF-OHLC-MA.
Improvements
- Please be sure to leave any ideas, tips and suggestions in the "Reviews" section and they may be included.
- Improvements to the system could be at any time so we suggest that you possibly backup your copies.


ユーザーは評価に対して何もコメントを残しませんでした