• 概要
  • レビュー (44)
  • コメント (17)
  • 最新情報

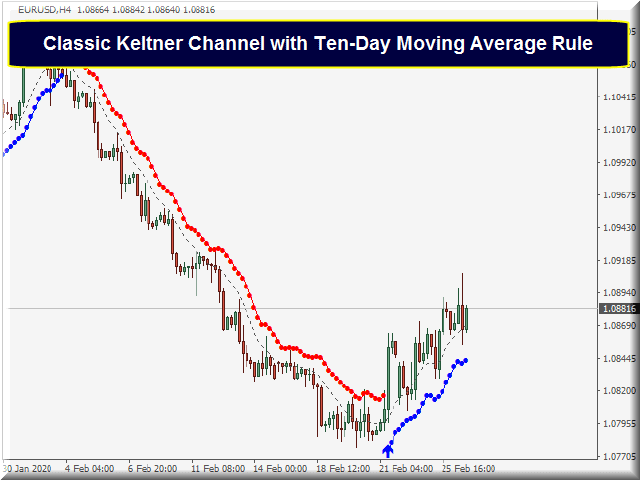
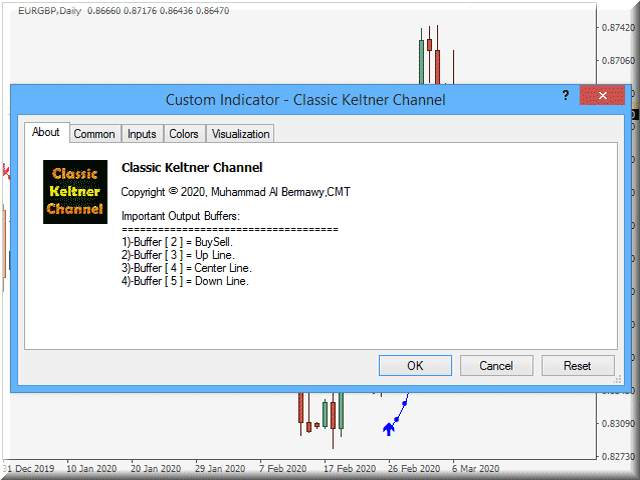
Classic Keltner Channel

4.9

または CKC。

この指標は、Chester W. Keltner(1909–1998)によって記述された古典的な10日間の移動平均ルールに応じて機能します。すべてのパラメーターはデフォルトでクラシックバージョンのケルトナーシステムに設定されていますが、ユーザーは必要に応じてパラメーターを変更できます。

重要な情報

    CKCマニュアルを読む:https://www.mql5.com/en/blogs/post/736577
        CKCエキスパートアドバイザーの例:https://www.mql5.com/en/blogs/post/734150


          Keltner ChannelFormulaについて

          1.標準価格(=(高+低+終値)/ 3)から単純移動平均として中心線を計算します。

          2.同じ期間と中心線の計算方法を使用して、高値と安値の平均差である平均日次範囲(ADR)を計算します。

          3.ケルトナー購入ライン=センターライン+ ADR。

          4.ケルトナーセルライン=センターライン–ADR。


          Keltner10日移動平均ルール

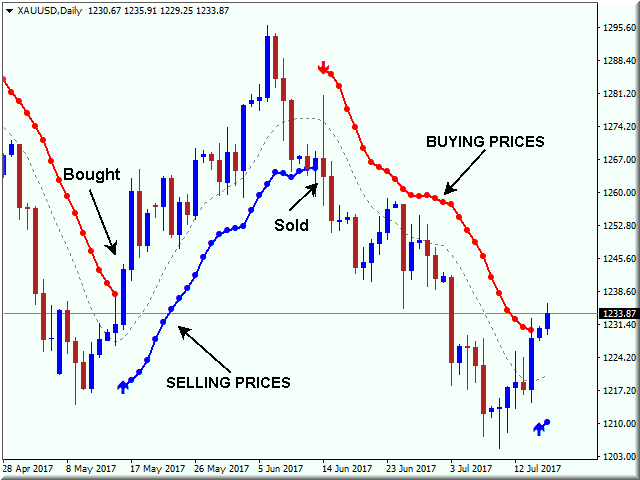
          ケルトナーの公式は、チャート上に2つの基本的な線を作成することにつながります。

            1.ケルトナーバイライン。これは、売りポジションをカバーして買いに行くラインです。

            2.ケルトナーセルライン。これは、買いポジションをカバーして売りに行くラインです。

              これらの2つのラインを使用することにより、テクニカル分析で広く使用されている「スタートとリバース」の原則に依存する取引ルールが得られました。

                1.価格ラインがケルトナー購入ライン(赤い線)の上で閉じたら、購入します。 Keltner Sell Line(青い線)をストップとして使用し、買いから売りへと逆戻りします。

                2.価格ラインがケルトナー売りライン(青い線)の下で閉じたら、売ります。 Keltner Buy Line(赤い線)をストップとして使用し、売りから買いに逆戻りします。
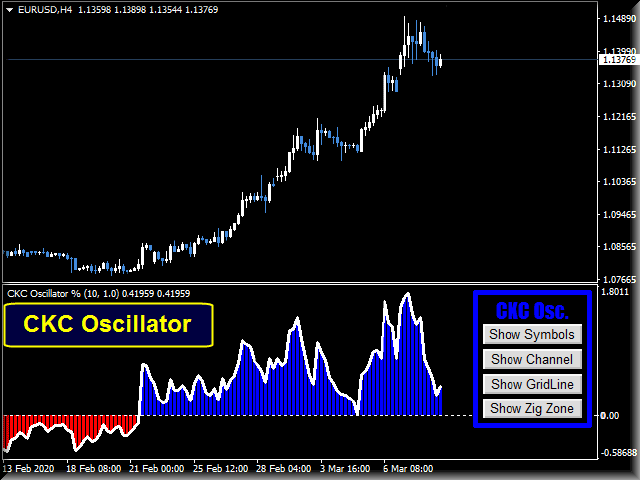
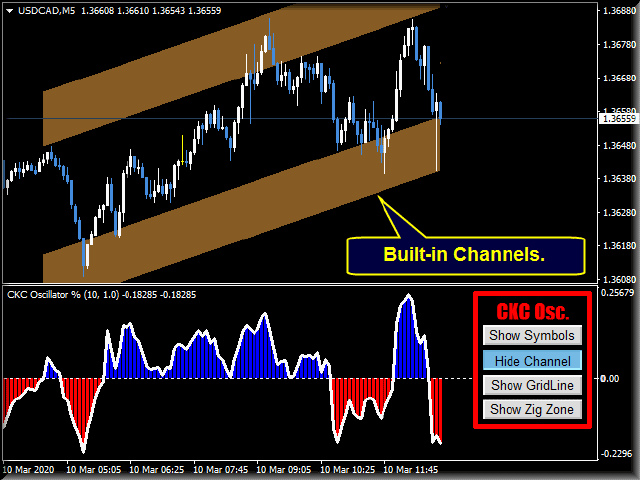
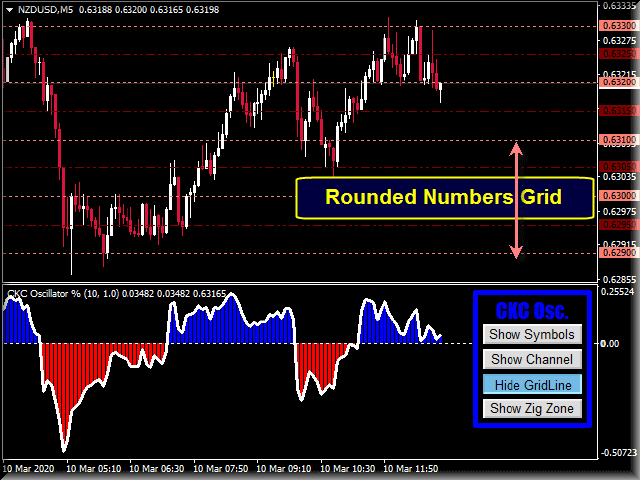
                  CKCの機能

                    CKCは、結果を再描画または再計算しません。

                    それは暗号通貨、株式、指数、石油、金、そしてすべての時間枠で機能します。

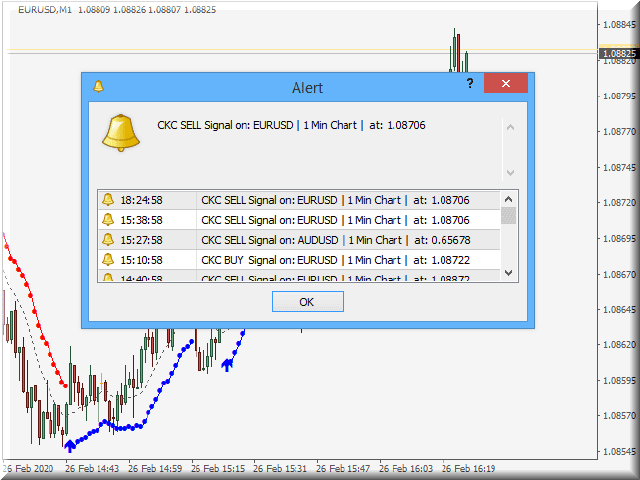
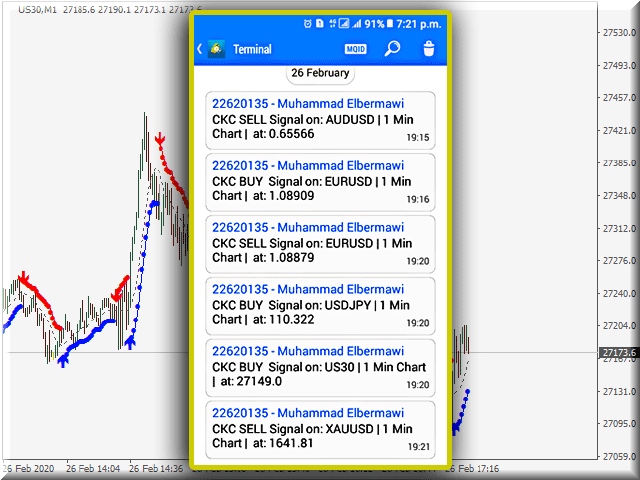
                    サウンド、電子メールアラート、モバイル通知。

                    トレンドシグナルを特定するのに役立つ矢印を売買します。

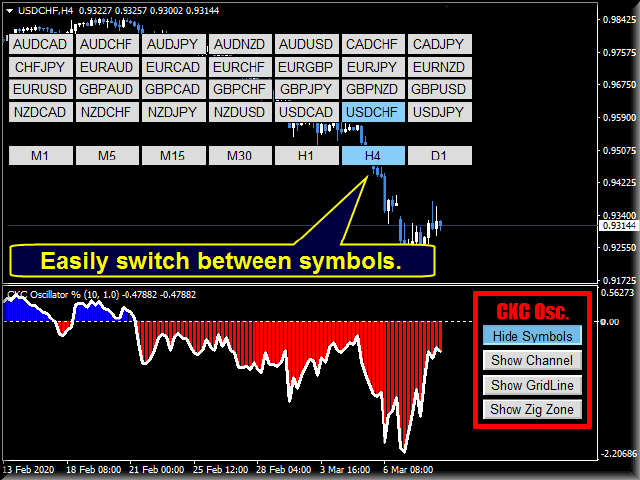
                    ユーザーがそれらの間を簡単にナビゲートできるように適切に設計されたパラメーター。

                    独自のエキスパートアドバイザーを構築するためのバッファー。

                    から選択する4つの異なるカラーリスト。

                    CKCパラメータ

                    (1)インジケーターパラメータ

                    • CKCキャンドル。バンド計算で使用されるキャンドルの数(デフォルトは10キャンドル)。
                    • CKC範囲乗数。Keltnerの購入/販売ラインが中心線からどれだけ離れているか(デフォルトは1.0)。
                    • CKC移動平均法。計算に使用される移動平均タイプ(単純移動平均がデフォルトです)。
                    • CKC適用価格。ケルトナー中心線の計算で使用される価格(通常の価格がデフォルトです)。

                    (2)アラート

                    • サウンドアラート。警告音とメッセージの使用または停止を選択します(デフォルトはtrue)。
                    • メールを送る。ユーザーに電子メールを送信するオプション(デフォルトはfalse)。
                    • モバイル通知を送信します。ユーザーにモバイル通知を送信するオプション(デフォルトはfalse)。

                    (3)インジケータースタイル

                    • チャートの色のリスト。4つの異なるカラーリストから選択できます(デフォルトは何もしない)。
                    • CKCアッパーバンドカラー。デフォルトは赤です。
                    • CKCローワーバンドカラー。デフォルトは青です。
                    • CKC幅。デフォルトは1です。


                    ご不明な点がございましたら、プライベートメッセージでご連絡いただくか、コメント欄にご記入ください。
                    ムハンマドアルベルマウイ、CMT


                    レビュー 20
                    udayan datta
                    681
                    udayan datta 2024.01.27 11:51 
                     

                    Indicator looks perfectly good and working fine, looking forward to learn it

                    leroy
                    305
                    leroy 2023.06.03 01:25 
                     

                    I started reading about the Keltner Channel and was surprised to see a simple yet effective indicator being sold/rented for a good price. I recently just rented the indicator and plan to test it out with my personal strategy. Thanks for creating this indicator!

                    elite luis
                    3331
                    elite luis 2023.03.06 14:06 
                     

                    Author very responsive and fully provide video tutorial on how to use, add as another layer of confluence nice! Thanks!

                    おすすめのプロダクト
                    Fibonacci retracements can be used to draw support lines, identify resistance levels, place stop-loss orders and set target prices. The Advanced Automatic Fibonacci retracements draws automatically all the levels. You have a lot of options to choose. For exemple you can use the tracements of another time frame (MTF) in the current chart, you can also choose between the closest level or less close to draw the retracements. You can also add 2 levels of your choice. You can add levels extensions o
                    YK-Fibo Pivot Indicator: Trade Smarter with Fibonacci Pivot Points The YK-Fibo Pivot Indicator is a powerful technical analysis tool that combines the precision of Fibonacci retracements with the insights of Pivot Points. Whether you're a novice or seasoned trader, this indicator empowers you to spot profitable opportunities in the market with ease. Why Choose YK-Fibo Pivot? Pinpoint Support & Resistance: By calculating Fibonacci levels based on the previous day's high, low, and close prices, y
                    Classic Fractals indicator for MT4, with additional Trendlines connecting the latest couples of fractals ( fractals are showing highest high, and lowest low on each period) Rules for trendlines: -if new top fractal is below the last one = new resistance line -if new bot fractal is above the last one = new support line -Trendlines can be hidden -Fractals can be hidden Fractal Period = can be both even or uneven number, as it is setting for half (one side) of the bars sequence
                    コアラフィボベースタイムへようこそ     コアラフィボタイムゾーンへようこそ     コアラフィボ時間延長へようこそ     メタトレードのための逃したツールへようこそ! 簡単な紹介: フィボナッチタイムゾーンは、フィボナッチ数列に基づく垂直線です。これらの線は、経過時間に基づいて逆転を予測するメカニズムとして、X軸(日付軸)に沿って伸びています。 多くの場合、開始点としてメジャーローまたはハイが選択されます。距離は比較的小さく始まり、フィボナッチ数列が伸びるにつれて大きくなります。 チャーティストは、フィボナッチタイムゾーンを将来に拡張して、潜在的な逆転ポイントを予測することができます。 このインジケーターは、グーグル検索「Fibo Base Time、Fibo Time Zone、FiboTimeExtention」を介してこれらの名前で見つけることができます。 詳細情報としての基本的な定義:     フィボナッチタイムゾーンは、高、低、または反転が発生する可能性のある潜在的な領域を表す垂直線です。     フィボナッチのタイムゾ
                    FREE
                    トレンドキャッチャー: アラートインジケーター付きのトレンドキャッチャーストラテジーは、市場トレンドやポテンシャルなエントリーポイントやエグジットポイントを特定するのに役立つ多目的な技術分析ツールです。動的なトレンドキャッチャーストラテジーを備えており、市場状況に適応してトレンドの方向を明確に視覚化します。トレーダーは、自身の好みやリスク許容度に合わせてパラメーターをカスタマイズできます。このインジケーターはトレンドの識別を支援し、ポテンシャルなリバーサルをシグナルし、トレイリングストップのメカニズムとして機能し、市場への迅速な対応のためのリアルタイムアラートを提供します。 特徴: - トレンドの識別:上昇トレンドと下降トレンドをシグナルします。 - トレンドのリバーサル:ローソク足の色が上昇から下降に変わった場合やその逆の場合に、ポテンシャルなリバーサルを警告します。 - リアルタイムアラート:新しいトレンドの識別に対するアラートを生成します。 推奨事項: - 通貨ペア:EURUSD、AUDUSD、XAUUSDなど... - タイムフレーム:H1。 - アカウン
                    FREE
                    Basic Support and Resistance インジケータは、テクニカル分析を強化するために必要なソリューションです。このインジケータを使用すると、チャートにサポートレベルとレジスタンスレベルを投影できます/ mt5バージョン 機能 フィボナッチレベルの統合: サポートと抵抗レベルとともにフィボナッチレベルを表示するオプションを使用すると、私たちの指標は市場行動と逆転領域の可能性についてさらに深い洞察を提供します。 パフォーマンスの最適化: 各バーの開口部のみで拡張ラインを更新するオプションを使用すると、インジケータは、サポートレベルと抵抗レベルの精度を犠牲にすることなく最適なパフォーマンスを保証します。 入力 メイン設定 Timeframe:  この入力を通じて、より高い時間枠のサポートラインとレジスタンスラインをチャート上に表示することを選択できます。 Support/Resistance Strength [Number of Bars]:  この入力を使用して、サポートと抵抗の強度を決定できます。数が高いほど、サポート/抵抗がより強くなります。 Pri
                    Murrey Math Multi Timeframe Indicator Support/Resistance  Murrey Math Lines are strong tools to plot the support and resistance levels. Murrey Math Multi Timeframe Indicator draws multi timeframe MM lines on a smaller tf chart. General Information: According to Gann, prices move in 1/8's, these 1/8's act as points of price support and resistance as an entity's price changes in time. Given this 1/8 characteristic of price action, Murrey assigns properties to each of the MML's in an a given
                    VR Cub
                    Vladimir Pastushak
                    VR Cub は、質の高いエントリーポイントを獲得するためのインジケーターです。このインジケーターは、数学的計算を容易にし、ポジションへのエントリーポイントの検索を簡素化するために開発されました。このインジケーターが作成されたトレーディング戦略は、長年にわたってその有効性が証明されてきました。取引戦略のシンプルさはその大きな利点であり、初心者のトレーダーでもうまく取引することができます。 VR Cub はポジション開始ポイントとテイクプロフィットとストップロスのターゲットレベルを計算し、効率と使いやすさを大幅に向上させます。取引の簡単なルールを理解するには、以下の戦略を使用した取引のスクリーンショットを見てください。 設定、設定ファイル、デモ版、説明書、問題解決方法は、以下から入手できます。 [ブログ] レビューを読んだり書いたりすることができます。 [リンク] のバージョン [MetaTrader 5] エントリーポイントの計算ルール ポジションをオープンする エントリーポイントを計算するには、VR Cub ツールを最後の高値から最後の安値までストレッチする必要があります。
                    The PUA MultiType Pivot indicator is built on the daily chart of the previous day. The PUA MultiType Pivot indicator is one of the most popular tools in technical analysis, used by traders to identify potential reversal points in financial markets. This indicator constructs three types of Pivot points: Classic, Fibonacci, and Camarilla, each offering its unique approach to market analysis. The advantages of this indicator include: Simplicity and Clarity PUA MultiType Pivot provides clearly defi
                    Noize Absorption Index - is the manual trading system that measures the difference of pressure between bears forces and bulls forces. Green line - is a noize free index that showing curent situation. Zero value of index shows totally choppy/flat market.Values above zero level shows how powerfull bullish wave is and values below zero measures bearish forces.Up arrow appears on bearish market when it's ready to reverse, dn arrow appears on weak bullish market, as a result of reverse expectation. S
                    Automatic fibonacci with alerts is an indicator that automatically plots a fibonacci retracement based on the number of bars you select on the BarsToScan setting in the indicator. The fibonacci is automatically updated in real time as new highest and lowest values appear amongst the selected bars. You can select which level values to be displayed in the indicator settings. You can also select the color of the levels thus enabling the trader to be able to attach the indicator several times with d
                    Free automatic Fibonacci is an indicator that automatically plots a Fibonacci retracement based on the number of bars you select on the BarsToScan setting in the indicator. The Fibonacci is automatically updated in real time as new highest and lowest values appears amongst the selected bars. You can select which level values to be displayed in the indicator settings. You can also select the color of the levels thus enabling the trader to be able to attach the indicator several times with differe
                    FREE
                    TWO PAIRS SQUARE HEDGE METER INDICATOR Try this brilliant 2 pairs square indicator It draws a square wave of the relation between your two inputs symbols when square wave indicates -1 then it is very great opportunity to SELL pair1 and BUY Pair2 when square wave indicates +1 then it is very great opportunity to BUY pair1 and SELL Pair2 the inputs are : 2 pairs of symbols         then index value : i use 20 for M30 charts ( you can try other values : 40/50 for M15 , : 30 for M30 , : 10 for H1 ,
                    Automatic redrawing of Trend Supports and resistances levels and Possible Wedge pattern formation to indicate price breaking of Rising Wedge (signal SELL) or price breaking of falling Wedge (signal BUY) Very simple and smart indicator  ALERTS AND MOBILE NOTIFICATIONS availavle !!! you can edit the calculation bars of the bars count for formation of the trend lines and the initial shift from current price  Smaller values for bars /shift inputs when using Higher Time frames (D1-H4) and the reverse
                    これは、キャンドルの終値を予測する指標です。 このインジケータは、主にD1チャートでの使用を目的としていますが. この指標は、従来の外国為替取引とバイナリオプション取引の両方に適しています。 インジケーターは、スタンドアロンのトレーディングシステムとして使用することも、既存のトレーディングシステムへの追加として機能させることもできます。 このインジケーターは、現在のキャンドルを分析し、キャンドル自体の内部の特定の強度係数と、前のキャンドルのパラメーターを計算します。 したがって、この指標は、市場の動きのさらなる方向性と現在のキャンドルの終値を予測します。 この方法のおかげで、この指標は、短期の日中取引だけでなく、中期および長期の取引にも適しています。 インジケーターを使用すると、市場の状況の分析中にインジケーターが生成する潜在的な信号の数を設定できます。 インジケーターの設定には、このための特別なパラメーターがあります。 また、インジケーターは、チャート上のメッセージの形式で、電子メールで、およびPUSH通知の形式で、新しい信号について通知することができます。 購入後は必ず私に書いて
                    This unique multi-currency strategy simultaneously determines the strength of trends and market entry points, visualizing this using histograms on the chart. The indicator is optimally adapted for trading on the timeframes М5, М15, М30, Н1. For the convenience of users, the indicator renders the entry point (in the form of an arrow), recommended take profit levels (TP1, TP2 with text labels) and the recommended Stop Loss level. The take profit levels (TP1, TP2) are automatically calculated for
                    The Th3Eng PipFinite indicator is based on a very excellent analysis of the right trend direction with perfect custom algorithms. It show the true direction and the best point to start trading. With StopLoss point and Three Take Profit points. Also it show the right pivot of the price and small points to order to replace the dynamic support and resistance channel, Which surrounds the price. And Finally it draws a very helpful Box on the left side on the chart includes (take profits and Stop loss
                    DMS Fibo
                    Diogo Mitsunaga Dos Santos
                    Fibonacci retracements are trend lines drawn between two significant points, usually between absolute lows and absolute highs, plotted on a chart. Intersecting horizontal lines are placed at the Fibonacci levels. Fibonacci retracements are useful tools that help traders identify support and resistance levels. With the information gathered, they can place orders, identify stop-loss levels, and set price targets. Although useful, traders often use other indicators to make more accurate assessments
                    This indicator prepared by using 57 days moving averagr and least square method. It can only work for 1 hr time interval. Once a signal created. It is creating order and 2 limit orders. It works in CFD pairs as well as in Forex pairs. You can fins our other products from link : https://www.mql5.com/en/users/drbastem/seller Also, you can ask all your questins from email : haskayafx@gmail.com or mobile : +90 530 867 5076 or @MehmetBastem on telegram application This system is for Long term and pr
                    The new update makes this indicator a complete tool for studying, analyzing and operating probabilistic patterns. It includes: On-chart Multi-asset percentage monitor. Configurable martingales. Twenty-one pre-configured patterns , including Mhi patterns and C3. An advanced pattern editor to store up to 5 custom patterns. Backtest mode to test results with loss reports. Trend filter. Hit operational filter. Martingale Cycles option. Various types of strategies and alerts. Confluence between patte
                    This is the FXTraderariel-TakeProfit - Stop Loss Indicator . It provides you 3 potential Take Profits and 1 Stop Loss. These potential targets are computed based on several methods . The indicator can be used on every time frame, but we advise to use it on H1, H4 and D1. Especially if you are a novice trader. Pro Traders can also you use it for scalping in smaller time frames (M1, M5 and M15). This indicator is not a complete trading system. It doesn't provide you a Signal nor can predict the m
                    The Volumebyprice.com technical indicator for MetaTrader 4 features Volume Profile and Market Profile TPO (Time Price Opportunity). Volume and TPO histogram bar and line charts. Volume Footprint charts. TPO letter and block marker collapsed and split structure charts. Session filtering and grouping. Static, dynamic and flexible range segmentation and compositing methods with relative and absolute visualizations. Graphical layering, positioning and styling options to suit the user's analytic and
                    Was: $249  Now: $99   Market Profile defines a number of day types that can help the trader to determine market behaviour. A key feature is the Value Area, representing the range of price action where 70% of trading took place. Understanding the Value Area can give traders valuable insight into market direction and establish the higher odds trade. It is an excellent addition to any system you may be using. Blahtech Limited presents their Market Profile indicator for the MetaTrader community. Ins
                    Fibonacci SR Indicator This indicator creates support and resistance lines. This indicator is based on Fibonacci Retracement and Extension levels. It will consider many combinations of the Fibonacci levels and draw support/resistance lines based on these. This indicator uses tops and bottoms drawn by the ZigZag indicator in its calculations. The ZigZag can also be drawn on the chart, if necessary. The indicator considers many combinations of past reversal points and Fibonacci ratio levels, and
                    FREE
                    This indicator depends on Fibonacci lines but there is a secret lines i used them, by using FiboRec indicator you will be able to know a lot of important information in the market such as: Features You can avoid entry during market turbulence. You can enter orders in general trend only. You will know if the trend is strong or weak. Signal Types and Frame used You can use this indicator just on H1 frame. Enter buy order in case Candle break out the square area and closed over it, at least 20
                    We present you the indicator "Candle closing counter", which will become your indispensable assistant in the world of trading. That’s why knowing when the candle will close can help: If you like to trade using candle patterns, you will know when the candle will be closed. This indicator will allow you to check if a known pattern has formed and if there is a possibility of trading. The indicator will help you to prepare for market opening and market closure. You can set a timer to create a p
                    Fibonaccitools
                    Aymn Sʿyd Ahmd Hsn Alkwmy
                    フィボナッチリトレースメントは、トレーダーがサポートラインを描き、レジスタンスレベルを特定し、ストップロス注文を出し、目標価格を設定するために使用できる人気のあるツールです。 フィボナッチリトレースメントは、株価チャートの2つの極値を取り、垂直距離を23.6%、38.2%、50%、61.8%、および100%の主要なフィボナッチ比率で割ることによって作成されます。 フィボナッチツールインジケーターはフィボナッチツールを描画します。 リトレースメント、アーク、ファン、拡張、タイムゾーン。 ジグザグインジケーターに基づく」 ʻO nā retrofement Fibonacci nā mea hana kaulana i hiki i nā mea kālepa ke hoʻohana e huki ai i nā laina kākoʻo, ʻike i nā pae kūʻē, hoʻonohonoho i nā kauoha kū-lilo, a hoʻonohonoho i nā kumukūʻai pahuhopu. Hoʻokumu ʻia kahi Fibonacci r
                    This is an intraday indicator that uses conventional formulae for daily and weekly levels of pivot, resistance and support, but updates them dynamically bar by bar. It answers the question how pivot levels would behave if every bar were considered as the last bar of a day. At every point in time, it takes N latest bars into consideration, where N is either the number of bars in a day (round the clock, i.e. in 24h) or the number of bars in a week - for daily and weekly levels correspondingly. So,
                    The indicator allows you to trade binary options. The recommended time frame is М1 and the expiration time is 1,2,3 minutes. The indicator suitable for auto and manual trading. A possible signal is specified as a arrows above/under a candle. You should wait until the candle closes! Arrows are not re-painted Trade sessions: TOKYO section (Half-end) Currency pairs: USD/JPY Working time frame: M1 Expiration time: 1,2,3 minutes. The indicator also shows good results when using the martingale strateg
                    FREE
                    このプロダクトを購入した人は以下も購入しています
                    Gann Made Easy は、ミスター・ギャンの理論を使用した取引の最良の原則に基づいた、プロフェッショナルで使いやすい外国為替取引システムです。 W・D・ガン。このインジケーターは、ストップロスとテイクプロフィットレベルを含む正確な買いと売りのシグナルを提供します。 PUSH通知を利用して外出先でも取引可能です。 購入後はご連絡ください!私の取引のヒントと素晴らしいボーナスインジケーターを無料で共有します! おそらく、ギャンの取引手法についてはすでに何度も聞いたことがあるでしょう。通常、ギャンの理論は初心者のトレーダーだけでなく、すでにある程度の取引経験がある人にとっても非常に複雑なものです。なぜなら、ギャンの取引手法は理論的にはそれほど簡単に適用できるものではないからです。私はその知識を磨き、最良の原則を私の外国為替インジケーターに組み込むために数年を費やしました。 このインジケーターは非常に簡単に適用できます。必要なのは、それをチャートに添付し、簡単な取引推奨事項に従うだけです。このインジケーターは常に市場分析の仕事を行い、取引の機会を探します。適切なエントリーポイントを検出
                    An exclusive indicator that utilizes an innovative algorithm to swiftly and accurately determine the market trend. The indicator automatically calculates opening, closing, and profit levels, providing detailed trading statistics. With these features, you can choose the most appropriate trading instrument for the current market conditions. Additionally, you can easily integrate your own arrow indicators into Scalper Inside Pro to quickly evaluate their statistics and profitability. Scalper Inside
                    現在20%OFF! 初心者やエキスパートトレーダーのためのベストソリューション! このダッシュボードソフトウェアは、28の通貨ペアで動作しています。それは私達の主要な指標(高度な通貨の強さ28と高度な通貨インパルス)の2に基づいています。それは全体の外国為替市場の大きい概観を与えます。それは、すべての(9)時間枠で28の外国為替ペアのための高度な通貨の強さの値、通貨の動きの速度と信号を示しています。チャート上で1つのインディケータを使用して市場全体を観察し、トレンドやスキャルピングの機会をピンポイントで見つけることができたら、あなたのトレードがどのように改善されるか想像してみてください。 このインディケータには、強い通貨と弱い通貨の識別、潜在的な取引の識別と確認がより簡単になるような機能が搭載されています。このインディケータは、通貨の強さや弱さが増加しているか減少しているか、また、すべての時間枠でどのように機能しているかをグラフィカルに表示します。 新機能として、現在の市場環境の変化に適応するダイナミックなマーケットフィボナッチレベルが追加され、すでに当社のAdvan
                    Reversal First Impulse levels (RFI)    INSTRUCTIONS        RUS       -       ENG              R ecommended to use with an indicator   -   TPSpro  TREND PRO -  Version MT5 A key element in trading is zones or levels from which decisions to buy or sell a trading instrument are made. Despite attempts by major players to conceal their presence in the market, they inevitably leave traces. Our task was to learn how to identify these traces and interpret them correctly. Main functions: Displaying activ
                    The AT Forex Indicator MT4 is a sophisticated trading tool designed to provide traders with a comprehensive analysis of multiple currency pairs. This   powerful indicator   simplifies the complex nature of the forex market, making it accessible for both novice and experienced traders. AT Forex Indicator uses   advanced algorithms   to detect trends, patterns and is an essential tool for traders aiming to enhance their forex trading performance. With its robust features, ease of use, and reliabl
                    TPSpro TRENDPRO  - is a trend indicator that automatically analyzes the market and provides information about the trend and each of its changes, as well as giving signals for entering trades without redrawing! The indicator uses each candle, analyzing them separately. referring to different impulses - up or down impulse. Exact entry points into transactions for currencies, crypto, metals, stocks, indices!  -  Version MT5               DETAILED DESCRIPTION                R ecommended to use with
                    mql5と Telegramの モーニング・ブリーフィングで、詳細とスクリーンショットを含む毎日のマーケット・アップデートをご覧 ください! FX Power MT4 NGは 、長年の人気を誇る通貨強度計FX Powerの次世代モデルです。 この次世代ストレングスメーターは何を提供するのでしょうか?初代FXパワーの魅力すべて プラス GOLD/XAUの強さ分析 より正確な計算結果 個別に設定可能な分析期間 カスタマイズ可能な計算上限値により、さらに優れたパフォーマンスを実現 もっと見たい人のための特別なマルチインスタンス設定 すべてのチャートでお好みの色を無限に設定可能 数え切れないほどの通知オプションにより、重要なことを見逃すことはありません。 Windows 11とmacOSのスタイルで角を丸くした新しいデザイン 魔法のように動くインジケーターパネル FXパワーの主な機能 すべての主要通貨の強さの完全な履歴 すべての時間枠における通貨の強さの履歴 すべてのブローカーとチャートで同一の計算結果 100%信頼できるリアルタイム計算 -> リペイントなし ドロップダウン・リストから
                    通貨強さウィザードは、取引を成功させるためのオールインワン ソリューションを提供する非常に強力な指標です。このインジケーターは、複数の時間枠のすべての通貨のデータを使用して、このまたはその外国為替ペアのパワーを計算します。このデータは、使いやすい通貨インデックスと通貨パワーラインの形式で表され、特定の通貨のパワーを確認するために使用できます。 必要なのは、取引したいチャートにインジケーターを接続することだけです。インジケーターは、取引する通貨の実際の強さを示します。このインジケーターは、トレンドに合わせて取引するときに有利に利用できる売買高の圧力の極値も示します。このインジケーターには、フィボナッチに基づく可能なターゲットも表示されます。 このインジケーターは、PUSH 通知を含むあらゆるタイプのアラートを提供します。 購入後ご連絡下さい。私の取引のヒントをあなたと共有し、素晴らしいボーナスインジケーターを無料で提供します! 幸せで有益な取引をお祈りします。
                    市場の2つの基本原則に基づく日中戦略。 このアルゴリズムは、追加のフィルターを使用したボリュームと価格の波の分析に基づいています。インディケータのインテリジェントアルゴリズムは、2つの市場要因が1つに結合した場合にのみシグナルを出します。インディケータは、より高い時間枠のデータを使用して、M1チャート上の特定の範囲の波を計算します。そして波を確認するために、インジケーターはボリュームによる分析を使用します。 このインディケータはレディトレーディングシステムです。トレーダーが必要とするのは、信号に従うことだけです。また、インジケーターはあなた自身の取引システムの基礎になることができます。取引はミニッツチャートでのみ行われます。 インジケーターがMTFの原則を使用しているという事実にもかかわらず、インジケーターのアルゴリズムは可能な限り安定しています。 購入後、必ず私に書いてください!私の取引設定と推奨事項をあなたと共有します!
                    Indicator : RealValueIndicator Description : RealValueIndicator is a powerful tool designed specifically for trading on the EURUSD pair. This indicator analyzes all EUR and USD pairs, calculates their real currency strength values, and displays them as a single realistic value to give you a head start on price. This indicator will tell you moves before they happen if you use it right. RealValueIndicator allows you to get a quick and accurate overview of the EURUSD currency pair tops and bottoms,
                    まず第一に、この取引インジケーターは再描画されず、再描画されず、遅延しないことを強調する価値があります。これにより、手動取引とロボット取引の両方に理想的なものになります。 ユーザーマニュアル:設定、入力、戦略。 アトミックアナリストは、価格の強さとモメンタムを利用して市場でより良いエッジを見つけるためのPA価格アクションインジケーターです。ノイズや誤ったシグナルを除去し、取引ポテンシャルを高めるための高度なフィルターを備えています。複雑なインジケーターの複数のレイヤーを使用して、アトミックアナリストはチャートをスキャンし、複雑な数学的計算をシンプルなシグナルと色に変換します。これにより、どのような初心者トレーダーでも理解して使用し、一貫した取引の決定を行うことができます。 「アトミックアナリスト」は、新規および経験豊富なトレーダー向けにカスタマイズされた包括的な取引ソリューションです。プレミアムインジケーターとトップノッチの機能を1つの取引戦略に組み合わせ、すべてのタイプのトレーダーにとって汎用性のある選択肢にします。 デイリートレーディングとスキャルピング戦略:高
                    現在26%オフ 初心者やエキスパートトレーダーに最適なソリューション! このインジケーターは、独自の機能と新しい計算式を取り入れた、ユニークで高品質、かつ手頃な価格のトレーディングツールです。たった1枚のチャートで28の為替ペアの通貨強度を読み取ることができます。新しいトレンドやスキャルピングチャンスの引き金となるポイントを正確に特定することができるので、あなたのトレードがどのように改善されるか想像してみてください。 ユーザーマニュアルはこちら  https://www.mql5.com/en/blogs/post/697384 これが最初の1本、オリジナルだ! 価値のないクローンを買わないでください。 特別な サブウィンドウの矢印で強い通貨の勢いを表示 GAPがあなたのトレードを導く! 基準通貨や気配値が売られすぎ・買われすぎのゾーン(外相フィボナッチレベル)にあるとき、個別チャートのメインウィンドウに警告表示。 通貨がレンジの外側から反落した場合、プルバック/リバーサルのアラート。 クロスパターンの特別なアラート 複数の時間枠を選択可能で、トレンドを素早く
                    ご紹介   クォンタム トレンド スナイパー インジケーターは 、トレンド反転を特定して取引する方法を変革する画期的な MQL5 インジケーターです。 13年以上の取引経験を持つ経験豊富なトレーダーのチームによって開発されました。     クォンタムトレンドスナイパーインジケーター   は、非常に高い精度でトレンドの反転を識別する革新的な方法で、あなたのトレーディングの旅を新たな高みに押し上げるように設計されています。 ***Quantum Trend Sniper Indicatorを購入すると、Quantum Breakout Indicatorを無料で入手できます!*** クォンタム ブレイクアウト インジケーターは、トレンドの反転を特定するとアラートを発し、矢印を示し、3 つのテイクプロフィットレベルを提案します。 初心者トレーダーにもプロのトレーダーにも適しています。 量子EAチャネル:       ここをクリック MT5のバージョン:       ここをクリック 推奨事項: 期間: すべての時間枠。最良の結果を得るには、
                    Advanced Supply Demand
                    Bernhard Schweigert
                    4.92 (313)
                    現在33%オフ 初心者にもエキスパートトレーダーにも最適なソリューション このインジケーターは独自の機能と新しい公式を多数内蔵しており、ユニークで高品質かつ手頃な取引ツールです。このアップデートでは、2つの時間枠ゾーンを表示できるようになります。より長いTFだけでなく、チャートTFとより長いTF(ネストゾーンを表示)の両方を表示できます。すべてのSupply Demandトレーダーの皆さんのお気に召すはずです。:) 重要情報の公開 Advanced Supply Demandの可能性を最大化するには、 https://www.mql5.com/ja/blogs/post/720245 にアクセスしてください。   エントリーまたはターゲットの正確なトリガーポイントを正確に特定できれば取引がどのように改善されるか想像してみてください。新しい基盤となるアルゴリズムに基づいて構築されているため、買い手と売り手の間の潜在的な不均衡をさらに簡単に特定できます。これは、最も強い需要と供給のゾーンと、過去のパフォーマンス(古いゾーンを表示)がグラフィカルに表現されるためです。これらの機能は、最適
                    TrendMaestro
                    Stefano Frisetti
                    5 (3)
                    note: this indicator is for METATRADER4, if you want the version for METATRADER5 this is the link:  https://www.mql5.com/it/market/product/108106 TRENDMAESTRO ver 2.4 TRENDMAESTRO recognizes a new TREND in the bud, he never makes mistakes. The certainty of identifying a new TREND is priceless. DESCRIPTION TRENDMAESTRO identifies a new TREND in the bud, this indicator examines the volatility, volumes and momentum to identify the moment in which there is an explosion of one or more of these data a
                    JULY OFFER 80% OFF next price for unlimited version will be 17000$. This is the only time you can get this institutional and professional indicator at this price for unlimited version. Don't dare to miss this. The tool I am about to introduce to you you can't compare it with other tools due to its strategy and accuracy level in predicting the next price directional movement . This tool is designed for serious traders who have decided to make a difference through trading. Be the next person to wi
                    ご紹介     Quantum Breakout PRO は 、ブレイクアウト ゾーンの取引方法を変革する画期的な MQL5 インジケーターです。 13年以上の取引経験を持つ経験豊富なトレーダーのチームによって開発された Quantum Breakout PROは 、革新的でダイナミックなブレイクアウトゾーン戦略により、あなたの取引の旅を新たな高みに押し上げるように設計されています。 クォンタム ブレイクアウト インジケーターは、5 つの利益ターゲット ゾーンを備えたブレイクアウト ゾーン上のシグナル矢印と、ブレイクアウト ボックスに基づいたストップロスの提案を提供します。 初心者トレーダーにもプロのトレーダーにも適しています。 量子EAチャネル:       ここをクリック MT5バージョン:   ここをクリック 重要!購入後、インストールマニュアルを受け取るためにプライベートメッセージを送ってください。 推奨事項: 時間枠: M15 通貨ペア: GBPJPY、EURJPY、USDJPY、NZDUSD、XAUUSD アカウントの種類: ECN、Raw、また
                    Enigmera
                    Ivan Stefanov
                    5 (4)
                    エニグメラ:市場の中核 https://www.enigmera.com はじめに このインディケータと取引システムは、金融市場に対する驚くべきアプローチです。ENIGMERAは、フラクタルサイクルを使用して、サポートとレジスタンスレベルを正確に計算します。本格的な蓄積局面を示し、方向性と目標を示します。 トレンド中でも調整中でも機能するシステムです。 どのように作動するのか? ENIGMERAは、支持線・抵抗線、目標線、乖離線の3つのラインで構成されています。このシステムは、過去のデータを現在と未来に外挿する典型的な市場指標とは異なり、現在の完全な画像を提供します。支持線上にある場合、それは本当の支持を意味し、抵抗線上にある場合、それは本当の抵抗を意味する。ある水準が破られた場合、それはトレンドの変化を意味する。再描画はしない。 市場は常に進化しているため、ENIGMERAはその評価ツールを適応させ、定期的に戦略を修正しています。  これにより、すべてのシナリオが徹底的に評価されることが保証されます。この市場指標の独自性は、その能力を見れば明らかです。  ENIGM
                    Cycle Sniper
                    Elmira Memish
                    4.41 (37)
                    NEW YEAR SALE PRICE FOR LIMITED TIME!!! Please contact us after your purchase and we will send you the complimentary indicators to complete the system Cycle Sniper is not a holy grail but when you use it in a system which is explained in the videos, you will feel the difference. If you are not willing to focus on the charts designed with Cycle Sniper and other free tools we provide, we recommend not buying this indicator. We recommend watching the videos about the indiactor and system before pu
                    TrendDecoder Premium
                    Christophe Pa Trouillas
                    5 (6)
                    レンジと次の動きを特定    |  トレンドの最も早いシグナルと強さを得る   |  反転の前に明確な出口を得る   |  価格がテストするフィボ・レベルを見つける。 非リペイント、非遅延インディケータ - マニュアルおよび自動売買に最適 - すべての資産、すべての時間単位に対応 期間限定キャンペーン   >> 50%OFF 購入後、 推奨セッティングについては、このチャンネルで私に連絡してください。 MT5 バージョン: ここをクリック BladeSCALPER   と   PowerZONES   を使った完全な方法を入手する どのようなものですか? TrendDECODERは、トレンド監視をシンプルかつ簡単にするための複数のイノベーションを集約したものです。 Projective TrendLine (投影トレンドライン) - 今後のトレンドのスピードリファレンス。 RealTime TrendLine vs. Projective TrendLine (リアルタイムトレンドライン vs. Projective TrendLine) - 市場が同じ方
                    現在31%オフ! 初心者やエキスパートトレーダーに最適なソリューション! このインジケータは、独自の機能と秘密の数式を組み込んだ、ユニークで高品質かつ手頃な価格のトレーディングツールです。たった1枚のチャートで28の通貨ペアのアラートを表示します。新しいトレンドやスキャルピングチャンスの引き金となるポイントを正確に把握することができるので、あなたのトレードがどのように改善されるか想像してみてください! 新しい基本的なアルゴリズムに基づいて構築されているため、潜在的な取引の特定と確認がより簡単になります。これは、通貨の強さや弱さが加速しているかどうかをグラフィカルに表示し、その加速のスピードを測定するためです。加速すると物事は明らかに速く進みますが、これはFX市場でも同じです。つまり、反対方向に加速している通貨をペアにすれば、利益を生む可能性のある取引を特定することができるのです。 通貨の勢いを示す縦の線と矢印は、あなたの取引の指針となるでしょう。 ダイナミックマーケットフィボナッチ23レベルはアラートトリガーとして使用され、市場の動きに適応します。もしインパルスが黄色
                    FX Volume
                    Daniel Stein
                    4.61 (36)
                    mql5と Telegramの モーニング・ブリーフィングで、詳細とスクリーンショットを含む毎日のマーケット・アップデートをご覧 ください! FX Volumeは、ブローカーの視点から市場のセンチメントをリアルに洞察する、最初で唯一の出来高インジケーターです。 ブローカーのような機関投資家が外国為替市場でどのようなポジションをとっているか、COTレポートよりもはるかに速く、素晴らしい洞察を提供します。 この情報をチャート上で直接見ることは、あなたの取引にとって真のゲームチェンジャーであり、画期的なソリューションです。 以下のようなユニークなマーケットデータ洞察から利益を得てください。 比率は 、通貨のロングポジションとショートポジションの比率をパーセントで表示します。 比率の変化は 、選択した期間内のロング比率とその変化率を表示します。 Volumes Totalは 、通貨の取引量(ロングとショート)の合計をロット単位で表示します。 Volumes Long :全通貨のロングポジションの取引量を表示します。 Volumes(ショート )は、全通貨のショートポジションの取引量を表示
                    TakePropips Donchian Trend Pro
                    Eric John Pajarillaga Aldana
                    4.61 (18)
                    TakePropips Donchian Trend Pro   (MT4) は、ドンチャン チャネルを使用してトレンドの方向を自動的に検出し、エントリーとエグジットの取引シグナルを提供する強力で効果的なツールです! この多機能インジケーターには、トレンド スキャナー、取引シグナル、統計パネル、スクリーナー、取引セッション、およびアラート履歴ダッシュボードが含まれます。取引シグナルを提供し、チャートを分析する時間を節約するように設計されています! ユーザー マニュアルとインストール ガイドは、ブログ投稿 (   https://www.mql5.com/en/blogs/post/751368   ) からダウンロードできます。 今日は 50% オフ! 98ドルから49ドルに値下げ! このインジケーターは、ストラテジー テスターでテストできます (ビジュアル モードを有効にします)。 詳細については、説明の下にあるビデオ チュートリアルも利用できます。 ご不明な点やサポートが必要な場合は、私に連絡してください。 TakePropips Donchian Trend Pro イン
                    ICT, SMC, SMART MONEY CONCEPTS, SMART MONEY, Smart Money Concept, Support and Resistance, Trend Analysis, Price Action, Market Structure, Order Blocks, BOS/CHoCH,   Breaker Blocks ,  Momentum Shift,   Supply&Demand Zone/Order Blocks , Strong Imbalance, HH/LL/HL/LH,    Fair Value Gap, FVG,  Premium  &   Discount   Zones, Fibonacci Retracement, OTE, Buy Side Liquidity, Sell Side Liquidity, BSL/SSL Taken, Equal Highs & Lows, MTF Dashboard, Multiple Time Frame, BigBar, HTF OB, HTF Market Structure, 
                    これはMT4のインジケーターで、再描画なしで取引に参入するための正確なシグナルを提供します。 外国為替、暗号通貨、金属、株式、インデックスなど、あらゆる金融資産に適用できます。かなり正確な見積もりを提供し、取引を開始して終了するのに最適な時期を教えてくれます。1つのシグナルを処理しただけでインジケーターの元が取れた例の 動画 (6:22)をご覧ください。Entry PointsPro インジケーターの助けを借りたほとんどのトレーダーの最初の1週間の結果が改善しています。 Telegramグループ に登録してください。Entry Points Proインジケーターのメリットは次の通りです。 再描画のないエントリーシグナル 再描画されるインジケーターでは一度表示されたシグナルが削除されて大きな金銭的損失につながることがありますが、これと異なり、表示されて確認されたシグナルは消えることがありません。 エラーなしの取引開始 インジケーターアルゴリズムによって取引を開始する(資産を売買する)理想的な瞬間を見つけることができます。それを使用するすべてのトレーダーの成功率が向上します。
                    Legacy of Gann
                    Pavel Zamoshnikov
                    4.85 (13)
                    The indicator very accurately determines the levels of the possible end of the trend and profit fixing. The method of determining levels is based on the ideas of W.D.Gann, using an algorithm developed by his follower Kirill Borovsky. Extremely high reliability of reaching levels (according to K. Borovsky  - 80-90%) Indispensable for any trading strategy – every trader needs to determine the exit point from the market! Precisely determines targets on any timeframes and any instruments (forex, met
                    このインディケータは、当社の2つの製品 Advanced Currency IMPULSE with ALERT  +   Currency Strength Exotics . のスーパーコンビネーションです。 このインジケーターは全ての時間枠で作動し、8つの主要通貨と1つのシンボルの強弱のインパルスをグラフで表示します。 このインジケータは、金、エキゾチックペア、商品、インデックス、先物など、あらゆるシンボルの通貨強度の加速度を表示することに特化されています。金、銀、原油、DAX、US30、MXN、TRY、CNHなどの通貨強度の加速度(インパルスまたは速度)を表示するために、任意のシンボルを9行目に追加できる、この種の最初のものです。 新しいアルゴリズムに基づいて構築され、潜在的な取引の特定と確認がさらに容易になりました。これは、通貨の強さや弱さが加速しているかどうかをグラフィカルに表示し、その加速の速度を測定するためです。加速すると物事は明らかに速く進みますが、これはFX市場でも同じです。つまり、反対方向に加速している通貨をペアリングすれば、潜在的に利益を生む取
                    プレシジョン・インデックス・オシレーター(Pi-Osc)は、Precision Trading SystemsのRoger Medcalfによるものです。 バージョン2は、チャートにスーパーファストでロードされるように注意深く再コードされ、その他の技術的な改良も組み込まれて、エクスペリエンスを向上させています。 Pi-Oscは、市場が強制的に行かなければならない、すべての人のストップを取り除くためのポイントである、極限のエクソースト・ポイントを見つけるために設計された正確な取引タイミング信号を提供するために作成されました。 この製品は、極限のポイントがどこにあるかを知るという古代の問題を解決し、トレーダーの生活をはるかにシンプルにします。 これは、業界標準のオシレーターとは異なる強力な要素を持つ高度なコンセンサス・インジケーターです。 使用されている一部の機能には、需要指数、マネーフロー、RSI、スティリング、パターン認識、出来高分析、標準偏差の極値などがあり、異なる長さでこれらのバリエーションが多く含まれています。 初めて見ると、訓練されていない目には、他の
                    Welcome to the world of SMC (Smart Money Concepts) Trading, where we empower traders with the tools and knowledge to make smarter trading decisions. Our latest addition to our suite of trading tools is the SMC Trading Pro indicator, version 1.0. Key Features: Major Market Structure Identification with BODY break. Order Block must be in Major Swing ( not Small Swing ). Order Block with Fair Value Gap Detection. Order Block in Discount | Premium zone. Filter for only Bullish, Bearish or All Order
                    ZeusArrow Smart Liquidity Finder  Smart Liquidity Finder is Ai controlled indicator based on the Idea of Your SL is My Entry. It scan and draws the major Liquidity areas on chart partitioning them with Premium and Discount Zone and allows you find the best possible trading setups and help you decide the perfect entry price to avoid getting your Stop Loss hunted . Now no more confusion about when to enter and where to enter. Benefit from this one of it's kind trading tool powered by Ai an trade
                    作者のその他のプロダクト
                    または(TDO)は、「純粋な勢い 」の原則を使用して価格変動率を測定する指標です。 証券価格が10から15に上がると、価格の変化率は150%になりますが、15から10に戻ると、価格の変化率は33.3%になります。そのため、「価格変化率」(ROC)や「モメンタム」などのテクニカル分析指標は、下降するものよりも上昇する価格の動きの方が高い値を示します。 TDOはこの問題を修正して、トレーダーが勢いを正しく読み取るのを支援します。 重要な情報 TDOユーザーズマニュアル: https://www.mql5.com/en/blogs/post/717970 TDO FAQ: https://www.mql5.com/en/blogs/post/722015 TDOビデオライブラリ: https://www.mql5.com/en/blogs/post/722018 TDOエキスパートアドバイザーの例: https://www.mql5.com/en/blogs/post/731141 TDOの機能 TDOは純粋な勢いをパーセントとして計算するため、さまざまな市場のさまざまな
                    Bermaui Manual EA
                    Muhammad Elbermawi
                    5 (10)
                    これは、グリッドシステムを取引する半自動のエキスパートアドバイザーです。アイデアは、市場で徐々にさまざまなポジションを取り、次にそれらの損益分岐点を計算することです。価格がこの損益分岐点を所定の距離だけ通過すると、すべての未決済注文がクローズされます。 重要な情報 ユーザーガイドは次のとおりです。   https://www.mql5.com/en/blogs/post/730567 このEAは、他のどの製品でも試すことができ ます。https://www.mql5.com/en/users/bermaui314/seller 重要な機能 EAには、予期しない結果から取引資本を保護するためのストップロスメカニズムがあります。 EURUSD-XAUUSD-Oil-BitcoinのようなMT4シンボルを取引することができます。 MT4の時間枠をトレードすることができます。 VPSからEAを実行することをお勧めします。 パラメータとデフォルト設定 1)お金の管理設定 ロットを開始します。 レバレッジが1:400以上の場合、デフォルト設定で500ドルごとに0.0
                    MASR Bands
                    Muhammad Elbermawi
                    4.64 (11)
                    または M oving A verage S upportコマンド R esistance バンド 。 MASRバンドインジケーターは、サポートレベルとレジスタンスレベルとして連携する2つのバンドに囲まれた移動平均です。統計的に、MASRバンドには93%の確率で価格キャンドルが含まれています。ステップ単位での計算方法は次のとおりです。 1.最初のステップは、X期間の最高値(HHV)と最低値(LLV)を計算することです。 2. 2番目のステップは、HHVをLLVで割って、それらの間の距離をパーセンテージで取得することです。このステップの結果をMASRフィルターと呼びます。 3. MASRフィルター=合計((HHV / LLV)-1)/バーの数 4.移動平均抵抗のショートカットであるアッパーバンドをMARと呼びます。移動平均サポートのショートカットである低帯域MASと呼びます。バンド間の移動平均は、センターラインと呼ばれます。 5. MAR = MASRセンター+(75%xMASRフィルターxMASRセンター) 6.MASRセンターは移動平均です。
                    または(BD%)は、ポイントではなくパーセントでボラティリティを測定するボラティリティ指数です。 BD%の考え方は、0から100パーセントの間で移動するClassic Standard Deviation(CSD)に応じてインデックスを作成することです。 BD%を使用して、異なる期間または異なる時間枠での同じ証券のボラティリティを比較できます。さらに、BD%を使用して、ポイントではなくパーセントで、さまざまな市場のさまざまな証券間のボラティリティを比較できます。 「BD%」の使い方 BD%が90%未満で、このレベルを上向きに超えた場合、これは価格がさまざまな領域で変動する可能性があることを示しています。 BD%が90%を上回り、その後このレベルを下向きに超え、価格がすでに単純移動平均を上回っている場合、これは新しい上昇トレンドの始まりの兆候です。 BD%がマイナス面に深くなるにつれて、ボラティリティとトレンドの強さが増しています。 BD%が0%の場合、これはボラティリティが最大値にあることを意味します。 BD%が90%を上回り、その後このレベルを下向きに超え、価
                    Bermaui Bands
                    Muhammad Elbermawi
                    4.94 (90)
                    Bermaui Bands(BB)は、レンジとトレンドの価格変動をフィルタリングするのに役立つテクニカル分析ツールです。この指標の背後にある考え方は、次のステップで説明できます。 標準偏差を0〜100の間で移動するオシレーターとして計算します。これをBermaui偏差パーセント(BD%)と名付けます。 「BD%」がゼロに近い場合、ボラティリティは極端になります。さらに、「BD%」が100に近い場合、ボラティリティは非常に低くなります。 ボラティリティが高いということは、トレンド市場の可能性が高いことを意味し、ボラティリティが低いということは、横向きまたはレンジング市場を意味します。 標準偏差はSMAに基づいて計算されるため、中央の線は単純移動平均(SMA)です。 計算で同じバー数の単純移動平均に「BD%」を追加して、アッパーベルマウイバンドを取得します。 計算で同じ数のバーを使用した単純な移動平均から「BD%」を減算して、Lower BermauiBandsを取得します。 重要な情報 Bermaui Bandsユーザーズマニュアル: https://www.mql5.com/en/b
                    Bermaui Pin Bars
                    Muhammad Elbermawi
                    5 (22)
                    ベルマウイピンバー または(BPB)は、チャート上でピンバーの価格アクションパターンを見つけるインジケーターです。ピンバーは「ピノキオバー」のショートカットです。これは、高い上部または下部の影と、ハンマー、逆ハンマー、ハンギングマン、シューティングスター、ドラゴンフライ同事、墓石同事などの非常に小さなボディを持つ日本のローソク足に代わる古典的なバーパターンです。 。 Bermaui Pin Barsインジケーターは、次のステップで説明できる式に応じてこのパターンを見つけます。 最初に、BPBはろうそくの本体の中心を計算します(= [開く+閉じる] / 2)。 次に、BPBは、体の中心とろうそくの間の距離が低いことを検出します。 最後のステップは、ステップ2の結果をろうそくの範囲で割ることです。 ろうそくの本体の中心がろうそくの高さまたは低さに近すぎる場合、BPBはピンバーパターンを検出し、ユーザーに警告します。 ベルマウイピンバーフォーミュラ : https://www.mql5.com/en/blogs/post/729139 以下を追加して、Bermauiピンバーの機能を強
                    この指標のアイデアは、RSIをろうそくの形で描画し、それを価格チャートと比較して売買シグナルを生成することです。指標は私の発明ではありません。私は数年前にインターネット上でそれを設立しました。コードを更新し、アラート機能を追加し、BermauiUtilitiesグループのツールを追加しました。 インディケータはローソク足を引くために使用されるすべての価格のRSIを計算します(始値、高値、安値、終値のRSI)。それらの最も高いものを使用してRSIキャンドルの高い芯を描画し、最も低いものを使用してRSIキャンドルの低い芯を描画します。 RSIキャンドルのボディは高値と安値の間にあります。オープンのRSIがクローズのRSIよりも低い場合、RSIキャンドルは強気と見なされます。オープンのRSIがクローズのRSIよりも高い場合、RSIキャンドルは弱気と見なされます。 どうやって使うのですか RSIキャンドルインジケーターでトレンドラインブレイクアウトをトレードすることができます。これは、勢いが価格をリードするため、価格チャートのトレンドをリードします。 RSIキャンドルインジケーターに任意
                    Moving Average Cloud
                    Muhammad Elbermawi
                    4.93 (14)
                    または「MAC」。 これは、トレンドをキャプチャしてトレードするのに役立つように設計されたインジケーターです。この指標の背後にある考え方は、次のステップで説明できます。 移動の速い平均エンベロープを描画します。 移動の遅い平均エンベロープを描画します。 MACアッパーバンドは、両方のエンベロープの高値の間の最大値です。 MAC下限帯域は、両方のエンベロープの下限間の最小値です。 MACヒストグラムクラウドは、2つのバンド間の距離を埋めて、方向の変化を示します。 青い雲は上昇傾向を示し、赤い雲は下降傾向を示します。 次のブログを読んで、MACバッファーを使用して独自のEAまたはスキャナーを構築する方法を確認してください。 https://www.mql5.com/en/blogs/post/734293 MACの使い方 トレンドの方向性を特定するのに役立つフィルターとしてMACクラウドを使用します。 通常の取引ツールを使用してMACクラウドの方向に取引し、誤ったシグナルを可能な限り排除します。 提案されたエントリ矢印を使用して、開始する強力なトレンドポイントを見つ
                    BACD Cloud
                    Muhammad Elbermawi
                    4.57 (7)
                    または、 B ermaui A verage C onvergence D ivergence Cloud は、トレンドの方向を示し、その強さをパーセントで測定するオシレーターです。 BACDクラウドの計算は次のとおりです。 1-2つの指数移動平均を計算します。それらの1つは他よりも高速です。最初の(速い)と2番目の(遅い)と呼びます 2-それらの間の中心を見つけます。ここで、Center MA =(Fast + Slow)/ 2 3-次のようにBACDラインを計算します。BACD= 100 *(高速/中央MA) 4-BACDの指数移動平均であるBACD信号線を計算します。式は次のようになります。BACDSignal= EMA(BACD) 5-チャートからBACDシグナルラインを非表示にします。 6- BACDヒストグラムラインを計算します。これは、BACDラインとその信号ラインの差です。 (注:BACDヒストグラムは、ヒストグラムではなく線としてチャートに描画されます。) 7-(BACD Line> BACD Histogram Line)の場合、
                    Or DBD%. The indicator consists of colored tape that shows trading signals depending on two Bermaui Deviation Oscillator (BD%) and two moving averages. Bermaui Deviation Percent is a volatility index that measures volatility in percent rather than points. The idea of BD% is to make an index depending on Classic Standard Deviation (CSD) that moves between 0 and 100 percent. Important Information DBD% expert advisor example:  https://www.mql5.com/en/blogs/post/731145 If you want to know mor
                    Bermaui Channel
                    Muhammad Elbermawi
                    5 (27)
                    This is a price channel that shows five important price levels on the chart. Those levels are: 1. The Highest High (HH) of the previous x bars. 2. The Highest Low (HL) of the previous x bars. 3. The Center Line. 4. The Lowest High (LH) of the previous x bars. 5. The Lowest Low (LL) of the previous x bars. How does Bermaui Channels Captures Overbought  area Think of the distance between HH and HL levels as an overbought area. When the price candles or bars crosses the HL to the upside this
                    Horus EA
                    Muhammad Elbermawi
                    3.67 (3)
                    MT4用のHorusEA 数千年前、古代エジプト人は、自分たちの土地を測定し、商品を計量するために使用するカウントシステムを発明しました。 このシステムは「ホルスの目 」として知られていました。 ホルスの目はオシリス神の神話と関連付けられており、ファラオの神聖なシンボルの1つになりました。 私は、フィボナッチ数列を使用したEye of Horusの数式を使用して、有名な「マルチンゲールシステム」よりも89%安全なネガティブプログレッションマネー管理システムを構築しました。 EAの技術的な部分は、 移動平均クラウド(MAC) と ストキャスティクスに 依存しています。 MACストキャスティクステクニカル分析システムはどのように機能しますか? 1-移動平均クラウド(MAC)が強気の場合、ストキャスティクスが売られ過ぎのレベルを下から横切ると、EAは買い注文を受け取ります。 2-移動平均クラウド(MAC)が弱気の場合、ストキャスティクスが買われ過ぎのレベルを上から横切ると、EAは売り注文を受け取ります。 EAの重要な機能 1-セットごとに1つの取引。 2-明確なス
                    フィルタ:
                    udayan datta
                    681
                    udayan datta 2024.01.27 11:51 
                     

                    Indicator looks perfectly good and working fine, looking forward to learn it

                    leroy
                    305
                    leroy 2023.06.03 01:25 
                     

                    I started reading about the Keltner Channel and was surprised to see a simple yet effective indicator being sold/rented for a good price. I recently just rented the indicator and plan to test it out with my personal strategy. Thanks for creating this indicator!

                    elite luis
                    3331
                    elite luis 2023.03.06 14:06 
                     

                    Author very responsive and fully provide video tutorial on how to use, add as another layer of confluence nice! Thanks!

                    davevicens
                    321
                    davevicens 2022.12.22 16:03 
                     

                    Very good indicator. , i use it together with bermaui bands . It´s amazing!!!!

                    Thin Vu Xuan
                    270
                    Thin Vu Xuan 2022.12.07 03:06 
                     

                    Good

                    prim forex
                    90
                    prim forex 2022.11.03 02:43 
                     

                    To be honest, I like the indicaor best now. It was no too difficult until start Mekong pips. Highly recommended.

                    Muhammad Elbermawi
                    52356
                    開発者からの返信 Muhammad Elbermawi 2022.11.03 05:04
                    Thanks, Hiro Koyama
                    mrkaib
                    1074
                    mrkaib 2022.10.13 19:33 
                     

                    very good indicator

                    luis066
                    29
                    luis066 2022.09.03 20:38 
                     

                    this is a great product, i use it together with bermaui bands and i always have the correct view of the market. low price and a lot of quality.

                    awasthisp
                    764
                    awasthisp 2022.08.23 13:27 
                     

                    No doubt about his software's result and grade . Previous to this i have already purchased and rented his maximum software nothing doubt about any thing.

                    rodbizness
                    84
                    rodbizness 2022.06.11 01:20 
                     

                    Muhammad, thank you so much for the Big Job.

                    deimy
                    563
                    deimy 2022.04.15 00:55 
                     

                    Very good indicator, thank you

                    Doctornoob
                    329
                    Doctornoob 2022.03.25 22:44 
                     

                    good addition to my trading

                    yellowplus2009
                    242
                    yellowplus2009 2022.03.19 10:22 
                     

                    Great product.Highly recommended indicator.

                    moayad alhadidid
                    33
                    moayad alhadidid 2022.02.16 13:33 
                     

                    I bought the product for a month to try it, and the CKC oscillator did not appear

                    Muhammad Elbermawi
                    52356
                    開発者からの返信 Muhammad Elbermawi 2022.03.18 17:45
                    If there is any problem then why didn't you contact me?!
                    OLADIMEJI ADEBAJO IWALESIN
                    3911
                    OLADIMEJI ADEBAJO IWALESIN 2022.01.27 06:52 
                     

                    Great indicator from Muhammad as always. 5***** buy and sell entry points.

                    ck15220
                    714
                    ck15220 2021.10.18 15:39 
                     

                    Very good indicators make me make a lot of profits. Thank you

                    Muhammad Elbermawi
                    52356
                    開発者からの返信 Muhammad Elbermawi 2021.10.18 18:07
                    Thanks, my friend. I appreciate it. 🙏💚
                    adonis4ex
                    6308
                    adonis4ex 2021.10.01 03:26 
                     

                    ユーザーは評価に対して何もコメントを残しませんでした

                    Muhammad Elbermawi
                    52356
                    開発者からの返信 Muhammad Elbermawi 2021.10.02 08:38
                    Thanks, Adonis. I appreciate it. 🙏💚
                    Johnny Long
                    99
                    Johnny Long 2021.09.27 14:54 
                     

                    the product and the author is great!

                    Muhammad Elbermawi
                    52356
                    開発者からの返信 Muhammad Elbermawi 2021.10.01 09:10
                    Thanks 🙏💚
                    James Wioos
                    412
                    James Wioos 2021.08.16 18:07 
                     

                    A fantastic indicator by the Author, best indicator for new traders and experienced trader. Definelty recommand any product by Muhammad, this is my second product by this author and I am very happy with the performance of the indicator.

                    Muhammad Elbermawi
                    52356
                    開発者からの返信 Muhammad Elbermawi 2021.08.16 22:23
                    🙏 Thanks a lot for your trust, James. ✅ I hope that you enjoy all the trading examples on the telegram channel:
                    https://t.me/BermauiChannel
                    ambho
                    90
                    ambho 2021.07.05 20:32 
                     

                    Good service and indicator

                    Muhammad Elbermawi
                    52356
                    開発者からの返信 Muhammad Elbermawi 2021.08.06 21:48
                    Thanks for the great review and stars 🙏💚
                    You can join my telegram group from here:
                    https://t.me/BermauiChannel
                    123
                    レビューに返信
                    バージョン 2.2 2020.03.08
                    Added a buffer for Signals to make it easy for developers to use the indicator in building expert advisors.

                    The new buffer is no. 2. It is called "BuySell". It works Like this:
                    1) If BuySell = +1 then buy
                    2) If BuySell = -1 then Sell
                    バージョン 2.1 2020.03.02
                    Added an icon to the description.
                    バージョン 2.0 2020.02.26
                    1. Enhanced the calculation method.
                    2. Added color lists, for a better chart view.
                    3. Enhanced all the alerts.
                    4. Arranged the inputs to be more user friendly.
                    5. Added buffers to indicator description.
                    .
                    Note:

                    I didn't make any changes on CKC basic formula. It is still the same.
                    I didn't make any changes in the indicator buffers.