Currency Relative Strength
- インディケータ
- Ziheng Zhuang
- バージョン: 5.40
- アップデート済み: 1 8月 2024
- アクティベーション: 5
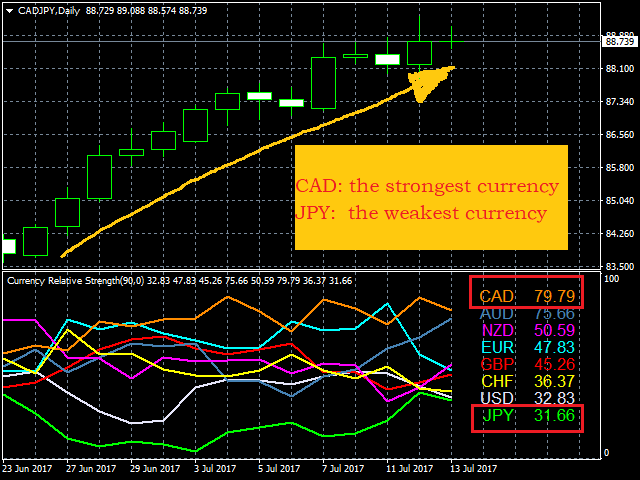
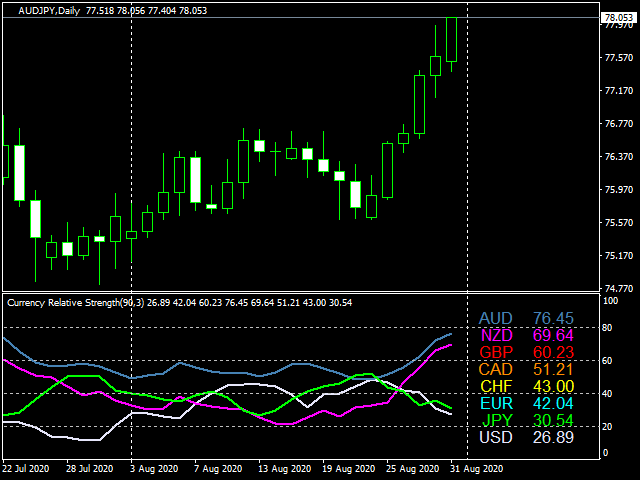
この指標は、8 つの主要通貨 (USD、EUR、GBP、AUD、NZD、CAD、CHF、JPY) の相対的な強さを示します。
力の値は 0 ~ 100 の範囲で正規化されます。
- 60 を超える値は強いことを意味します。
- 40未満の測定値は衰弱を示します。
基本原則
USD、EUR、GBP、AUD、NZD、CAD、CHF、JPYの8つの通貨ペアがあり、それぞれ2つのペアを組み合わせると合計28のペアになります。逆アルゴリズムを使用して、8つの通貨の強さを抽出します。これらの28のペアのうち
EURUSD,GBPUSD,AUDUSD,NZDUSD,
USDCAD,USDCHF,USDJPY,EURGBP,
EURAUD,EURNZD,EURCAD,EURCHF,
EURJPY,GBPAUD,GBPNZD,GBPCAD,
GBPCHF,GBPJPY,AUDNZD,AUDCAD,
AUDCHF,AUDJPY,NZDCAD,NZDCHF,
NZDJPY,CADCHF,CADJPY,CHFJPY
主な用途
- 強度値が 60 を超えると強いことを意味し、40 未満は弱いことを意味します。
- 最も強い通貨を買い、最も弱い通貨を売ります。
- すべての通貨が 40 ~ 60 の範囲にある場合、それは市場が安定していることを意味します。
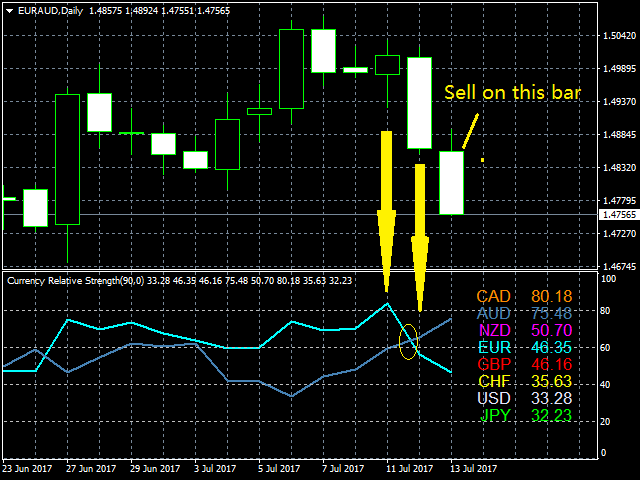
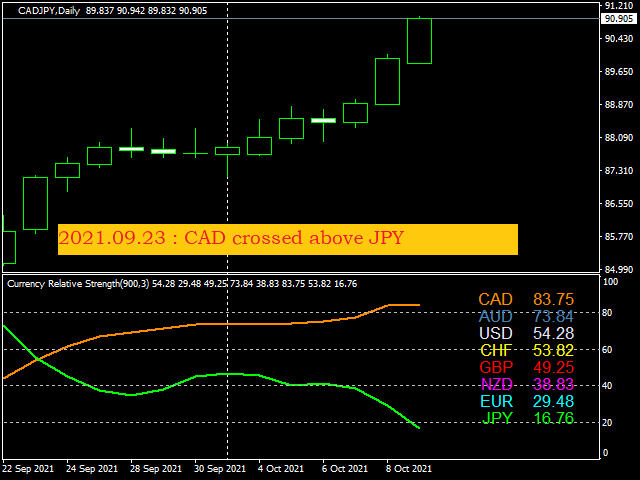
- あなたが長期トレーダーの場合。 2 つの通貨がクロスした後にペアを取引するのが最善です。
- 通貨が60を超えて60を超えると、通貨が強くなっているということになります。
- 通貨が40を超えて40を下回る場合、それは通貨が弱まっていることを意味します。
- コインが 20 未満のレベルから 20 を超えるレベルになった場合は、販売を中止するのが最善です。
- コインが 80 を超えて 80 を下回った場合は、購入を中止するのが最善です。
購入する前に、無料のアドバイザー (ペア パワー インデックス) を試すことができます。
このアドバイザーは、28 ペアの評価、手動取引、自動ネットワーク取引、トレーリング ストップを使用した注文管理、および利益保護を提供します。 Pair Power Index Helper
チケット
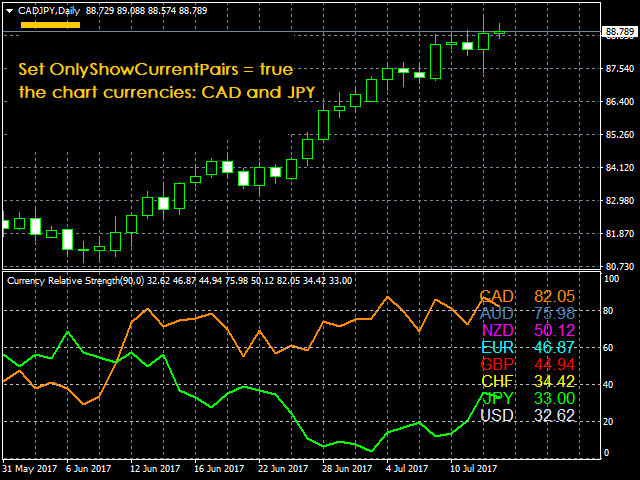
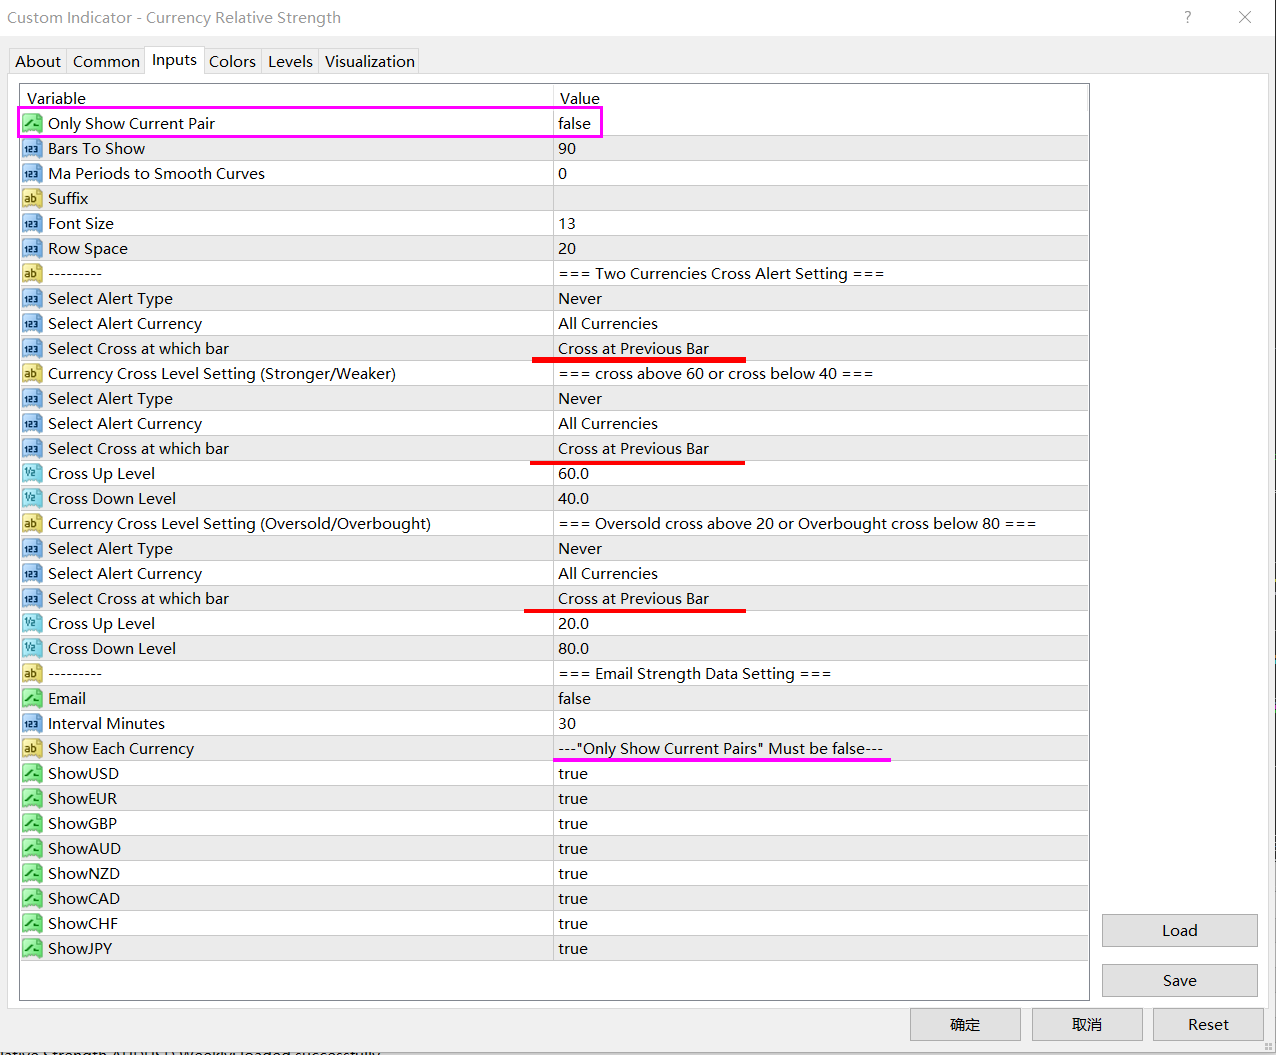
- Only Show Current Pair - true の場合、現在のチャート ペアのみが表示されます。それ以外の場合は、8 つの曲線すべてが表示されます。
- Bars To Show - フォース カーブを表示するバーの数。
- Ma Periods To Smooth Curves : 強度曲線を平滑化するための移動平均期間
- Suffix - 文字の接尾辞。今すぐインストールする必要はありません。
- Font Size - 画像のフォント サイズ、デフォルトは 13
- Row Space - 描画線間の間隔、デフォルトは 17
2 つの曲線が交差したときに警告を発するために、次の 3 つの入力が提供されます。
- Select Cross at which bar - 現在のバーまたは前のバーを選択できます。
- Alert Type - これは、アラームを越えるための 8 つのオプションを持つ入力です。これは決して警告を意味するものではありません。
- Alert Currency- – 8 つの通貨をすべて選択するか、チャート上の現在の通貨のみを選択します。
次の 2 つの入力は、8 つの曲線の力の値を送信することを目的としています。
- Email - 電子メールを送信して、新しい足または特定の分数後に強度データを受信します。
- Interval Minutes - 0 の場合、新しい行で電子メールを送信します。それ以外の場合は、指定された分数後に電子メールを送信します。
次の 5 つの入力は、曲線がレベル 60 (最も強い) を超えるか、レベル 40 (最も弱い) を下回るときに警告を発するように設計されています。
- Alert Type - これは 8 つのオプションの入力です。これは決して警告を意味するものではありません。
- Alert Currency - 8 つの通貨すべてを選択するか、チャートから現在の通貨だけを選択します。
- Select Cross at which bar 。現在のバーまたは前のバーを選択できます。
- Cross Up Level - 交差点用レベル、標準 60。
- Cros sDown Level - 減少するレベル、デフォルトは 40。
次の 5 つのエントリーは売られすぎ (目標通貨が 20 を超える) または買われすぎ (目標通貨が 80 未満) のものです。
- Alert Type は 8 つのオプションの入力です。これは決して警告を意味するものではありません。
- Alert Currency – 8 つの通貨をすべて選択するか、チャート上の現在の通貨のみを選択します。
- Select Cross at which bar - 現在のバーまたは前のバーを選択できます。
- Cross Up Level – クロスオーバー レベル、デフォルトは 20。
- Cross Down Level – 越えるレベル、デフォルトは 80。
このインジケーターには、28 ペアすべてからのデータが必要です。コンサルタントにデータをダウンロードすることをお勧めします: https://www.mql5.com/en/blogs/post/728216
開発者がエキスパートアドバイザーで呼び出すことができるデモコード: https://www.mql5.com/en/blogs/post/730961 。

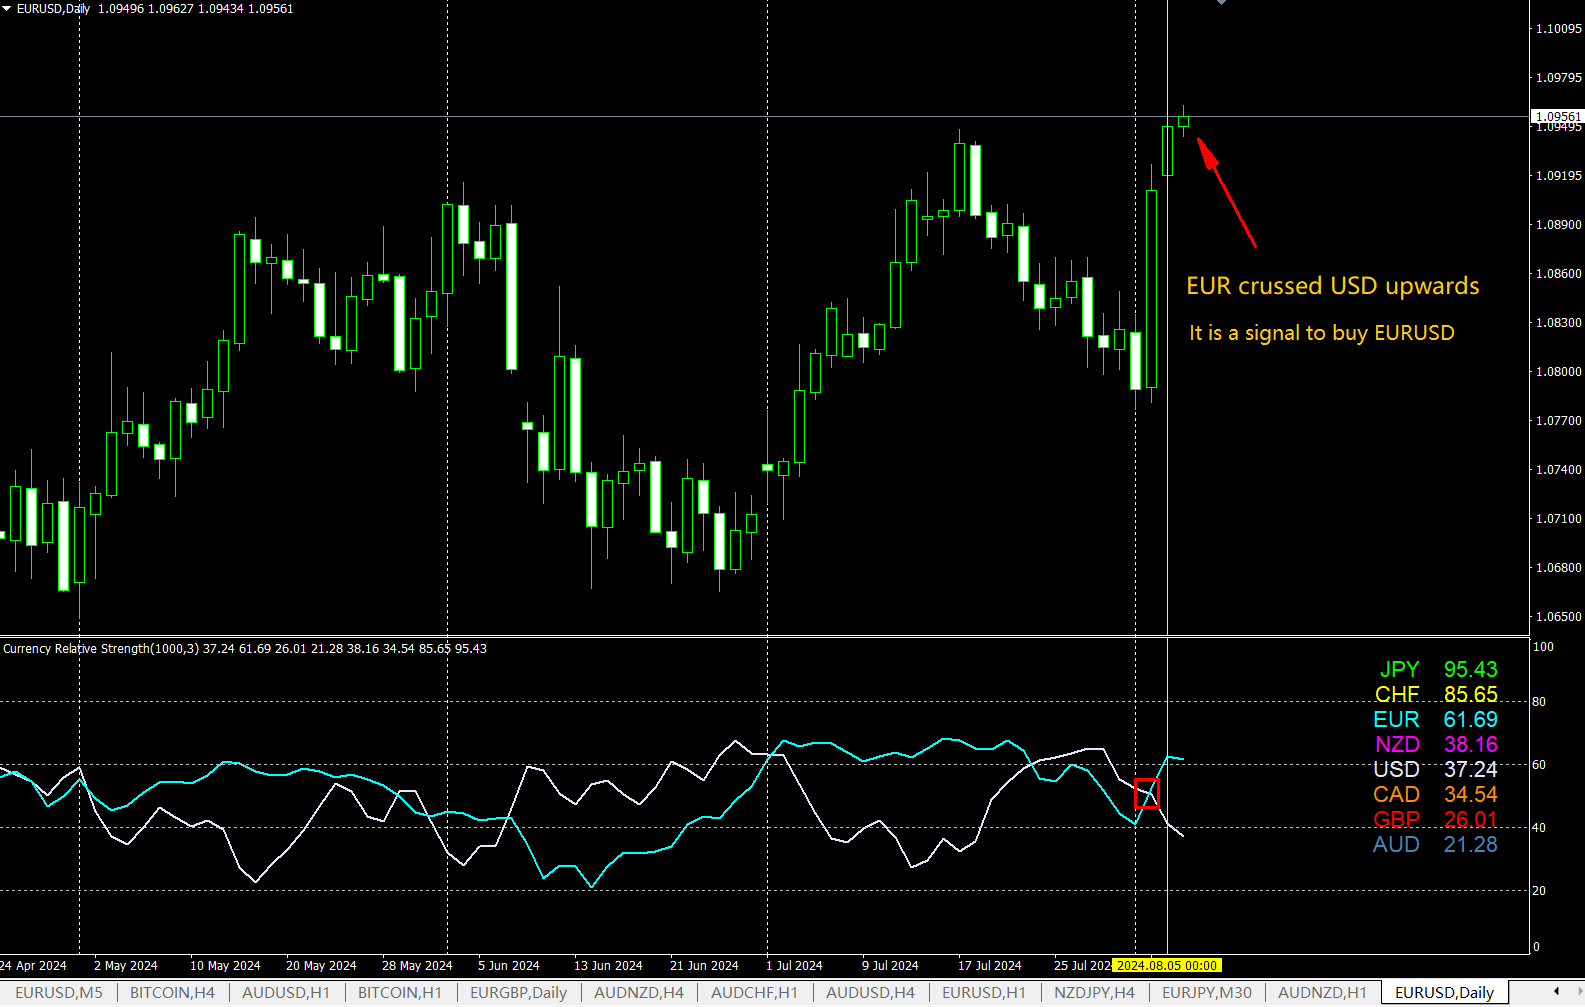


believe that compared to most trend indicators, the “Currency Relative Strength” provides a clearer directional signal for currency pair movements and is more forward-looking