Easy Daily Open
- インディケータ
- Simon Busley
- バージョン: 2.1
- アップデート済み: 22 6月 2019
This indicator lets you easily mark the daily open levels on a chart with several possibilities of customization.
For many trading strategies, the daily open level is an important level to base trading decisions on. That is why I chose to create this indicator that is designed to assist you with trading these strategies, as well as further optimizing them and getting a general understanding of the markets movements. With this tools help, you can easily take a look at the previous price action around these daily open levels, even from different time zones.
Function
This indicator automatically selects the daily opening times of the chart that it runs on and marks those times with a horizontal trend line.
Using the option called "Time Shift", you can let the program imitate the levels that would be displayed in another time zone. This is very helpful for testing and executing a strategy in different market conditions, which can help you increase your trading profits. It also helps you find a time zone in which the price movement suits you and your strategy the best.
You can even use this program to simply bring more structure into your charts, as it helps you to more easily distinguish where one day ends and the other begins.
Input Parameters
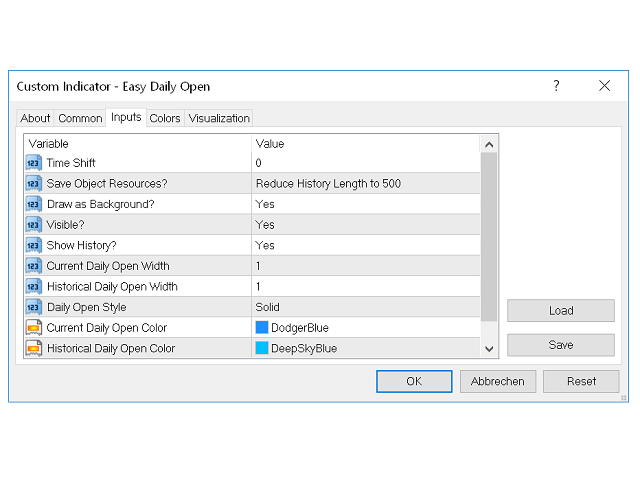
- Time Shift - As explained above, you can use this option to show the daily open levels from another time zone. It is mainly recommended for the use in forex markets where there are no fix market close and open times and therefore the ability to choose a different hour for the beginning of one period can be very useful.
- Save Object Resources? - If you think that the program needs to much time to load or you simply do not need a long history, you can use this option to limit the amount of levels that get loaded into the history. If the program calculates less levels, it needs less time to load. Because it is already relatively fast, limiting the history size should not be necessary here most of the time.
- Draw as Background? - Set whether you want the price levels to be drawn in the background or in the foreground. If you set it to "Yes", the level will get drawn in the background, meaning that it cannot cover up your charts.
- Visible? - This Option lets you quickly make the price levels invisible, giving you free sight on the charts without having to delete the indicator from your client terminal having to completely reload it again later.
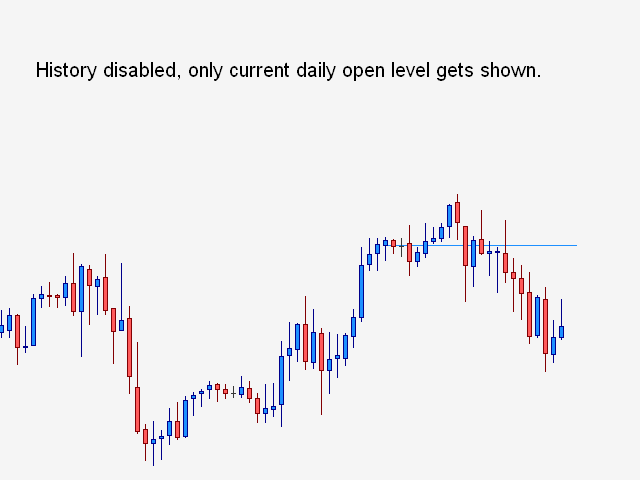
- Show History? - Set if historical daily open levels should be displayed on your charts or only the current level.
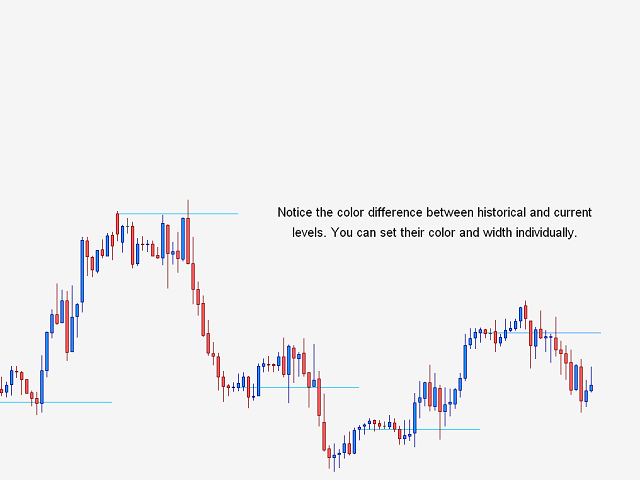
- Current and Historical Daily Open Width - Set the width of the current and historical levels individually.
- Daily Open Style - Set the style of the levels (for example solid, dashed, dotted etc.
- Current and Historical Daily Open Color - Set the color of the current and historical levels individually.
Note
- If you like this product, you might also like my Pivot Points indicator.







Very good.